3 Davenport Ct · Hampton, VA
Flood risk 1/10 · Minimal
- FEMA flood zone
- X (unshaded)
- Chance of flooding over 30 yrs
- 0.0%
- Est. flood insurance / yr
- $507 – $1,088
Fire risk 3/10 · Minor
- Est. fire insurance / yr
- $666 – $1,236
Heat risk 9/10 · Severe
- Hot days now (above 105°F)
- 7 days/yr
- Hot days in 30 yrs
- 17 days/yr
Wind risk 8/10 · Major
- Chance of severe wind over 30 yrs
- 80.0%
Air-quality risk 2/10 · Minimal
- Unhealthy air days now
- 2 days/yr
- Unhealthy air days in 30 yrs
- 2 days/yr
Risk factors via First Street. Map © Google.
Why this score? — see what drove the D grade
The composite is a weighted blend of 9 inputs, each scored 0–100. Each bar is that input's sub-score; the figure is the points it added to the 100-point composite (weight × sub-score).
- Cash flow +10.1/30.0
- ARV discount +7.5/15.0
- Schools +5.5/10.0
- 1% rule +5.2/10.0
- Condition / age +4.0/5.0
- Livability +3.8/5.0
- Rent growth +3.5/5.0
- DSCR +2.9/10.0
- Appreciation +0.0/10.0
$125,000
🖨 Deal sheet 📄 Offer letter ✓ Due diligence
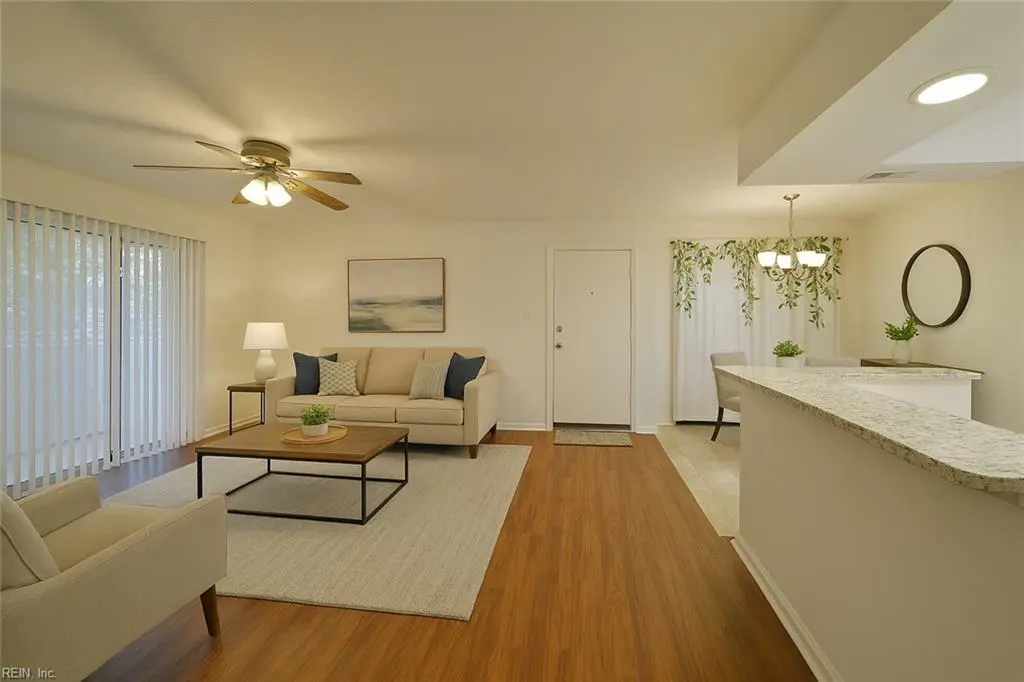
Listing remarks
Nestled in the gated Hampton Club community, this beautiful first-floor condo offers modern comfort and effortless living. The interior shines with new kitchen and bath cabinets (2025), new granite countertops (2025), new appliances (25/26), new paint (2026), new flooring (25/26), and new HVAC (2022). Enjoy the ease of ground-floor access and summer days by the community pool. Located a short commute to Sentara CarePlex, NASA, Langley Air Force Base, and Virginia Peninsula Community College. Weekends are a breeze with Peninsula Town Center's dining and shopping nearby and quick access to I-64. This turn-key retreat is a rare find for anyone seeking a low-maintenance and thoughtfully updated
Key facts
- New flooring
- New paint
- New appliances
Tags
Property features AI
Finance
- HOA & community: HOA (Hampton Club Condos) managed by Abbitt Mgmt; Monthly condo fee of $194; Community amenities: clubhouse, playgrounds, pool, security
Exterior
- Parking: Assigned/reserved parking
- Security: Community security
- Utilities: City/County water; City/County sewer; Electric water heater; Electric power
- Home design: Attached condo; Apartment-style unit; Single-story; Condo on level 1; Slab foundation; Condo ownership
- Construction: Vinyl exterior siding; Asphalt shingle roof; Slab foundation
- Exterior features: Patio; Vinyl siding; Asphalt shingle roof
Interior
- Kitchen: Dishwasher; Electric range; Refrigerator
- Bedrooms: First-floor bedroom
- Flooring: Laminate
- Bathrooms: One full bathroom
- Heating & cooling: Heat pump; Forced hot air
- Interior features: Laminate flooring; Bedroom and full bathroom on the first floor
- Laundry & utility: Washer; Dryer
Neighborhood map
What this means for you Summary
Snapshot
- This is a 2-bed/1.0-bath condo listed at $125k. Condition is rated good.
Deal economics
- At list price, monthly cash flow is $-74 ($-888/yr) — negative.
- To cash-flow at today's rent, offer at most $114k (8.6% below list).
- Meets the 1% rule at list price ($1k rent vs $125k).
- Recommended offer: $114k (8.6% below list) — sets the bar for cash-flow.
- Cap rate 5.6% vs local median 4.5% in Hampton — meaningfully above typical; check what's discounted (condition, days-on-market, listing class) to confirm the premium yield is real.
Location & tenants
- Location reads 75/100 on livability (#133 in VA, #4,302 nationally) — a middle-class / working-renter tenant base. Strengths: housing A+, health & safety A+, cost of living A; Watch: crime C-, amenities D+, commute F.
- Hampton City Public School District (urban): math 60% / reading 70% proficiency, ranked #40 of 131 in VA (top 30%) — acceptable for families but not a draw, mixed tenant base, ~2y average lease.
- Zoned schools: Bethel High (math 64% / reading 84%, grade B+, #120 of 319 statewide, top 38%, 1,777 students, 86% FRL) — zoned schools average 86% FRL vs 49% district-wide (37 pts higher); higher-poverty schools than district average — tighter screening recommended.
- Market conditions: Rents rising fast (+4.0%/yr); 231 active listings in the ZIP; 16 comparable units currently listed for rent nearby; rentals at typical pace (median 24d on market — plan ~3-4 weeks tenant-placement turnaround); 44% of comp listings sitting > 30 days — soft ceiling on asking rent; 68 units permitted in Hampton city in 2024 (0 in 5+ unit buildings).
Forward outlook
- Local home prices are declining (-3.0%/yr); year-one equity from $864 of loan paydown is wiped out by about $4k of value loss. Plan a longer hold.
- Hampton County population projected at -13% by 2050 — secular population decline; favor cash flow + early exit over multi-decade hold.
Negotiation context
- Only 6 days on market — expect competitive offers; lowballing is unlikely to land.
Risks & watch-outs
- Climate carrying-cost: severe wind risk, 80% chance of damaging wind over 30y; extreme-heat days projected 7→17/yr by 2055 (HVAC capex compounding) — expect insurance premiums to compound above CPI over the hold.
Questions for the listing agent
- What do current leases actually rent for vs. the listed asking? Can we see a recent rent roll and the last 12 months of T-12 income?
- What does the HOA fee cover, when was the last increase, and are there any pending special assessments or reserve-fund shortfalls?
- Any open or pending special assessments — roof, HVAC, plumbing, elevator, façade? What's the per-unit balance and payoff schedule, and is the seller paying it off at close or rolling it to the buyer?
- Is there a deadline driving the sale (1031 exchange, divorce, estate, relocation)? That informs how much negotiation room exists.
- Schools are B-rated — typically a magnet for longer-tenancy family renters. What's the average tenant stay here, and is there a school-zone premium baked into asking?
- The area grade is low — what's the realistic commute time and amenity access for the typical tenant pool here? Any planned neighborhood developments (good or bad) we should know about?
- What's the average days-on-market for RENTAL listings here right now (not sales)? A rising rental-DOM trend means longer vacancies and softer asking-rent achievability than the comps imply.
- What's the recent tenant-quality profile in this submarket — average credit score on applications, eviction rate, late-payment / NSF rate, and stable-employment percentage? A property-management company in the area should have these aggregated.
- How much new apartment / multifamily construction is in the pipeline within 1–3 miles? Heavy new supply (>2% of stock underway) typically softens rents 12–24 months out; light construction supports rent growth.
Investment metrics
- 1% rule
- 1.02% ✓
- Cap rate
- 5.58%
- Cash-on-cash
- -2.54%
- DSCR
- 0.89
- GRM
- 8.2
CMA / ARV
No comps found within radius.
Projected returns pro-forma
-3.0% appreciation · 4.05% rent growth · sell at horizon
- IRR
- -18.9%
- Equity multiple
- 0.33×
- Total profit
- $-23,462
- Equity at exit
- $18,638
- IRR
- -8.7%
- Equity multiple
- 0.42×
- Total profit
- $-20,207
- Equity at exit
- $10,808
Cash invested: $35,000 (down + closing). Projections, not guarantees.
Landlord ↔ Tenant lean methodology
- Overall (STATE)
- 55 Moderately Landlord-Leaning
- State Virginia
- 55 Moderately Landlord-Leaning · D+2
- County
- — inherits STATE
- City
- — inherits STATE
ZIP-level market 23666
- Home prices YoY
- -15.7%
- Rents YoY
- 4.0%
- Active inventory
- 231
- Price-to-rent
- 8.2×
Monthly cashflow live
- Estimated rent
- $1,269 high interval (Pro) →
- Mortgage (P&I)
- −$656
- Tax est. 1.5%
- −$156 /mo · $1,875/yr
- Insurance
- −$52
- HOA
- −$213
- Vacancy / Maint / Mgmt
- −$267
- Net cashflow
- $-74
Break-even live
UW: 25.0% down · 7.5% · 30yr · 1.5% tax · 5.0% vac · 8.0% maint · 8.0% mgmt
Financing live
Cash to close
- Down payment
- $31,250
- Closing costs
- $3,750
- Reserves months
- —
- Total cash needed
- —
Loan-product check · same deal, 3 products live
Conventional
25% down · 7.5% · 30yr
- Down + closing
- —
- Monthly P&I
- —
- Monthly cashflow
- —
- DSCR
- —
- Eligible?
- —
Personal DTI + credit; lowest rate.
DSCR
20% down · 8.5% · 30yr
- Down + closing
- —
- Monthly P&I
- —
- Monthly cashflow
- —
- DSCR
- —
- Eligible?
- —
No personal income docs; deal must DSCR.
Hard money
10% down · 12.0% · 12mo
- Down + closing
- —
- Monthly P&I
- —
- Monthly cashflow
- —
- DSCR
- —
- Eligible?
- —
Short-term bridge; refi at stabilization.
Rent comps 16 comps
| Address | Beds | Baths | Sqft | Rent | $/sqft | DOM | Units | Dist |
|---|---|---|---|---|---|---|---|---|
| 131 Davenport Ct Unit 131 Hampton, VA | 1.0 | 1.0 | 602 | $1,200 | $1.99 | 44d | 1 | 0.02mi |
| 133 Hampton Club Dr #3 Hampton, VA | 1.0 | 1.0 | 607 | $1,165 | $1.92 | 44d | 1 | 0.07mi |
| 139 Haverford Ct Hampton, VA | 1.0 | 1.0 | 602 | $995 | $1.65 | 24d | 1 | 0.08mi |
| 139 Haverford Ct Hampton, VA | 1.0 | 1.0 | 602 | $1,095 | $1.82 | 44d | 1 | 0.08mi |
| 140 Haverford Ct Unit 1 Hampton, VA | 2.0 | 1.0 | 734 | $1,250 | $1.70 | 24d | 1 | 0.08mi |
| 133 Haverford Ct Hampton, VA | 1.0 | 1.0 | 602 | $1,200 | $1.99 | 24d | 1 | 0.09mi |
| 59 Wells Ct Hampton, VA | 1.0 | 1.0 | 602 | $1,025 | $1.70 | 44d | 1 | 0.09mi |
| 126 Wells Ct Hampton, VA | 1.0 | 1.0 | 602 | $1,100 | $1.83 | 17d | 1 | 0.09mi |
| 102 Wells Ct Hampton, VA | 2.0 | 1.0 | 734 | $1,200 | $1.63 | 44d | 1 | 0.10mi |
| 326 Wells Ct Hampton, VA | 1.0 | 1.0 | 650 | $1,150 | $1.77 | 44d | 1 | 0.12mi |
| 260 Marcella Rd Hampton, VA | 1.0–2.0 | 1.0–2.0 | 825 | $1,838 | $2.23 | 2d | 18 | 0.42mi |
| 2 Wyndham Dr Hampton, VA | 1.0–2.0 | 1.0–2.0 | 749 | $1,864 | $2.49 | 44d | 10 | 0.48mi |
| 101 Signature Way Hampton, VA | 1.0–3.0 | 1.0–2.0 | 956 | $1,999 | $2.09 | 2d | 13 | 0.66mi |
| 2632 N Armistead Ave Hampton, VA | 1.0–2.0 | 1.0–1.5 | 735 | $1,390 | $1.89 | 2d | 10 | 1.13mi |
| 2018 Cunningham Dr Hampton, VA | 1.0–3.0 | 1.0–1.5 | 997 | $1,538 | $1.54 | 2d | 25 | 1.23mi |
| 135 Pine Chapel Rd Hampton, VA | 1.0–2.0 | 1.0–1.5 | 830 | $1,490 | $1.80 | 2d | 9 | 1.37mi |
HOA detail condo
- Monthly dues
- $213 · $2,556/yr
- Likely covers
- poolsecurity
- Assessments
- None detected in remarks — confirm with the listing agent.
Listing history 1 events
-
2026-05-23$125,000 Active
ⓘ Source: listings_history table (triggers on properties + properties_extension) + one-shot
backfill from property_details.listing_events for pre-trigger history.
Climate risk First Street
- Flood 1/10 Low FEMA zone X (unshaded) · 0% chance over 30 yrs
- Wildfire 3/10 Moderate
- Heat 9/10 Extreme 7 d/yr ≥105°F today · 17 d/yr by 30 yrs out
- Wind 8/10 Severe 80% chance of damaging wind over 30 yrs
- Air quality 2/10 Low 2 unhealthy d/yr today · 2 by 30 yrs out
Nearby sold comps map
Loading sold comps map…
Walkable amenities ~0.75 mi
Loading nearby amenities…
Taxation est. · year 1
- Rental income
- $15,233
- − Mortgage interest
- −$7,002
- − Property taxes
- −$1,875
- − Insurance
- −$625
- − Repairs & maintenance
- −$1,219
- − Management
- −$1,219
- − HOA
- −$2,556
- − Depreciation
- −$3,636
- Taxable loss
- −$2,898
- Est. tax savings @ 24.0%
- +$696
- After-tax cash flow
- $-192/yr
For passive investors: Depreciation is non-cash, so a rental often shows a tax loss while cash-flowing — sheltering income. Rental losses are passive: they offset passive income freely, and up to $25,000/yr can offset ordinary (W-2) income if you actively participate and your MAGI is under $100k (phasing out to $0 by $150k); unused losses carry forward. On sale, claimed depreciation is recaptured at up to 25%, and gains may owe capital-gains tax (a 1031 exchange can defer both). Figures are a year-1 estimate at your 24.0% rate — not tax advice; consult a CPA.
Condition & rehab AI · 1 photo
This turn-key townhouse in Hampton Club is well-maintained with recent updates, offering modern comfort and low-maintenance living.
Value-add opportunities
- Both Landscaping improvements — Enhances curb appeal and adds value.
- Both Add smart home features — Improves convenience and adds modern appeal.
- Both Install smart thermostat — Saves energy and adds modern appeal.
Renovation cost estimate screening
Value-add ROI direction
- Both Landscaping improvements — Enhances curb appeal and adds value. ↑
- Both Add smart home features — Improves convenience and adds modern appeal. ↑
- Both Install smart thermostat — Saves energy and adds modern appeal. ↑
ⓘ Cost ranges are severity-bucket heuristics (US national rule-of-thumb). Get contractor quotes + a written scope before underwriting a rehab budget.
Schools (NCES district)
- District
- Hampton City Public School District
- NCES district ID
- 5101800
- Math proficiency
- 60% ▼ -21.00%
- Reading proficiency
- 70% ▼ -4.00%
- Median HH income
- $50,089
- Composite
- 55.19/100
- National rank
- #1272
- State rank
- #40 of 131 in VA
Livability — Hampton
- Score
- 75/100
- State rank
- #133
- US rank
- #4302
Category grades
Schools grade is shown separately in the Schools card above.
Census & demographics
- Census place
- Hampton, VA
- County
- Hampton City · 132,421 people
- City population
- 132,421
- Metro
- Virginia Beach-Norfolk-Newport News, VA-NC
- Population (ZIP)
- 54,233
- Household income
- $72,568
- Rent vs Own
- Severe rent burden
- 2951.0
Population outlook (Hampton County) Hauer SSP2
- Today (2025)
- 134,055 people
- By 2030
- 131,753 · -1.7%
- By 2040
- 125,017 · -6.7%
- By 2050
- 116,825 · -12.9%
- By 2075
- 97,033 · -27.6%
- By 2100
- 76,188 · -43.2%
Race, ethnicity, and origin ACS 2023
- Neighborhood character
- Diverse neighborhood (Simpson 0.65)
- Race & ethnicity
- Black 51% White 29% Two or more races 10% Hispanic / Latino 9% Asian 4%
- Hispanic origin (detail)
- Mexican 3% Puerto Rican 3%
- Common ancestry
- Italian 1% Lithuanian 1% Romanian 1%
- Foreign-born
- 7% · Canada, Vietnam
- Languages at home
- 90% English-only · Spanish 5% Vietnamese 1% Arabic 1%
Political lean MEDSL · Hampton
- 2024 margin
- Solid D (+39.9) · D 69.2% · R 29.4% · Other 1.4%
- 2008→2024 swing
- +1.0pp no change · 2008: 38.9pp · 2024: 39.9pp
- All cycles
- 2024: D+39.9 2020: D+42.2 2016: D+37.8 2012: D+45.4 2008: D+38.9
Not yet ingested
- Civics
- —
Market trends
- HPI YoY
- ▼ -49.01%
- Current HPI
- 262.821
- Rent YoY
- ▲ 4.05%
- Metro
- Virginia Beach-Norfolk-Newport News, VA-NC
- State GDP YoY
- ▲ 2.40%
- F500 in state
- 50
Industry mix (Fortune 500 HQ in VA)
| Industry | F500 HQs | Revenue |
|---|---|---|
| Aerospace / Defense | 4 | $236B |
|
||
| Technology / Defense | 3 | $32B |
|
||
| Financial Services | 2 | $176B |
|
||
| Utilities | 2 | $27B |
|
||
| Insurance | 2 | $25B |
|
||
| Technology | 2 | $15B |
|
||
Price history
1 event — show timeline
- 2026-05-23 Listed $125,000 REINMLS
Cash-flow waterfall
monthlySold comps — $/sqft
last 12 mo · ≤1 miLoading sold comps…