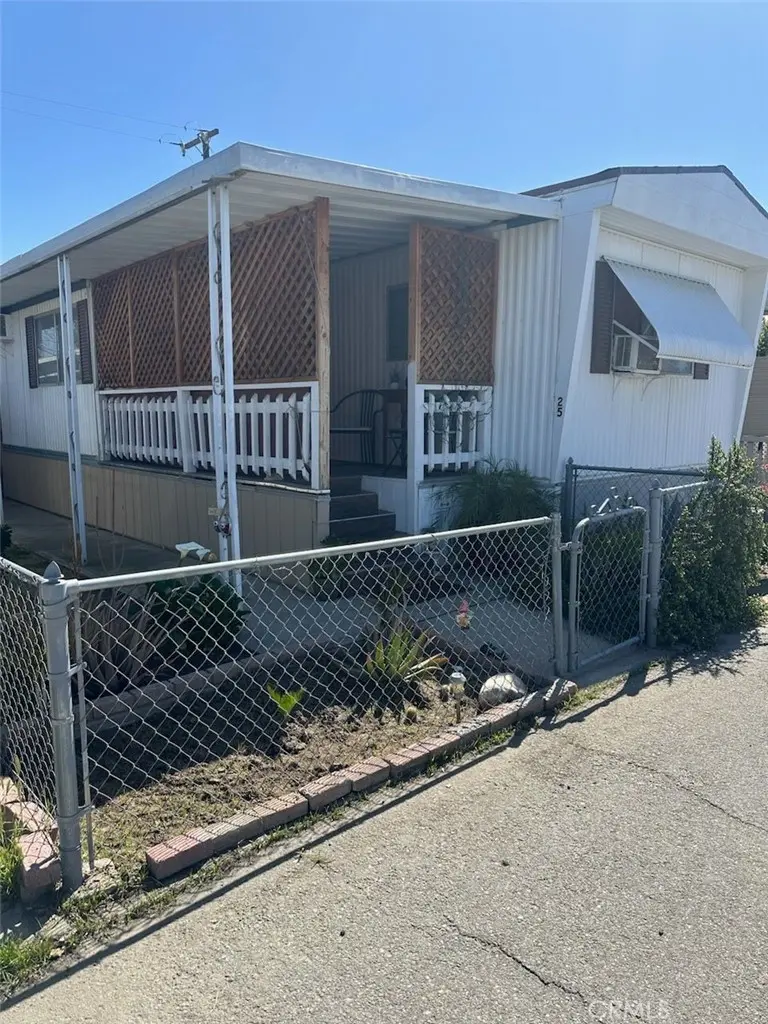
6201 Wible Rd #25 · Bakersfield, CA
Flood risk 1/10 · Minimal
- FEMA flood zone
- X (unshaded)
- Chance of flooding over 30 yrs
- 0.0%
- Est. flood insurance / yr
- $507 – $1,088
Fire risk 2/10 · Minimal
- Est. fire insurance / yr
- $659 – $1,223
Heat risk 8/10 · Major
- Hot days now (above 105°F)
- 7 days/yr
- Hot days in 30 yrs
- 17 days/yr
Wind risk 1/10 · Minimal
- Chance of severe wind over 30 yrs
- —
Air-quality risk 10/10 · Severe
- Unhealthy air days now
- 33 days/yr
- Unhealthy air days in 30 yrs
- 37 days/yr
Risk factors via First Street. Map © Google.
Why this score? — see what drove the C+ grade
The composite is a weighted blend of 9 inputs, each scored 0–100. Each bar is that input's sub-score; the figure is the points it added to the 100-point composite (weight × sub-score).
- Cash flow +30.0/30.0
- 1% rule +10.0/10.0
- DSCR +10.0/10.0
- Schools +4.2/10.0
- Rent growth +3.0/5.0
- Livability +2.9/5.0
- Condition / age +2.5/5.0
- ARV discount +0.0/15.0
- Appreciation +0.0/10.0
$59,000
🖨 Deal sheet (PDF) 📄 Offer letter ✓ Due diligence
Listing remarks
Adorable Manufactured home in Southwest Bakersfield. This affordable home offers 2 bedrooms and a nice open floor plan. The master bedroom has it's own 3/4 bathroom and there is another 3/4 bath in the hallway for guests. It's walking distance to shopping and restaurants, easy access to the main streets and freeways. It has a covered patio big enough for 2 cars. Enjoy the community pool and club house that are very well maintained by the management.
Key facts
- Open floor plan
- Community pool
- Covered patio
Tags
Property features AI
Finance
- HOA & community: Homeowners association; Association pool
Exterior
- Parking: Carport
- Utilities: Public water; Sewer
- Home design: Manufactured home zoning (MH); Pre-owned; Owner-occupied
- Construction: Concrete/perimeter foundation; Roof: Other (see remarks)
- Exterior features: Covered patio; Community pool; Located in Crest Park neighborhood; Leased space (manufactured home community)
Interior
- Kitchen: Range/Oven
- Bathrooms: Two 3/4 bathrooms
- Heating & cooling: Central A/C
- Interior features: Great Room; Range/Oven; Central A/C
Neighborhood map
What this means for you Summary
Snapshot
- This is a 2-bed/1.0-bath manufactured listed at $59k.
Deal economics
- At list price, monthly cash flow is $1k ($12k/yr) — positive.
- The deal already cash-flows at list — no discount required.
- Meets the 1% rule at list price ($2k rent vs $59k).
- Recommended offer: $57k (3.0% below list) — sets the bar for market timing.
- Cap rate 27.1% vs local median 3.6% in Bakersfield — top-decile yield for the area; either an underpriced asset or a hidden risk that comps aren't pricing in. Stress-test before assuming the spread holds.
Location & tenants
- Location reads 58/100 on livability (#716 in CA) — a working-class tenant base; expect higher turnover. Strengths: housing A+; Watch: health & safety D, crime F, amenities F.
- Panama-Buena Vista Union (urban): math 37% / reading 52% proficiency, ranked #542 of 1,400 in CA (top 39%) — families likely to look elsewhere, expect single-tenant / working-renter base with shorter leases.
- Zoned schools: Roy W. Loudon Elementary (694 students, 89% FRL); Fred L. Thompson Junior High (728 students, 93% FRL); Ridgeview High (reading 95%, 2,688 students, 74% FRL) — zoned schools average 85% FRL vs 51% district-wide (35 pts higher); higher-poverty schools than district average — tighter screening recommended.
- Market conditions: Rents rising (+2.1%/yr); 273 active listings in the ZIP; 5 comparable units currently listed for rent nearby; rentals leasing fast (median 13d on market — plan ~1-2 weeks tenant-placement turnaround); solid renter incomes; 3,244 units permitted in Kern County in 2024 (73 in 5+ unit buildings).
Forward outlook
- Local home prices are declining (-3.0%/yr); year-one equity from $408 of loan paydown is wiped out by about $2k of value loss. Plan a longer hold.
- Kern County population projected at +17% by 2050 — long-run rental-demand tailwind backs the buy-and-hold thesis.
- At projected returns (-3.0% appreciation + 2.1% rent growth), your $17k cash investment doubles in ~2 years — after that, you're playing with house money.
Negotiation context
- It's been on market 31 days — a 3% lower offer ($57k) is reasonable based on typical stale-listing flexibility.
- 5 sale attempts since 2y ago with the ask held roughly flat each time — persistent listings suggest the price (not the market) is what's stuck; bring a comps-based counter.
- Current owner paid $49k; 20% above their basis — modest negotiation headroom, anchor on the comps not their cost.
Risks & watch-outs
- Climate carrying-cost: extreme-heat days projected 7→17/yr by 2055 (HVAC capex compounding) — expect insurance premiums to compound above CPI over the hold.
Questions for the listing agent
- It's been on market 31 days. Have you received any prior offers? Is the seller open to a 3% concession, seller financing, or rate buy-down credit?
- Built in 1967 — when were the roof, HVAC, electrical panel, plumbing, and water heater last replaced?
- Is there a deadline driving the sale (1031 exchange, divorce, estate, relocation)? That informs how much negotiation room exists.
- Schools are D-rated, which usually means shorter tenancies and higher turnover. Who's the typical renter profile here, and what's been the actual vacancy rate?
- Crime grade is F in this area — have there been break-ins, vandalism, or insurance claims at this property in the last 3 years? What carrier currently insures it and at what premium?
- What's the average days-on-market for RENTAL listings here right now (not sales)? A rising rental-DOM trend means longer vacancies and softer asking-rent achievability than the comps imply.
- What's the recent tenant-quality profile in this submarket — average credit score on applications, eviction rate, late-payment / NSF rate, and stable-employment percentage? A property-management company in the area should have these aggregated.
- How much new for-sale + rental construction is in the pipeline within 1–3 miles? Heavy new supply typically softens prices + rents 12–24 months out; constrained supply supports both.
Investment metrics
- 1% rule
- 3.07% ✓
- Cap rate
- 27.14%
- Cash-on-cash
- 74.45%
- DSCR
- 4.31
- GRM
- 2.7
CMA / ARV
- ARV (median comp)
- $46,843
- List price
- $59,000
- Delta
- 27.87%
- Verdict
- OVERPRICED
- Comps
- 2 within 1.0 mi
Show comp detail 1 sale within ~0.75 mi
| Address | Dist | Beds/Ba | Sqft | Sold | Price | $/sf | Match |
|---|---|---|---|---|---|---|---|
| 6201 Wible Rd #25 | 0.00mi | 2/1.0 | 816 (0%) | 23mo | $49,000 | $60 | 81 |
Match score weights: distance 35% · size 25% · config 20% · recency 20%. Top-matched comps best support the ARV.
Projected returns pro-forma
-3.0% appreciation · 2.12% rent growth · sell at horizon
- IRR
- 73.3%
- Equity multiple
- 4.28×
- Total profit
- $54,149
- Equity at exit
- $8,797
- IRR
- 76.9%
- Equity multiple
- 8.56×
- Total profit
- $124,898
- Equity at exit
- $5,101
Cash invested: $16,520 (down + closing). Projections, not guarantees.
Landlord ↔ Tenant lean methodology
- Overall (STATE)
- 18 Strongly Tenant-Friendly
- State California
- 18 Strongly Tenant-Friendly · D+13
- County
- — inherits STATE
- City
- — inherits STATE
ZIP-level market 93313
- Home prices YoY
- -20.4%
- Rents YoY
- 2.1%
- Active inventory
- 273
- Price-to-rent
- 2.7×
Monthly cashflow live
- Estimated rent
- $1,813 high interval (Pro) →
- Mortgage (P&I)
- −$309
- Tax est. 1.5%
- −$74 /mo · $885/yr
- Insurance
- −$25
- HOA
- −$0
- Vacancy / Maint / Mgmt
- −$381
- Net cashflow
- $1,025
Break-even live
Sensitivity live
| Price | -10% $1,066 | -5% $1,045 | +0% $1,025 | +5% $1,004 | +10% $984 |
|---|---|---|---|---|---|
| Rent | -10% $882 | -5% $953 | +0% $1,025 | +5% $1,096 | +10% $1,168 |
| Rate | -1.0pp $1,055 | -0.5pp $1,040 | base $1,025 | +0.5pp $1,010 | +1.0pp $994 |
UW: 25.0% down · 7.5% · 30yr · 1.5% tax · 5.0% vac · 8.0% maint · 8.0% mgmt
Financing live
Cash to close
- Down payment
- $14,750
- Closing costs
- $1,770
- Reserves months
- —
- Total cash needed
- —
Loan-product check · same deal, 3 products live
Conventional
25% down · 7.5% · 30yr
- Down + closing
- —
- Monthly P&I
- —
- Monthly cashflow
- —
- DSCR
- —
- Eligible?
- —
Personal DTI + credit; lowest rate.
DSCR
20% down · 8.5% · 30yr
- Down + closing
- —
- Monthly P&I
- —
- Monthly cashflow
- —
- DSCR
- —
- Eligible?
- —
No personal income docs; deal must DSCR.
Hard money
10% down · 12.0% · 12mo
- Down + closing
- —
- Monthly P&I
- —
- Monthly cashflow
- —
- DSCR
- —
- Eligible?
- —
Short-term bridge; refi at stabilization.
Rent comps 5 comps
| Address | Beds | Baths | Sqft | Rent | $/sqft | DOM | Units | Dist |
|---|---|---|---|---|---|---|---|---|
| 6401 Castleford St Unit C Bakersfield, CA | 3.0 | 2.0 | 1125 | $1,500 | $1.33 | 21d | 1 | 0.18mi |
| 4508 Blossom Valley Ln Bakersfield, CA | 3.0 | 2.0 | 1107 | $1,850 | $1.67 | 23d | 1 | 0.73mi |
| 6208 Stine Rd Apt B Bakersfield, CA | 2.0 | 1.0 | 904 | $1,495 | $1.65 | 12d | 1 | 0.92mi |
| 5213 S H St Unit A Bakersfield, CA | 2.0 | 1.0 | 850 | $1,495 | $1.76 | 5d | 1 | 1.18mi |
| 6600 Jerno Dr Bakersfield, CA | 2.0–3.0 | 2.0 | 1104 | $2,035 | $1.84 | 4d | 1 | 1.24mi |
Listing history 28 events
-
2026-06-22days on market $59,000 Active 31 DOM
-
2026-06-18days on market $59,000 Active 28 DOM
-
2026-06-17days on market $59,000 Active 27 DOM
-
2026-06-16days on market $59,000 Active 26 DOM
-
2026-06-15days on market $59,000 Active 25 DOM
-
2026-06-14days on market $59,000 Active 23 DOM
-
2026-06-13days on market $59,000 Active 22 DOM
-
2026-06-10days on market $59,000 Active 20 DOM
-
2026-06-09days on market $59,000 Active 19 DOM
-
2026-06-08days on market $59,000 Active 18 DOM
-
2026-06-07days on market $59,000 Active 17 DOM
-
2026-06-05days on market $59,000 Active 14 DOM
-
2026-06-03days on market $59,000 Active 13 DOM
-
2026-06-03days on market $59,000 Active 12 DOM
-
2026-06-01days on market $59,000 Active 11 DOM
-
2026-05-31days on market $59,000 Active 10 DOM
-
2026-02-04price $59,900
-
2025-11-10$63,900 Active
-
2025-06-18price $64,900
-
2025-05-20price $69,900
-
2025-05-05price $74,900
-
2025-04-17$79,000 Active
-
2024-07-18soldstatus $49,000 Closed Sale
-
2024-07-12soldstatus $49,000 Sold
-
2024-06-17status Pending
-
2024-06-06price $50,000
-
2024-03-18$54,000 Active
-
2024-03-15$54,000 Active
ⓘ Source: listings_history table (triggers on properties + properties_extension) + one-shot
backfill from property_details.listing_events for pre-trigger history.
Climate risk First Street
- Flood 1/10 Low FEMA zone X (unshaded) · 0% chance over 30 yrs
- Wildfire 2/10 Low
- Heat 8/10 Severe 7 d/yr ≥105°F today · 17 d/yr by 30 yrs out
- Wind 1/10 Low
- Air quality 10/10 Extreme 33 unhealthy d/yr today · 37 by 30 yrs out
Nearby sold comps map
Loading sold comps map…
Walkable amenities ~0.75 mi
Loading nearby amenities…
Taxation est. · year 1
- Rental income
- $21,761
- − Mortgage interest
- −$3,305
- − Property taxes
- −$885
- − Insurance
- −$295
- − Repairs & maintenance
- −$1,741
- − Management
- −$1,741
- − Depreciation
- −$1,716
- Taxable income
- $12,078
- Est. tax owed @ 24.0%
- −$2,899
- After-tax cash flow
- $9,400/yr
For passive investors: Depreciation is non-cash, so a rental often shows a tax loss while cash-flowing — sheltering income. Rental losses are passive: they offset passive income freely, and up to $25,000/yr can offset ordinary (W-2) income if you actively participate and your MAGI is under $100k (phasing out to $0 by $150k); unused losses carry forward. On sale, claimed depreciation is recaptured at up to 25%, and gains may owe capital-gains tax (a 1031 exchange can defer both). Figures are a year-1 estimate at your 24.0% rate — not tax advice; consult a CPA.
Schools (NCES district)
- District
- Panama-Buena Vista Union
- NCES district ID
- 0606390
- Math proficiency
- 37% ▲ 3.00%
- Reading proficiency
- 52% ▲ 1.00%
- Median HH income
- $63,361
- Composite
- 41.71/100
- National rank
- #7191
- State rank
- #542 of 1400 in CA
Livability — Bakersfield
- Score
- 58/100
- State rank
- #716
- US rank
- #21355
Category grades
Schools grade is shown separately in the Schools card above.
Census & demographics
- Census place
- Bakersfield, CA
- County
- Kern County · 710,371 people
- City population
- 499,124
- Metro
- Bakersfield, CA
- Population (ZIP)
- 61,843
- Household income
- $91,943
- Rent vs Own
- Severe rent burden
- 1177.0
Population outlook (Kern County) Hauer SSP2
- Today (2025)
- 947,286 people
- By 2030
- 978,984 · +3.3%
- By 2040
- 1,045,018 · +10.3%
- By 2050
- 1,105,232 · +16.7%
- By 2075
- 1,229,538 · +29.8%
- By 2100
- 1,238,059 · +30.7%
Race, ethnicity, and origin ACS 2023
- Neighborhood character
- Diverse neighborhood (Simpson 0.61)
- Race & ethnicity
- Hispanic / Latino 57% Two or more races 28% White 22% Asian 13% Black 6%
- Hispanic origin (detail)
- Mexican 52%
- Common ancestry
- British 1% Romanian 1%
- Foreign-born
- 25% · Canada, Vietnam, China
- Languages at home
- 45% English-only · Spanish 40% Other Indo-European 8% Other Asian/Pacific 2%
Political lean MEDSL · Kern
- 2024 margin
- Strong R (+21.1) · D 38.2% · R 59.3% · Other 2.5%
- 2008→2024 swing
- -3.3pp toward R · 2008: -17.8pp · 2024: -21.1pp
- All cycles
- 2024: R+21.1 2020: R+10.2 2016: R+15.0 2012: R+20.9 2008: R+17.8
Not yet ingested
- Civics
- —
Market trends
- HPI YoY
- ▼ -85.95%
- Current HPI
- 335.9445
- Rent YoY
- ▲ 2.12%
- Metro
- Bakersfield, CA
- State GDP YoY
- ▲ 3.21%
- F500 in state
- 116
Industry mix (Fortune 500 HQ in CA)
| Industry | F500 HQs | Revenue |
|---|---|---|
| Technology | 27 | $1,492B |
|
||
| Financial Services | 3 | $174B |
|
||
| Retail | 3 | $44B |
|
||
| Insurance | 3 | $26B |
|
||
| Media / Entertainment | 2 | $115B |
|
||
| Pharmaceuticals / Biotech | 2 | $62B |
|
||
Price history
+9.3% since first listed13 events — show timeline
- 2026-05-21 Listed $59,000 GEMLS
- 2026-02-04 Price Changed $59,900 GEMLS
- 2025-11-10 Listed $63,900 GEMLS
- 2025-06-18 Price Changed $64,900 GEMLS
- 2025-05-20 Price Changed $69,900 GEMLS
- 2025-05-05 Price Changed $74,900 GEMLS
- 2025-04-17 Listed $79,000 GEMLS
- 2024-07-18 Sold (MLS) $49,000 CRMLS
- 2024-07-12 Sold (MLS) $49,000 GEMLS
- 2024-06-17 Pending — GEMLS
- 2024-06-06 Price Changed $50,000 GEMLS
- 2024-03-18 Listed $54,000 CRMLS
- 2024-03-15 Listed $54,000 GEMLS
Property tax history
-9.7%/yrLatest (2025): $8 · -90.6% YoY. Source: county tax records.
Cash-flow waterfall
monthlySold comps — $/sqft
last 12 mo · ≤1 miLoading sold comps…