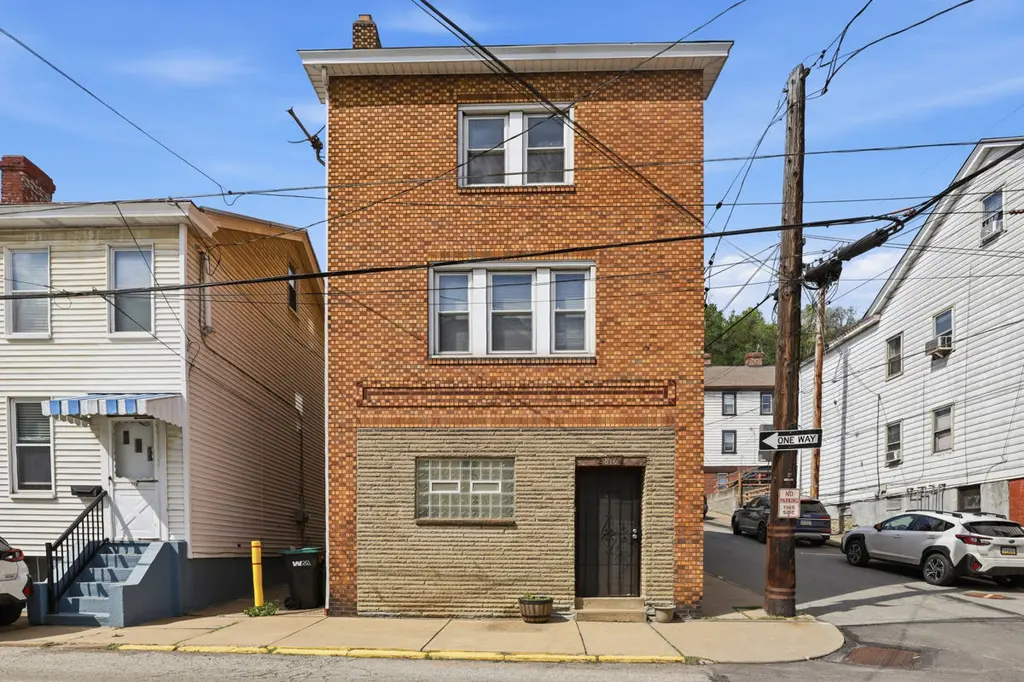
816 Penn St · Sharpsburg, PA
Flood risk 10/10 · Severe
- FEMA flood zone
- X (shaded)
- Chance of flooding over 30 yrs
- 0.99%
- Est. flood insurance / yr
- $473 – $860
Fire risk 1/10 · Minimal
- Est. fire insurance / yr
- $511 – $949
Heat risk 5/10 · Moderate
- Hot days now (above 98°F)
- 8 days/yr
- Hot days in 30 yrs
- 19 days/yr
Wind risk 2/10 · Minimal
- Chance of severe wind over 30 yrs
- —
Air-quality risk 4/10 · Minor
- Unhealthy air days now
- 5 days/yr
- Unhealthy air days in 30 yrs
- 7 days/yr
Risk factors via First Street. Map © Google.
Why this score? — see what drove the B- grade
The composite is a weighted blend of 9 inputs, each scored 0–100. Each bar is that input's sub-score; the figure is the points it added to the 100-point composite (weight × sub-score).
- Cash flow +29.5/30.0
- DSCR +10.0/10.0
- 1% rule +7.5/10.0
- Schools +6.9/10.0
- ARV discount +5.2/15.0
- Livability +4.0/5.0
- Rent growth +3.8/5.0
- Condition / age +2.5/5.0
- Appreciation +0.0/10.0
$209,900
🖨 Deal sheet (PDF) 📄 Offer letter ✓ Due diligence
Listing remarks MLS
GREAT FAMILY HOME!!!! LARGE HOME COULD BE 2 UNIT UPDATED KITCHEN 2 NEW BATHS NEUTRAL DEC, 2 COVERED DECKS
Key facts
- Textured walls
- Finished attic
- Soaring ceilings
Tags
Property features AI
Exterior
- Parking: On-street parking
- Utilities: Public water; Public sewer
- Home design: 3 stories; Resale property
- Construction: Brick construction; Asphalt roof
- Exterior features: Public transportation nearby; Lot dimensions 21x25x49.55x21.33
Interior
- Kitchen: Dishwasher; Stove; Refrigerator; Some gas appliances
- Bedrooms: Upper-level bedroom (13x10); Upper-level bedroom (10x7)
- Flooring: Hardwood; Laminate
- Bathrooms: 2 full bathrooms
- Heating & cooling: Gas heating; Hot water heating; Wall/window cooling units
- Interior features: Kitchen island; Pantry; Window treatments; Multi-pane windows; Window screens; Decorative fireplace
- Laundry & utility: Washer; Dryer
Neighborhood map
What this means for you Summary
Snapshot
- This is a 3-bed/2.0-bath single-family listed at $210k.
Deal economics
- At list price, monthly cash flow is $692 ($8k/yr) — positive.
- The deal already cash-flows at list — no discount required.
- Meets the 1% rule at list price ($3k rent vs $210k).
- Recommended offer: $204k (3.0% below list) — sets the bar for market timing.
Location & tenants
- Location reads 79/100 on livability (#248 in PA, #2,145 nationally) — a middle-class / working-renter tenant base. Strengths: commute A+, cost of living A+, housing A+; Watch: amenities D, schools D-, employment D-.
- Fox Chapel Area SD (suburban): math 73% / reading 85% proficiency, ranked #7 of 539 in PA (top 1%) — strong family-tenant draw, lease renewals of 3-5y typical; only 16% free/reduced lunch — higher-income household profile.
- Market conditions: Rents rising fast (+5.2%/yr); 56 active listings in the ZIP; 8 comparable units currently listed for rent nearby; rentals at typical pace (median 19d on market — plan ~3-4 weeks tenant-placement turnaround); solid renter incomes; 2,996 units permitted in Allegheny County in 2024 (1,588 in 5+ unit buildings).
- This rent runs 32% of the median local income ($99k/yr) — at the standard rent-burdened threshold; future hikes will face affordability resistance.
Forward outlook
- Local home prices are declining (-3.0%/yr); year-one equity from $1k of loan paydown is wiped out by about $6k of value loss. Plan a longer hold.
- At projected returns (-3.0% appreciation + 5.2% rent growth), your $59k cash investment doubles in ~8 years — after that, you're playing with house money.
Negotiation context
- It's been on market 52 days — a 3% lower offer ($204k) is reasonable based on typical stale-listing flexibility.
- 2 sale attempts since 27y ago with the ask held roughly flat each time — persistent listings suggest the price (not the market) is what's stuck; bring a comps-based counter.
- Current owner paid $65k; list at $210k implies a 223% gain — meaningful room to come down on a strong offer.
Risks & watch-outs
- Watch-outs: flood insurance adds $56/mo; built in 1910 — expect roof / HVAC / electrical / plumbing capex.
- Climate carrying-cost: severe flood risk; extreme-heat days projected 8→19/yr by 2055 (HVAC capex compounding) — expect insurance premiums to compound above CPI over the hold.
Questions for the listing agent
- It's been on market 52 days. Have you received any prior offers? Is the seller open to a 3% concession, seller financing, or rate buy-down credit?
- Built in 1910 — when were the roof, HVAC, electrical panel, plumbing, and water heater last replaced?
- What's the actual annual flood-insurance premium (NFIP or private), and is the property in a SFHA with mandatory coverage?
- Is there a deadline driving the sale (1031 exchange, divorce, estate, relocation)? That informs how much negotiation room exists.
- Schools are D-rated, which usually means shorter tenancies and higher turnover. Who's the typical renter profile here, and what's been the actual vacancy rate?
- What's the average days-on-market for RENTAL listings here right now (not sales)? A rising rental-DOM trend means longer vacancies and softer asking-rent achievability than the comps imply.
- What's the recent tenant-quality profile in this submarket — average credit score on applications, eviction rate, late-payment / NSF rate, and stable-employment percentage? A property-management company in the area should have these aggregated.
- How much new for-sale + rental construction is in the pipeline within 1–3 miles? Heavy new supply typically softens prices + rents 12–24 months out; constrained supply supports both.
Investment metrics
- 1% rule
- 1.25% ✓
- Cap rate
- 10.57%
- Cash-on-cash
- 15.27%
- DSCR
- 1.68
- GRM
- 6.7
CMA / ARV
- ARV (median comp)
- $199,530
- List price
- $209,900
- Delta
- 5.20%
- Verdict
- FAIR
- Comps
- 20 within 1.0 mi
Show comp detail 12 sales within ~0.75 mi
| Address | Dist | Beds/Ba | Sqft | Sold | Price | $/sf | Match |
|---|---|---|---|---|---|---|---|
| 1218 Penn St | 0.22mi | 3/1.5 | 2,082 (+4%) | 8mo | $128,000 | $61 | 74 |
| 713 Edgewood Ave | 0.32mi | 3/2.5 | 2,020 (+1%) | 10mo | $710,000 | $351 | 73 |
| 66 Cherry St | 0.53mi | 3/2.0 | 1,952 (-2%) | 2mo | $325,000 | $166 | 70 |
| 16 4th St | 0.22mi | 3/1.5 | 1,824 (-9%) | 6mo | $215,000 | $118 | 68 |
| 221 13th St | 0.22mi | 4/2.0 (+1) | 2,100 (+5%) | 12mo | $170,000 | $81 | 67 |
| 29 Kittanning Pike | 0.48mi | 3/1.5 | 1,934 (-3%) | 8mo | $205,000 | $106 | 64 |
| 229 Clifton Ave | 0.27mi | 3/1.5 | 1,725 (-14%) | 3mo | $209,000 | $121 | 60 |
| 1636 Trinity St | 0.67mi | 3/2.5 | 1,873 (-6%) | 1mo | $501,636 | $268 | 55 |
| 803 Sharps Hill Rd | 0.37mi | 4/2.5 (+1) | 2,152 (+8%) | 16mo | $194,000 | $90 | 50 |
| 9 Morelock St | 0.73mi | 4/2.5 (+1) | 1,956 (-2%) | 14mo | $360,000 | $184 | 44 |
| 78 High St | 0.75mi | 3/3.0 | 2,176 (+9%) | 4mo | $33,333 | $15 | 43 |
| 230 Clifton Ave | 0.29mi | 4/1.5 (+1) | 1,706 (-15%) | 15mo | $245,000 | $144 | 43 |
Match score weights: distance 35% · size 25% · config 20% · recency 20%. Top-matched comps best support the ARV.
Projected returns pro-forma
-3.0% appreciation · 5.24% rent growth · sell at horizon
- IRR
- 6.9%
- Equity multiple
- 1.27×
- Total profit
- $16,113
- Equity at exit
- $31,297
- IRR
- 18.0%
- Equity multiple
- 2.65×
- Total profit
- $96,697
- Equity at exit
- $18,148
Cash invested: $58,772 (down + closing). Projections, not guarantees.
Landlord ↔ Tenant lean methodology
- Overall (STATE)
- 62 Landlord-Friendly
- State Pennsylvania
- 62 Landlord-Friendly · EVEN
- County
- — inherits STATE
- City
- — inherits STATE
ZIP-level market 15215
- Rents YoY
- 5.2%
- Active inventory
- 56
- Price-to-rent
- 6.7×
Monthly cashflow live
- Estimated rent
- $2,617 high interval (Pro) →
- Mortgage (P&I)
- −$1,101
- Tax from tax record
- −$131 /mo · $1,573/yr
- Insurance
- −$87
- Flood insurance flood zone
- −$56 /mo · $666/yr
- HOA
- −$0
- Vacancy / Maint / Mgmt
- −$550
- Net cashflow
- $692
Break-even live
Sensitivity live
| Price | -10% $811 | -5% $752 | +0% $692 | +5% $633 | +10% $574 |
|---|---|---|---|---|---|
| Rent | -10% $486 | -5% $589 | +0% $692 | +5% $796 | +10% $899 |
| Rate | -1.0pp $798 | -0.5pp $746 | base $692 | +0.5pp $638 | +1.0pp $583 |
UW: 25.0% down · 7.5% · 30yr · 1.5% tax · 5.0% vac · 8.0% maint · 8.0% mgmt
Financing live
Cash to close
- Down payment
- $52,475
- Closing costs
- $6,297
- Reserves months
- —
- Total cash needed
- —
Loan-product check · same deal, 3 products live
Conventional
25% down · 7.5% · 30yr
- Down + closing
- —
- Monthly P&I
- —
- Monthly cashflow
- —
- DSCR
- —
- Eligible?
- —
Personal DTI + credit; lowest rate.
DSCR
20% down · 8.5% · 30yr
- Down + closing
- —
- Monthly P&I
- —
- Monthly cashflow
- —
- DSCR
- —
- Eligible?
- —
No personal income docs; deal must DSCR.
Hard money
10% down · 12.0% · 12mo
- Down + closing
- —
- Monthly P&I
- —
- Monthly cashflow
- —
- DSCR
- —
- Eligible?
- —
Short-term bridge; refi at stabilization.
Rent comps 8 comps
| Address | Beds | Baths | Sqft | Rent | $/sqft | DOM | Units | Dist |
|---|---|---|---|---|---|---|---|---|
| 212 8th St Sharpsburg, PA | 4.0 | 2.0 | 2240 | $2,100 | $0.94 | 18d | 1 | 0.04mi |
| 6026 Sawyer St Unit NA Pittsburgh, PA | 3.0 | 2.0 | 2231 | $2,500 | $1.12 | 20d | 1 | 0.79mi |
| 160 56th St Pittsburgh, PA | 3.0 | 3.0 | 1737 | $3,900 | $2.25 | 20d | 1 | 1.10mi |
| 5264 Dresden Way Pittsburgh, PA | 2.0 | 2.0 | 1853 | $2,500 | $1.35 | 25d | 1 | 1.38mi |
| 5700 Bunkerhill St Pittsburgh, PA | 1.0–3.0 | 1.0–2.0 | 1258 | $3,236 | $2.57 | 3d | 17 | 1.39mi |
| 404 Reetz St Pittsburgh, PA | 4.0 | 1.0 | 1500 | $2,050 | $1.37 | 17d | 1 | 1.39mi |
| 5275 Butler St Pittsburgh, PA | 2.0 | 1.0–2.0 | 885 | $4,076 | $4.61 | 3d | 130 | 1.40mi |
| 1115 N Negley Ave Pittsburgh, PA | 1.0–2.0 | 1.0–2.0 | 968 | $2,390 | $2.47 | 3d | 2 | 1.47mi |
Listing history 18 events
-
2026-06-21days on market $209,900 Active 52 DOM
-
2026-06-18days on market $209,900 Active 49 DOM
-
2026-06-17days on market $209,900 Active 48 DOM
-
2026-06-16days on market $209,900 Active 47 DOM
-
2026-06-15days on market $209,900 Active 46 DOM
-
2026-06-13days on market $209,900 Active 44 DOM
-
2026-06-09days on market $209,900 Active 40 DOM
-
2026-06-08days on market $209,900 Active 39 DOM
-
2026-06-07pricedays on market $209,900 Active 38 DOM
-
2026-06-03days on market $214,900 Active 34 DOM
-
2026-06-02days on market $214,900 Active 33 DOM
-
2026-06-01days on market $214,900 Active 32 DOM
-
2026-05-31days on market $214,900 Active 31 DOM
-
2026-04-29$214,900 Active 1750-char remark
-
2000-01-18soldstatus $64,900
-
2000-01-17soldstatus $64,900 105-char remark
Show marketing remark (105 chars)
GREAT FAMILY HOME!!!! LARGE HOME COULD BE 2 UNIT UPDATED KITCHEN 2 NEW BATHS NEUTRAL DEC, 2 COVERED DECKS
-
1999-10-06$64,900 105-char remark
Show marketing remark (105 chars)
GREAT FAMILY HOME!!!! LARGE HOME COULD BE 2 UNIT UPDATED KITCHEN 2 NEW BATHS NEUTRAL DEC, 2 COVERED DECKS
-
1994-01-20soldstatus $47,650
ⓘ Source: listings_history table (triggers on properties + properties_extension) + one-shot
backfill from property_details.listing_events for pre-trigger history.
Tax reassessment forecast PA · Partial reset (capped growth)
- Current annual tax
- $1,573 · $131/mo
- Projected year-2 tax
- $2,445 · $204/mo
- Expected delta
- +$872/yr (+$73/mo · 55.4%)
ⓘ Screening estimate from a state-policy table — verify with the county assessor before closing.
Climate risk First Street
- Flood 10/10 Extreme FEMA zone X (shaded) · 99% chance over 30 yrs
- Wildfire 1/10 Low
- Heat 5/10 Major 8 d/yr ≥98°F today · 19 d/yr by 30 yrs out
- Wind 2/10 Low
- Air quality 4/10 Moderate 5 unhealthy d/yr today · 7 by 30 yrs out
Nearby sold comps map
Loading sold comps map…
Walkable amenities ~0.75 mi
Loading nearby amenities…
Taxation est. · year 1
- Rental income
- $31,402
- − Mortgage interest
- −$11,758
- − Property taxes
- −$1,573
- − Insurance
- −$1,716
- − Repairs & maintenance
- −$2,512
- − Management
- −$2,512
- − Depreciation
- −$6,106
- Taxable income
- $5,225
- Est. tax owed @ 24.0%
- −$1,254
- After-tax cash flow
- $7,056/yr
For passive investors: Depreciation is non-cash, so a rental often shows a tax loss while cash-flowing — sheltering income. Rental losses are passive: they offset passive income freely, and up to $25,000/yr can offset ordinary (W-2) income if you actively participate and your MAGI is under $100k (phasing out to $0 by $150k); unused losses carry forward. On sale, claimed depreciation is recaptured at up to 25%, and gains may owe capital-gains tax (a 1031 exchange can defer both). Figures are a year-1 estimate at your 24.0% rate — not tax advice; consult a CPA.
Schools (NCES district)
- District
- Fox Chapel Area SD
- NCES district ID
- 4210070
- Math proficiency
- 73% ▼ -5.00%
- Reading proficiency
- 85% ▼ -2.00%
- Median HH income
- $73,326
- Composite
- 69.02/100
- National rank
- #324
- State rank
- #7 of 539 in PA
Livability — Sharpsburg
- Score
- 79/100
- State rank
- #248
- US rank
- #2145
Category grades
Schools grade is shown separately in the Schools card above.
Census & demographics
- Census place
- Sharpsburg, PA
- County
- Allegheny County · 1,022,028 people
- Metro
- Pittsburgh, PA
- Population (ZIP)
- 11,907
- Household income
- $99,071
- Rent vs Own
- Severe rent burden
- 311.0
Population outlook (Allegheny County) Hauer SSP2
- Today (2025)
- 1,250,282 people
- By 2030
- 1,256,482 · +0.5%
- By 2040
- 1,256,318 · +0.5%
- By 2050
- 1,244,169 · -0.5%
- By 2075
- 1,197,693 · -4.2%
- By 2100
- 1,093,187 · -12.6%
Race, ethnicity, and origin ACS 2023
- Neighborhood character
- Predominantly White (86%)
- Race & ethnicity
- White 86% Asian 5% Two or more races 4% Black 4% Hispanic / Latino 3%
- Common ancestry
- Romanian 9% Lithuanian 3% Scotch-Irish 2%
- Foreign-born
- 7% · China, South Korea, Canada
- Languages at home
- 91% English-only · Spanish 2% Chinese 2% Other Indo-European 2%
Political lean MEDSL · Allegheny
- 2024 margin
- Strong D (+20.3) · D 59.7% · R 39.4%
- 2008→2024 swing
- +4.8pp toward D · 2008: 15.5pp · 2024: 20.3pp
- All cycles
- 2024: D+20.3 2020: D+20.4 2016: D+16.4 2012: D+14.4 2008: D+15.5
Not yet ingested
- Civics
- —
Market trends
- HPI YoY
- ▼ -171.68%
- Current HPI
- 284.7359
- Rent YoY
- ▲ 5.24%
- Metro
- Pittsburgh, PA
- State GDP YoY
- ▲ 1.68%
- F500 in state
- 34
Industry mix (Fortune 500 HQ in PA)
| Industry | F500 HQs | Revenue |
|---|---|---|
| Healthcare | 2 | $309B |
|
||
| Insurance | 2 | $27B |
|
||
| Telecommunications / Media | 1 | $124B |
|
||
| Industrial Distribution | 1 | $22B |
|
||
| Financial Services | 1 | $20B |
|
||
| Chemicals / Materials | 1 | $18B |
|
||
Price history
+340.5% since first listed6 events — show timeline
- 2026-06-04 Price Changed $209,900 West Penn MLS
- 2026-04-29 Listed $214,900 West Penn MLS
- 2000-01-18 Sold (Public Records) $64,900 Public Records
- 2000-01-17 Sold (MLS) $64,900 West Penn MLS
- 1999-10-06 Listed $64,900 West Penn MLS
- 1994-01-20 Sold (Public Records) $47,650 Public Records
Property tax history
+1.2%/yrLatest (2026): $1,573 · +1.3% YoY. Source: county tax records.
Cash-flow waterfall
monthlySold comps — $/sqft
last 12 mo · ≤1 miLoading sold comps…