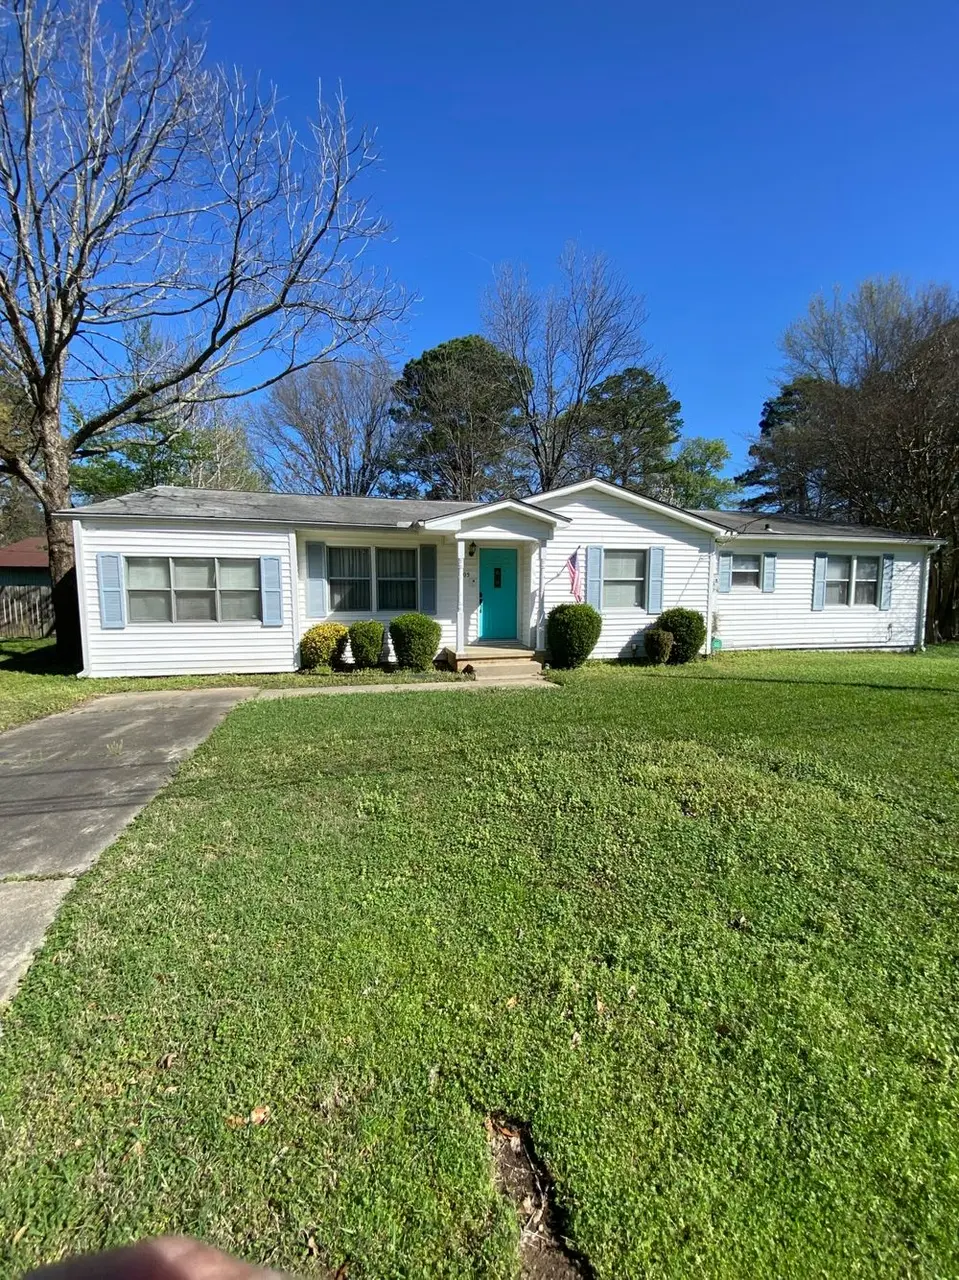
905 E 33rd St · Texarkana, AR
Flood risk 1/10 · Minimal
- FEMA flood zone
- X (unshaded)
- Chance of flooding over 30 yrs
- 0.0%
- Est. flood insurance / yr
- $507 – $1,088
Fire risk 1/10 · Minimal
- Est. fire insurance / yr
- $1,499 – $2,785
Heat risk 7/10 · Major
- Hot days now (above 110°F)
- 7 days/yr
- Hot days in 30 yrs
- 22 days/yr
Wind risk 4/10 · Minor
- Chance of severe wind over 30 yrs
- 23.0%
Air-quality risk 2/10 · Minimal
- Unhealthy air days now
- 1 days/yr
- Unhealthy air days in 30 yrs
- 1 days/yr
Risk factors via First Street. Map © Google.
Why this score? — see what drove the D grade
The composite is a weighted blend of 9 inputs, each scored 0–100. Each bar is that input's sub-score; the figure is the points it added to the 100-point composite (weight × sub-score).
- Cash flow +15.6/30.0
- ARV discount +8.5/15.0
- DSCR +4.8/10.0
- 1% rule +3.2/10.0
- Livability +3.2/5.0
- Rent growth +2.5/5.0
- Condition / age +2.5/5.0
- Schools +2.1/10.0
- Appreciation +0.0/10.0
$185,000
🖨 Deal sheet (PDF) 📄 Offer letter ✓ Due diligence
Listing remarks
This three bedroom, two bath house sits on two city lots and has a 20 x 30 detached garage that is perfect for a man cave or workshop. Large front and back yard with a stone patio perfect for the family bbq or hangout. The house includes a washer and dryer and a side by side fridge/freezer. Stop by and take a look!
Key facts
- Large front yard
- Large back yard
- Stone patio
Tags
Property features AI
Exterior
- Home design: House
- Exterior features: Approximately 20,996 sq ft lot
Neighborhood map
What this means for you Summary
Snapshot
- This is a 3-bed/2.0-bath single-family listed at $185k.
Deal economics
- At list price, monthly cash flow is $79 ($947/yr) — positive.
- The deal already cash-flows at list — no discount required.
- To meet the 1% rule (rent ≥ 1% of price), the offer needs to be $152k (17.7% below list).
- Recommended offer: $152k (17.7% below list) — sets the bar for 1% rule.
- Cap rate 6.8% vs local median 4.5% in Texarkana — top-decile yield for the area; either an underpriced asset or a hidden risk that comps aren't pricing in. Stress-test before assuming the spread holds.
Location & tenants
- Location reads 64/100 on livability (#177 in AR) — a middle-class / working-renter tenant base. Strengths: cost of living A+, housing A+, health & safety A-; Watch: crime F, amenities F, commute F.
- Texarkana School District (suburban): math 27% / reading 24% proficiency, ranked #181 of 238 in AR (top 76%) — low school quality limits family demand, transient renter base, plan for 1-2y turnover; 64% free/reduced lunch — lower-income household profile, screen leases tightly.
- Zoned schools: Edward D. Trice Elem. School (math 35% / reading 27%, grade F, #297 of 454 statewide, top 65%, 476 students, 100% FRL); Arkansas Middle School (906 students, 100% FRL); Arkansas High School (math 16% / reading 25%, grade F, #233 of 292 statewide, top 80%, 1,060 students, 100% FRL) — zoned schools average 100% FRL vs 64% district-wide (36 pts higher); higher-poverty schools than district average — tighter screening recommended.
- Market conditions: 276 active listings in the ZIP; 7 comparable units currently listed for rent nearby; rentals lingering (median 46d on market — plan ~5-8 weeks vacancy on turnover, expect pricing pressure); 100% of comp listings sitting > 30 days — soft ceiling on asking rent; 21 units permitted in Miller County in 2024 (0 in 5+ unit buildings).
- This rent runs 39% of the median local income ($47k/yr) — at the standard rent-burdened threshold; future hikes will face affordability resistance.
Forward outlook
- Local home prices are declining (-3.0%/yr); year-one equity from $1k of loan paydown is wiped out by about $6k of value loss. Plan a longer hold.
- Miller County population projected to shrink 7% by 2050 — rents likely to lag national; underwrite the cash flow, not the appreciation.
Negotiation context
- It's been on market 17 days — a 2% lower offer ($182k) is reasonable based on typical stale-listing flexibility.
- Current owner paid $76k; list at $185k implies a 143% gain — meaningful room to come down on a strong offer.
Risks & watch-outs
- Climate carrying-cost: extreme-heat days projected 7→22/yr by 2055 (HVAC capex compounding) — expect insurance premiums to compound above CPI over the hold.
Questions for the listing agent
- Built in 1976 — when were the roof, HVAC, electrical panel, plumbing, and water heater last replaced?
- Is there a deadline driving the sale (1031 exchange, divorce, estate, relocation)? That informs how much negotiation room exists.
- Schools are D-rated, which usually means shorter tenancies and higher turnover. Who's the typical renter profile here, and what's been the actual vacancy rate?
- Crime grade is F in this area — have there been break-ins, vandalism, or insurance claims at this property in the last 3 years? What carrier currently insures it and at what premium?
- The area grade is low — what's the realistic commute time and amenity access for the typical tenant pool here? Any planned neighborhood developments (good or bad) we should know about?
- What's the average days-on-market for RENTAL listings here right now (not sales)? A rising rental-DOM trend means longer vacancies and softer asking-rent achievability than the comps imply.
- What's the recent tenant-quality profile in this submarket — average credit score on applications, eviction rate, late-payment / NSF rate, and stable-employment percentage? A property-management company in the area should have these aggregated.
- How much new for-sale + rental construction is in the pipeline within 1–3 miles? Heavy new supply typically softens prices + rents 12–24 months out; constrained supply supports both.
Investment metrics
- 1% rule
- 0.82% ✗
- Cap rate
- 6.80%
- Cash-on-cash
- 1.83%
- DSCR
- 1.08
- GRM
- 10.1
CMA / ARV
- ARV (on-the-fly)
- $189,072
- Comps found
- 7
Show comp detail 7 sales within ~0.75 mi
| Address | Dist | Beds/Ba | Sqft | Sold | Price | $/sf | Match |
|---|---|---|---|---|---|---|---|
| 1304 E 30th | 0.32mi | 3/2.0 | 1,871 (+3%) | 20mo | $97,500 | $52 | 64 |
| 15 N Hermitage Dr | 0.34mi | 3/1.5 | 1,631 (-10%) | 4mo | $167,000 | $102 | 61 |
| 18 N Hermitage Dr | 0.39mi | 3/2.0 | 1,648 (-9%) | 10mo | $205,500 | $125 | 58 |
| 1325 E 31st St | 0.43mi | 3/2.0 | 1,587 (-13%) | 9mo | $199,500 | $126 | 52 |
| 2308 County Ave | 0.69mi | 3/2.0 | 2,027 (+12%) | 0mo | $170,000 | $84 | 48 |
| 2302 Locust St | 0.66mi | 3/1.0 | 1,671 (-8%) | 8mo | $173,500 | $104 | 45 |
| 3712 Central Ave | 0.58mi | 4/1.5 (+1) | 1,614 (-11%) | 20mo | $181,327 | $112 | 30 |
Match score weights: distance 35% · size 25% · config 20% · recency 20%. Top-matched comps best support the ARV.
Projected returns pro-forma
-3.0% appreciation · 3.0% rent growth · sell at horizon
- IRR
- -13.4%
- Equity multiple
- 0.52×
- Total profit
- $-25,024
- Equity at exit
- $27,584
- IRR
- -4.6%
- Equity multiple
- 0.70×
- Total profit
- $-15,611
- Equity at exit
- $15,995
Cash invested: $51,800 (down + closing). Projections, not guarantees.
Landlord ↔ Tenant lean methodology
- Overall (STATE)
- 92 Strongly Landlord-Friendly
- State Arkansas
- 92 Strongly Landlord-Friendly · R+14
- County
- — inherits STATE
- City
- — inherits STATE
ZIP-level market 71854
- Home prices YoY
- -16.9%
- Active inventory
- 276
- Price-to-rent
- 10.1×
Monthly cashflow live
- Estimated rent
- $1,523 high interval (Pro) →
- Mortgage (P&I)
- −$970
- Tax from tax record
- −$77 /mo · $922/yr
- Insurance
- −$77
- HOA
- −$0
- Vacancy / Maint / Mgmt
- −$320
- Net cashflow
- $79
Break-even live
Sensitivity live
| Price | -10% $184 | -5% $131 | +0% $79 | +5% $27 | +10% $-26 |
|---|---|---|---|---|---|
| Rent | -10% $-41 | -5% $19 | +0% $79 | +5% $139 | +10% $199 |
| Rate | -1.0pp $172 | -0.5pp $126 | base $79 | +0.5pp $31 | +1.0pp $-18 |
UW: 25.0% down · 7.5% · 30yr · 1.5% tax · 5.0% vac · 8.0% maint · 8.0% mgmt
Financing live
Cash to close
- Down payment
- $46,250
- Closing costs
- $5,550
- Reserves months
- —
- Total cash needed
- —
Loan-product check · same deal, 3 products live
Conventional
25% down · 7.5% · 30yr
- Down + closing
- —
- Monthly P&I
- —
- Monthly cashflow
- —
- DSCR
- —
- Eligible?
- —
Personal DTI + credit; lowest rate.
DSCR
20% down · 8.5% · 30yr
- Down + closing
- —
- Monthly P&I
- —
- Monthly cashflow
- —
- DSCR
- —
- Eligible?
- —
No personal income docs; deal must DSCR.
Hard money
10% down · 12.0% · 12mo
- Down + closing
- —
- Monthly P&I
- —
- Monthly cashflow
- —
- DSCR
- —
- Eligible?
- —
Short-term bridge; refi at stabilization.
Rent comps 7 comps
| Address | Beds | Baths | Sqft | Rent | $/sqft | DOM | Units | Dist |
|---|---|---|---|---|---|---|---|---|
| 2405 Tyler Ln Texarkana, AR | 3.0 | 2.0 | 1905 | $1,890 | $0.99 | 45d | 1 | 0.60mi |
| 2101 Pecan St Texarkana, AR | 3.0 | 1.0 | 1453 | $1,125 | $0.77 | 45d | 1 | 0.81mi |
| 4101 Olive St Texarkana, TX | 2.0 | 1.0 | 1400 | $1,300 | $0.93 | 45d | 1 | 0.93mi |
| 722 W 34th St Texarkana, TX | 2.0 | 1.0 | 1298 | $1,300 | $1.00 | 45d | 1 | 1.12mi |
| 3302 Anthony Dr Texarkana, TX | 3.0 | 2.0 | 1726 | $850 | $0.49 | 45d | 1 | 1.25mi |
| 4841 N Park Rd Texarkana, TX | 2.0 | 1.5 | 1260 | $1,100 | $0.87 | 45d | 1 | 1.37mi |
| 3514 Sabine Ave Texarkana, TX | 4.0 | 2.0 | 1600 | $1,845 | $1.15 | 45d | 1 | 1.40mi |
Listing history 14 events
-
2026-06-21days on market $185,000 Active 17 DOM
-
2026-06-19days on market $185,000 Active 15 DOM
-
2026-06-18days on market $185,000 Active 14 DOM
-
2026-06-17days on market $185,000 Active 13 DOM
-
2026-06-16days on market $185,000 Active 12 DOM
-
2026-06-15days on market $185,000 Active 11 DOM
-
2026-06-14days on market $185,000 Active 9 DOM
-
2026-06-13days on market $185,000 Active 8 DOM
-
2026-06-10days on market $185,000 Active 6 DOM
-
2026-06-09days on market $185,000 Active 5 DOM
-
2026-06-08days on market $185,000 Active 4 DOM
-
2026-06-07days on market $185,000 Active 3 DOM
-
2026-06-05remarks 316-char remark
-
2026-06-05$185,000 Active 1 DOM
ⓘ Source: listings_history table (triggers on properties + properties_extension) + one-shot
backfill from property_details.listing_events for pre-trigger history.
Tax reassessment forecast AR · Resets to sale price
- Current annual tax
- $922 · $77/mo
- Projected year-2 tax
- $1,184 · $99/mo
- Expected delta
- +$262/yr (+$22/mo · 28.4%)
ⓘ Screening estimate from a state-policy table — verify with the county assessor before closing.
Climate risk First Street
- Flood 1/10 Low FEMA zone X (unshaded) · 0% chance over 30 yrs
- Wildfire 1/10 Low
- Heat 7/10 Severe 7 d/yr ≥110°F today · 22 d/yr by 30 yrs out
- Wind 4/10 Moderate 23% chance of damaging wind over 30 yrs
- Air quality 2/10 Low 1 unhealthy d/yr today · 1 by 30 yrs out
Nearby sold comps map
Loading sold comps map…
Walkable amenities ~0.75 mi
Loading nearby amenities…
Taxation est. · year 1
- Rental income
- $18,273
- − Mortgage interest
- −$10,363
- − Property taxes
- −$922
- − Insurance
- −$925
- − Repairs & maintenance
- −$1,462
- − Management
- −$1,462
- − Depreciation
- −$5,382
- Taxable loss
- −$2,242
- Est. tax savings @ 24.0%
- +$538
- After-tax cash flow
- $1,485/yr
For passive investors: Depreciation is non-cash, so a rental often shows a tax loss while cash-flowing — sheltering income. Rental losses are passive: they offset passive income freely, and up to $25,000/yr can offset ordinary (W-2) income if you actively participate and your MAGI is under $100k (phasing out to $0 by $150k); unused losses carry forward. On sale, claimed depreciation is recaptured at up to 25%, and gains may owe capital-gains tax (a 1031 exchange can defer both). Figures are a year-1 estimate at your 24.0% rate — not tax advice; consult a CPA.
Schools (NCES district)
- District
- Texarkana School District
- NCES district ID
- 0513110
- Math proficiency
- 27% ▼ -12.00%
- Reading proficiency
- 24% ▼ -9.00%
- Median HH income
- $39,320
- Composite
- 21.47/100
- National rank
- #8332
- State rank
- #181 of 238 in AR
Livability — Texarkana
- Score
- 64/100
- State rank
- #177
- US rank
- #14514
Category grades
Schools grade is shown separately in the Schools card above.
Census & demographics
- Census place
- Texarkana, AR
- County
- Miller County · 35,720 people
- City population
- 35,720
- Metro
- Texarkana, TX-AR
- Population (ZIP)
- 35,720
- Household income
- $46,878
- Rent vs Own
- Severe rent burden
- 1388.0
Population outlook (Miller County) Hauer SSP2
- Today (2025)
- 44,197 people
- By 2030
- 43,844 · -0.8%
- By 2040
- 42,680 · -3.4%
- By 2050
- 41,024 · -7.2%
- By 2075
- 35,685 · -19.3%
- By 2100
- 28,325 · -35.9%
Race, ethnicity, and origin ACS 2023
- Neighborhood character
- Majority White (62%)
- Race & ethnicity
- White 62% Black 30% Hispanic / Latino 4% Two or more races 3%
- Common ancestry
- Lithuanian 1% Slovak 1%
- Foreign-born
- 2% · Canada
- Languages at home
- 98% English-only · Spanish 2%
Political lean MEDSL · Miller
- 2024 margin
- Solid R (+51.1) · D 23.9% · R 74.9% · Other 1.2%
- 2008→2024 swing
- -17.6pp toward R · 2008: -33.5pp · 2024: -51.1pp
- All cycles
- 2024: R+51.1 2020: R+46.4 2016: R+43.8 2012: R+39.8 2008: R+33.5
Not yet ingested
- Civics
- —
Market trends
- HPI YoY
- ▼ -40.00%
- Current HPI
- 196.7615
- Rent YoY
- —
- Metro
- Texarkana, TX-AR
- State GDP YoY
- ▲ 3.80%
- F500 in state
- 10
Industry mix (Fortune 500 HQ in AR)
| Industry | F500 HQs | Revenue |
|---|---|---|
| Retail | 1 | $681B |
|
||
| Food / Agriculture | 1 | $53B |
|
||
| Retail / Energy | 1 | $22B |
|
||
| Transportation / Logistics | 1 | $12B |
|
||
| Energy | 1 | $4B |
|
||
Price history
+1133.3% since first listed4 events — show timeline
- 2026-06-04 Listed $185,000 ForSaleByOwner.com
- 2004-02-18 Sold (Public Records) $76,000 Public Records
- 2002-12-16 Sold (Public Records) $65,000 Public Records
- 1997-09-12 Sold (Public Records) $15,000 Public Records
Property tax history
+3.7%/yrLatest (2025): $922 · -2.9% YoY. Source: county tax records.
Cash-flow waterfall
monthlySold comps — $/sqft
last 12 mo · ≤1 miLoading sold comps…