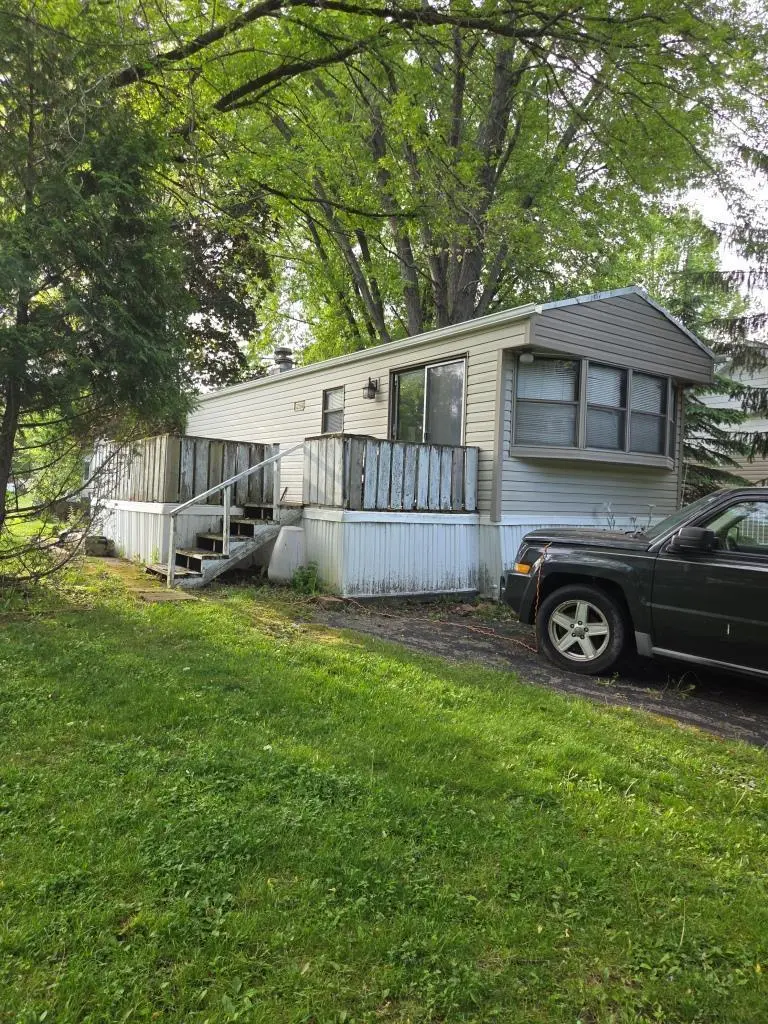
381 Skyline Dr · Fulton, WI
Flood risk No data
- FEMA flood zone
- —
- Chance of flooding over 30 yrs
- —
- Est. flood insurance / yr
- —
Fire risk No data
- Est. fire insurance / yr
- —
Heat risk No data
- Hot days now (above threshold)
- —
- Hot days in 30 yrs
- —
Wind risk No data
- Chance of severe wind over 30 yrs
- —
Air-quality risk No data
- Unhealthy air days now
- —
- Unhealthy air days in 30 yrs
- —
Risk factors via First Street. Map © Google.
Why this score? — see what drove the B- grade
The composite is a weighted blend of 9 inputs, each scored 0–100. Each bar is that input's sub-score; the figure is the points it added to the 100-point composite (weight × sub-score).
- Cash flow +26.4/30.0
- ARV discount +15.0/15.0
- DSCR +9.0/10.0
- 1% rule +8.0/10.0
- Schools +3.2/10.0
- Rent growth +2.5/5.0
- Livability +2.5/5.0
- Condition / age +2.2/5.0
- Appreciation +0.0/10.0
$85,000
🖨 Deal sheet (PDF) 📄 Offer letter ✓ Due diligence
Listing remarks
Great location for this 2 bedroom in RRLE. Enjoy the spacious greenspace and all that RRLE has to offer. 2 pools, fishing pond, tennis courts, and all the park amenities has to offer. This unit is on concrete. Needs some TLC, but a very nice unit. No DMV title. No access to shed.
Key facts
- Spacious greenspace
- Fishing pond
- Great location
Tags
Property features AI
Finance
- Other: Listed items include stove, refrigerator, and shed
- HOA & community: HOA fee approximately $750 yearly
Exterior
- Utilities: Municipal water; Municipal sewer
- Home design: Single-family, one-story home; Vinyl exterior; Located in Rock River Leisure Estates subdivision; PUD zoning
- Construction: 432 finished above-grade square feet (estimate); No finished below-grade space; Built (year from assessor/public record)
- Exterior features: Deck; Storage building (outbuilding); Rock nearby (body of water)
Interior
- Kitchen: Range/oven; Refrigerator
- Bedrooms: Main level master bedroom (10 x 6); Main level second bedroom (8 x 6)
- Bathrooms: One full bathroom; At least one tub; No master bedroom bath
- Heating & cooling: Lp gas wall furnace
- Interior features: Cable/satellite available
Neighborhood map
What this means for you Summary
Snapshot
- This is a 2-bed/1.0-bath single-family listed at $85k. Condition is rated fair.
Deal economics
- At list price, monthly cash flow is $221 ($3k/yr) — positive.
- The deal already cash-flows at list — no discount required.
- Meets the 1% rule at list price ($1k rent vs $85k).
- Recommended offer: $82k (3.0% below list) — sets the bar for market timing.
Location & tenants
- Location reads: area grade B — affects rentability + tenant quality, not the cash-flow math above.
- Edgerton School District (town): math 37% / reading 35% proficiency, ranked #202 of 342 in WI (top 59%) — families likely to look elsewhere, expect single-tenant / working-renter base with shorter leases.
- Zoned schools: Edgerton Community Elementary (math 39% / reading 30%, grade F, #610 of 1,041 statewide, top 63%, 844 students, 32% FRL); Edgerton Middle (math 39% / reading 41%, grade F, #144 of 383 statewide, top 39%, 424 students, 37% FRL); Edgerton High (math 22% / reading 27%, grade F, #287 of 483 statewide, top 71%, 543 students, 28% FRL) — zoned schools at 32% FRL track the district average.
- Market conditions: 80 active listings in the ZIP; solid renter incomes; 629 units permitted in Rock County in 2024 (263 in 5+ unit buildings).
- This rent is only 15% of the median local income ($89k/yr) — well below the 30% rent-burden line; pricing power to push rent on renewal without tenant pushback.
Forward outlook
- Local home prices are declining (-3.0%/yr); year-one equity from $588 of loan paydown is wiped out by about $3k of value loss. Plan a longer hold.
- Rock County population projected to shrink 7% by 2050 — rents likely to lag national; underwrite the cash flow, not the appreciation.
- At projected returns (-3.0% appreciation + 3.0% rent growth), your $24k cash investment doubles in ~10 years — after that, you're playing with house money.
Negotiation context
- It's been on market 32 days — a 3% lower offer ($82k) is reasonable based on typical stale-listing flexibility.
Questions for the listing agent
- It's been on market 32 days. Have you received any prior offers? Is the seller open to a 3% concession, seller financing, or rate buy-down credit?
- Have any recent inspections been done? Can we get a copy of the seller's disclosures and any deferred-maintenance estimates?
- What does the HOA fee cover, when was the last increase, and are there any pending special assessments or reserve-fund shortfalls?
- Is there a deadline driving the sale (1031 exchange, divorce, estate, relocation)? That informs how much negotiation room exists.
- What's the average days-on-market for RENTAL listings here right now (not sales)? A rising rental-DOM trend means longer vacancies and softer asking-rent achievability than the comps imply.
- What's the recent tenant-quality profile in this submarket — average credit score on applications, eviction rate, late-payment / NSF rate, and stable-employment percentage? A property-management company in the area should have these aggregated.
- How much new for-sale + rental construction is in the pipeline within 1–3 miles? Heavy new supply typically softens prices + rents 12–24 months out; constrained supply supports both.
Investment metrics
- 1% rule
- 1.30% ✓
- Cap rate
- 9.42%
- Cash-on-cash
- 11.16%
- DSCR
- 1.50
- GRM
- 6.4
CMA / ARV
- ARV (on-the-fly)
- $123,552
- Comps found
- 6
Show comp detail 6 sales within ~0.75 mi
| Address | Dist | Beds/Ba | Sqft | Sold | Price | $/sf | Match |
|---|---|---|---|---|---|---|---|
| 483 Westview Ct | 0.20mi | 2/1.0 | 397 (-8%) | 9mo | $117,500 | $296 | 70 |
| 372 Lakeview Cir | 0.05mi | 2/1.0 | 384 (-11%) | 16mo | $110,000 | $286 | 66 |
| 215 Skyway Dr | 0.55mi | 2/1.0 | 396 (-8%) | 6mo | $74,000 | $187 | 56 |
| 538 Glendale Dr | 0.30mi | 2/1.0 | 396 (-8%) | 23mo | $132,500 | $335 | 53 |
| 50 Highview Ln | 0.45mi | 1/1.0 (-1) | 384 (-11%) | 5mo | $40,000 | $104 | 51 |
| 459 Aspen Way | 0.53mi | 1/1.0 (-1) | 396 (-8%) | 21mo | $64,000 | $162 | 39 |
Match score weights: distance 35% · size 25% · config 20% · recency 20%. Top-matched comps best support the ARV.
Projected returns pro-forma
-3.0% appreciation · 3.0% rent growth · sell at horizon
- IRR
- 0.4%
- Equity multiple
- 1.02×
- Total profit
- $377
- Equity at exit
- $12,674
- IRR
- 10.1%
- Equity multiple
- 1.79×
- Total profit
- $18,702
- Equity at exit
- $7,349
Cash invested: $23,800 (down + closing). Projections, not guarantees.
Landlord ↔ Tenant lean methodology
- Overall (STATE)
- 73 Landlord-Friendly
- State Wisconsin
- 73 Landlord-Friendly · R+2
- County
- — inherits STATE
- City
- — inherits STATE
ZIP-level market 53534
- Active inventory
- 80
- Price-to-rent
- 6.4×
Monthly cashflow live
- Estimated rent
- $1,103 medium interval (Pro) →
- Mortgage (P&I)
- −$446
- Tax est. 1.5%
- −$106 /mo · $1,275/yr
- Insurance
- −$35
- HOA
- −$63
- Vacancy / Maint / Mgmt
- −$232
- Net cashflow
- $221
Break-even live
Sensitivity live
| Price | -10% $280 | -5% $251 | +0% $221 | +5% $192 | +10% $163 |
|---|---|---|---|---|---|
| Rent | -10% $134 | -5% $178 | +0% $221 | +5% $265 | +10% $308 |
| Rate | -1.0pp $264 | -0.5pp $243 | base $221 | +0.5pp $199 | +1.0pp $177 |
UW: 25.0% down · 7.5% · 30yr · 1.5% tax · 5.0% vac · 8.0% maint · 8.0% mgmt
Financing live
Cash to close
- Down payment
- $21,250
- Closing costs
- $2,550
- Reserves months
- —
- Total cash needed
- —
Loan-product check · same deal, 3 products live
Conventional
25% down · 7.5% · 30yr
- Down + closing
- —
- Monthly P&I
- —
- Monthly cashflow
- —
- DSCR
- —
- Eligible?
- —
Personal DTI + credit; lowest rate.
DSCR
20% down · 8.5% · 30yr
- Down + closing
- —
- Monthly P&I
- —
- Monthly cashflow
- —
- DSCR
- —
- Eligible?
- —
No personal income docs; deal must DSCR.
Hard money
10% down · 12.0% · 12mo
- Down + closing
- —
- Monthly P&I
- —
- Monthly cashflow
- —
- DSCR
- —
- Eligible?
- —
Short-term bridge; refi at stabilization.
HOA detail
- Monthly dues
- $63 · $756/yr
- Likely covers
- pool
Listing history 17 events
-
2026-06-22days on market $85,000 Active 32 DOM
-
2026-06-19days on market $85,000 Active 30 DOM
-
2026-06-18days on market $85,000 Active 29 DOM
-
2026-06-17days on market $85,000 Active 28 DOM
-
2026-06-16days on market $85,000 Active 27 DOM
-
2026-06-15days on market $85,000 Active 26 DOM
-
2026-06-14days on market $85,000 Active 24 DOM
-
2026-06-13days on market $85,000 Active 23 DOM
-
2026-06-10days on market $85,000 Active 21 DOM
-
2026-06-09days on market $85,000 Active 20 DOM
-
2026-06-08days on market $85,000 Active 19 DOM
-
2026-06-07days on market $85,000 Active 18 DOM
-
2026-06-02days on market $85,000 Active 13 DOM
-
2026-06-01days on market $85,000 Active 12 DOM
-
2026-05-31days on market $85,000 Active 11 DOM
-
2026-05-30days on market $85,000 Active 10 DOM
-
2026-05-20$85,000 Active
ⓘ Source: listings_history table (triggers on properties + properties_extension) + one-shot
backfill from property_details.listing_events for pre-trigger history.
Nearby sold comps map
Loading sold comps map…
Walkable amenities ~0.75 mi
Loading nearby amenities…
Taxation est. · year 1
- Rental income
- $13,241
- − Mortgage interest
- −$4,761
- − Property taxes
- −$1,275
- − Insurance
- −$425
- − Repairs & maintenance
- −$1,059
- − Management
- −$1,059
- − HOA
- −$756
- − Depreciation
- −$2,473
- Taxable income
- $1,433
- Est. tax owed @ 24.0%
- −$344
- After-tax cash flow
- $2,312/yr
For passive investors: Depreciation is non-cash, so a rental often shows a tax loss while cash-flowing — sheltering income. Rental losses are passive: they offset passive income freely, and up to $25,000/yr can offset ordinary (W-2) income if you actively participate and your MAGI is under $100k (phasing out to $0 by $150k); unused losses carry forward. On sale, claimed depreciation is recaptured at up to 25%, and gains may owe capital-gains tax (a 1031 exchange can defer both). Figures are a year-1 estimate at your 24.0% rate — not tax advice; consult a CPA.
Condition & rehab AI · 22 photos
This mobile home requires moderate repairs and maintenance to improve its condition and increase its value.
Repairs flagged
- Minor kitchen cabinets — slight wear
- Minor bathroom fixtures — standard condition
- Moderate exterior siding — mobile home siding
- Minor interior walls — wood paneling
- Minor roof — visible roof structure
- Minor windows — standard windows
- Minor HVAC unit — standard air conditioning unit
Value-add opportunities
- Both paint interior walls — enhances appearance and value
- Both replace carpets with hardwood flooring — increases both resale and rental value
- Both upgrade kitchen cabinets — modernizes the space and adds value
Renovation cost estimate screening
| Repair item | Severity | Est. cost |
|---|---|---|
| kitchen cabinets · slight wear | Minor | $500–3,000 |
| bathroom fixtures · standard condition | Minor | $500–3,000 |
| exterior siding · mobile home siding | Moderate | $3,000–15,000 |
| interior walls · wood paneling | Minor | $500–3,000 |
| roof · visible roof structure | Minor | $500–3,000 |
| windows · standard windows | Minor | $500–3,000 |
| HVAC unit · standard air conditioning unit | Minor | $500–3,000 |
| Total estimated repair cost · 7 items | $6,000–33,000 |
Value-add ROI direction
- Both paint interior walls — enhances appearance and value ↑
- Both replace carpets with hardwood flooring — increases both resale and rental value ↑
- Both upgrade kitchen cabinets — modernizes the space and adds value ↑
ⓘ Cost ranges are severity-bucket heuristics (US national rule-of-thumb). Get contractor quotes + a written scope before underwriting a rehab budget.
Schools (NCES district)
- District
- Edgerton School District
- NCES district ID
- 5504110
- Math proficiency
- 37% ▼ -5.00%
- Reading proficiency
- 35% ▼ -10.00%
- Median HH income
- $59,472
- Composite
- 32.1/100
- National rank
- #5808
- State rank
- #202 of 342 in WI
Livability — Fulton
No livability data for this city. (Only ~50 U.S. cities are tracked.)
Census & demographics
- County
- Rock County · 135,428 people
- Metro
- Janesville-Beloit, WI
- Population (ZIP)
- 12,241
- Household income
- $89,045
- Rent vs Own
- Severe rent burden
- 159.0
Population outlook (Rock County) Hauer SSP2
- Today (2025)
- 163,403 people
- By 2030
- 162,815 · -0.4%
- By 2040
- 158,655 · -2.9%
- By 2050
- 151,235 · -7.4%
- By 2075
- 131,901 · -19.3%
- By 2100
- 108,665 · -33.5%
Race, ethnicity, and origin ACS 2023
- Neighborhood character
- Predominantly White (86%)
- Race & ethnicity
- White 86% Hispanic / Latino 10% Two or more races 7%
- Hispanic origin (detail)
- Mexican 9%
- Common ancestry
- Portuguese 18% Romanian 4% Lithuanian 2%
- Foreign-born
- 3% · Canada
- Languages at home
- 91% English-only · Spanish 8%
Political lean MEDSL · Rock
- 2024 margin
- Lean D (+7.3) · D 52.9% · R 45.6% · Other 1.4%
- 2008→2024 swing
- -22.0pp toward R · 2008: 29.3pp · 2024: 7.3pp
- All cycles
- 2024: D+7.3 2020: D+11.2 2016: D+10.5 2012: D+23.2 2008: D+29.3
Not yet ingested
- Civics
- —
Market trends
- HPI YoY
- ▼ -163.16%
- Current HPI
- 256.4231
- Rent YoY
- —
- Metro
- Janesville-Beloit, WI
- State GDP YoY
- ▲ 2.10%
- F500 in state
- 20
Industry mix (Fortune 500 HQ in WI)
| Industry | F500 HQs | Revenue |
|---|---|---|
| Industrial Machinery | 4 | $23B |
|
||
| Industrial Technology | 2 | $36B |
|
||
| Insurance | 1 | $36B |
|
||
| Professional Services | 1 | $19B |
|
||
| Utilities | 1 | $9B |
|
||
| Consumer Goods | 1 | $3B |
|
||
Price history
1 event — show timeline
- 2026-05-20 Listed $85,000 SCWMLS
Cash-flow waterfall
monthlySold comps — $/sqft
last 12 mo · ≤1 miLoading sold comps…