 Duplex
1201, 1203 S 3rd Ave · Ozark, MO
Flood risk 7/10 · Major
- FEMA flood zone
- X (unshaded)
- Chance of flooding over 30 yrs
- 0.76%
- Est. flood insurance / yr
- $473 – $860
Fire risk 2/10 · Minimal
- Est. fire insurance / yr
- $1,054 – $1,958
Heat risk 5/10 · Moderate
- Hot days now (above 104°F)
- 7 days/yr
- Hot days in 30 yrs
- 19 days/yr
Wind risk 2/10 · Minimal
- Chance of severe wind over 30 yrs
- —
Air-quality risk 1/10 · Minimal
- Unhealthy air days now
- 0 days/yr
- Unhealthy air days in 30 yrs
- 0 days/yr
Risk factors via First Street. Map © Google.
Why this score? — see what drove the C grade
The composite is a weighted blend of 9 inputs, each scored 0–100. Each bar is that input's sub-score; the figure is the points it added to the 100-point composite (weight × sub-score).
- Cash flow +19.1/30.0
- ARV discount +13.9/15.0
- DSCR +6.0/10.0
- Schools +5.2/10.0
- 1% rule +5.1/10.0
- Rent growth +3.8/5.0
- Livability +3.6/5.0
- Condition / age +2.2/5.0
- Appreciation +0.0/10.0
$229,000
🖨 Deal sheet (PDF) 📄 Offer letter ✓ Due diligence
Multi-family units
County records classify this as Multi-Family (2-4 Unit). Listing-text estimate: 2 units. confirmed
Listing remarks
Rare chance to pick up an income producing duplex in Ozark, Missouri. Located just South of the Square, it's on a corner lot with great access. Tenants in both sides. Shown by appointment only.
Key facts
- Great access
- Corner lot
- 7,841 sq ft lot
Tags
Property features AI
Exterior
- Parking: 2-car garage
- Utilities: Public water; Public sewer
- Home design: Duplex residential income property; One level
- Exterior features: Public maintained road access; City street frontage; Corner lot
Interior
- Bathrooms: 2 full bathrooms
- Heating & cooling: Central air conditioning; Natural gas central heating
- Interior features: Central air conditioning; Natural gas central heating
Neighborhood map
What this means for you Summary
Snapshot
- This is a 2 × 2-bed/1.0-bath units multifamily listed at $229k. Condition is rated fair.
Deal economics
- At list price, monthly cash flow is $188 ($2k/yr) — positive. Per door: $94/mo.
- The deal already cash-flows at list — no discount required.
- Meets the 1% rule at list price ($2k rent vs $229k).
- Cap rate 7.6% vs local median 2.8% in Ozark — top-decile yield for the area; either an underpriced asset or a hidden risk that comps aren't pricing in. Stress-test before assuming the spread holds.
Location & tenants
- Location reads 72/100 on livability (#94 in MO) — a middle-class / working-renter tenant base. Strengths: crime A+, cost of living A+, housing A+; Watch: amenities F, commute F, health & safety F.
- Ozark R-VI (rural): math 60% / reading 62% proficiency, ranked #10 of 324 in MO (top 3%) — acceptable for families but not a draw, mixed tenant base, ~2y average lease.
- Zoned schools: East Elem. (math 70% / reading 69%, grade A-, #28 of 1,115 statewide, top 3%, 529 students, 35% FRL); Ozark Jr. High (math 54% / reading 59%, grade B, #38 of 391 statewide, top 10%, 946 students, 37% FRL); Ozark High (math 47% / reading 64%, grade C, #64 of 521 statewide, top 12%, 1,838 students, 33% FRL).
- Market conditions: Rents rising fast (+5.3%/yr); 374 active listings in the ZIP; 7 comparable units currently listed for rent nearby; rentals at typical pace (median 22d on market — plan ~3-4 weeks tenant-placement turnaround); solid renter incomes; 537 units permitted in Christian County in 2024 (0 in 5+ unit buildings).
- This rent runs 36% of the median local income ($78k/yr) — at the standard rent-burdened threshold; future hikes will face affordability resistance.
Forward outlook
- Local home prices are declining (-3.0%/yr); year-one equity from $2k of loan paydown is wiped out by about $7k of value loss. Plan a longer hold.
- Christian County population projected at +24% by 2050 — long-run rental-demand tailwind backs the buy-and-hold thesis.
Negotiation context
- Only 1 days on market — expect competitive offers; lowballing is unlikely to land.
Risks & watch-outs
- Watch-outs: flood insurance adds $56/mo.
- Climate carrying-cost: major flood risk; extreme-heat days projected 7→19/yr by 2055 (HVAC capex compounding) — expect insurance premiums to compound above CPI over the hold.
Questions for the listing agent
- Can we see the unit-by-unit rent roll, current vacancy, and any below-market leases? What's the average tenancy length?
- What capital expenditures (roof, boiler, parking lot, exteriors) have been made in the last 5 years, and what's planned in the next 2?
- Have any recent inspections been done? Can we get a copy of the seller's disclosures and any deferred-maintenance estimates?
- Built in 1970 — when were the roof, HVAC, electrical panel, plumbing, and water heater last replaced?
- What's the actual annual flood-insurance premium (NFIP or private), and is the property in a SFHA with mandatory coverage?
- Is there a deadline driving the sale (1031 exchange, divorce, estate, relocation)? That informs how much negotiation room exists.
- Schools are B-rated — typically a magnet for longer-tenancy family renters. What's the average tenant stay here, and is there a school-zone premium baked into asking?
- What's the average days-on-market for RENTAL listings here right now (not sales)? A rising rental-DOM trend means longer vacancies and softer asking-rent achievability than the comps imply.
- What's the recent tenant-quality profile in this submarket — average credit score on applications, eviction rate, late-payment / NSF rate, and stable-employment percentage? A property-management company in the area should have these aggregated.
- How much new apartment / multifamily construction is in the pipeline within 1–3 miles? Heavy new supply (>2% of stock underway) typically softens rents 12–24 months out; light construction supports rent growth.
Investment metrics
- 1% rule
- 1.01% ✓
- Cap rate
- 7.57%
- Cash-on-cash
- 4.56%
- DSCR
- 1.20
- GRM
- 8.3
CMA / ARV
- ARV (on-the-fly)
- $267,050
- Comps found
- 1
Show comp detail 1 sale within ~0.75 mi
| Address | Dist | Beds/Ba | Sqft | Sold | Price | $/sf | Match |
|---|---|---|---|---|---|---|---|
| 205/207 E Georgia St | 0.48mi | 4/2.0 | 1,488 (-2%) | 16mo | $259,900 | $175 | 60 |
Match score weights: distance 35% · size 25% · config 20% · recency 20%. Top-matched comps best support the ARV.
Projected returns pro-forma
-3.0% appreciation · 5.34% rent growth · sell at horizon
- IRR
- -8.1%
- Equity multiple
- 0.70×
- Total profit
- $-19,471
- Equity at exit
- $34,145
- IRR
- 4.4%
- Equity multiple
- 1.35×
- Total profit
- $22,755
- Equity at exit
- $19,800
Cash invested: $64,120 (down + closing). Projections, not guarantees.
Landlord ↔ Tenant lean methodology
- Overall (STATE)
- 81 Strongly Landlord-Friendly
- State Missouri
- 81 Strongly Landlord-Friendly · R+10
- County
- — inherits STATE
- City
- — inherits STATE
ZIP-level market 65721
- Rents YoY
- 5.3%
- Active inventory
- 374
- Price-to-rent
- 16.5×
Monthly cashflow live
- Estimated rent
- $2,312 high interval (Pro) →
- Mortgage (P&I)
- −$1,201
- Tax est. 1.5%
- −$286 /mo · $3,435/yr
- Insurance
- −$95
- Flood insurance flood zone
- −$56 /mo · $666/yr
- HOA
- −$0
- Vacancy / Maint / Mgmt
- −$486
- Net cashflow
- $188
Break-even live
Sensitivity live
| Price | -10% $347 | -5% $267 | +0% $188 | +5% $109 | +10% $30 |
|---|---|---|---|---|---|
| Rent | -10% $6 | -5% $97 | +0% $188 | +5% $280 | +10% $371 |
| Rate | -1.0pp $304 | -0.5pp $247 | base $188 | +0.5pp $129 | +1.0pp $69 |
2-unit breakdown (identical units grouped — click to expand)
| Units | Beds | Baths | Est. rent |
|---|---|---|---|
| 2× units | 2 | 1 | $2,312 |
| #1 | 2 | 1 | $1,156 |
| #2 | 2 | 1 | $1,156 |
| Total (2 units) | $2,312 | ||
UW: 25.0% down · 7.5% · 30yr · 1.5% tax · 5.0% vac · 8.0% maint · 8.0% mgmt
Financing live
Cash to close
- Down payment
- $57,250
- Closing costs
- $6,870
- Reserves months
- —
- Total cash needed
- —
Loan-product check · same deal, 3 products live
Conventional
25% down · 7.5% · 30yr
- Down + closing
- —
- Monthly P&I
- —
- Monthly cashflow
- —
- DSCR
- —
- Eligible?
- —
Personal DTI + credit; lowest rate.
DSCR
20% down · 8.5% · 30yr
- Down + closing
- —
- Monthly P&I
- —
- Monthly cashflow
- —
- DSCR
- —
- Eligible?
- —
No personal income docs; deal must DSCR.
Hard money
10% down · 12.0% · 12mo
- Down + closing
- —
- Monthly P&I
- —
- Monthly cashflow
- —
- DSCR
- —
- Eligible?
- —
Short-term bridge; refi at stabilization.
Rent comps 7 comps
| Address | Beds | Baths | Sqft | Rent | $/sqft | DOM | Units | Dist |
|---|---|---|---|---|---|---|---|---|
| 1215 S 14th Ave Ozark, MO | 3.0 | 2.0 | 1292 | $1,495 | $1.16 | 21d | 1 | 0.63mi |
| 707 E Watermill Cir Ozark, MO | 3.0 | 2.0 | 1300 | $1,495 | $1.15 | 14d | 1 | 0.67mi |
| 1420 S Treetop Ct Ozark, MO | 3.0 | 2.0 | 1484 | $1,625 | $1.10 | 24d | 1 | 0.70mi |
| 1431 S Treetop Ct Ozark, MO | 3.0 | 2.0 | 1362 | $1,795 | $1.32 | 24d | 1 | 0.75mi |
| FIC Ozark, MO | 3.0 | 2.0 | 1440 | $951 | $0.66 | 21d | 1 | 0.76mi |
| 1352 W Kirkwood St Ozark, MO | 3.0 | 2.0 | 1500 | $1,695 | $1.13 | 14d | 1 | 0.79mi |
| 1582 S 14th Ave Ozark, MO | 1.0–3.0 | 1.0–2.0 | 1050 | $1,300 | $1.24 | 14d | 1 | 0.79mi |
Listing history 3 events
-
2026-06-13status $229,000 Pending 1 DOM
-
2026-06-09remarks 193-char remark
-
2026-06-09$229,000 Active 1 DOM
ⓘ Source: listings_history table (triggers on properties + properties_extension) + one-shot
backfill from property_details.listing_events for pre-trigger history.
Climate risk First Street
- Flood 7/10 Severe FEMA zone X (unshaded) · 76% chance over 30 yrs
- Wildfire 2/10 Low
- Heat 5/10 Major 7 d/yr ≥104°F today · 19 d/yr by 30 yrs out
- Wind 2/10 Low
- Air quality 1/10 Low 0 unhealthy d/yr today · 0 by 30 yrs out
Nearby sold comps map
Loading sold comps map…
Walkable amenities ~0.75 mi
Loading nearby amenities…
Taxation est. · year 1
- Rental income
- $27,744
- − Mortgage interest
- −$12,828
- − Property taxes
- −$3,435
- − Insurance
- −$1,812
- − Repairs & maintenance
- −$2,220
- − Management
- −$2,220
- − Depreciation
- −$6,662
- Taxable loss
- −$1,431
- Est. tax savings @ 24.0%
- +$343
- After-tax cash flow
- $2,604/yr
For passive investors: Depreciation is non-cash, so a rental often shows a tax loss while cash-flowing — sheltering income. Rental losses are passive: they offset passive income freely, and up to $25,000/yr can offset ordinary (W-2) income if you actively participate and your MAGI is under $100k (phasing out to $0 by $150k); unused losses carry forward. On sale, claimed depreciation is recaptured at up to 25%, and gains may owe capital-gains tax (a 1031 exchange can defer both). Figures are a year-1 estimate at your 24.0% rate — not tax advice; consult a CPA.
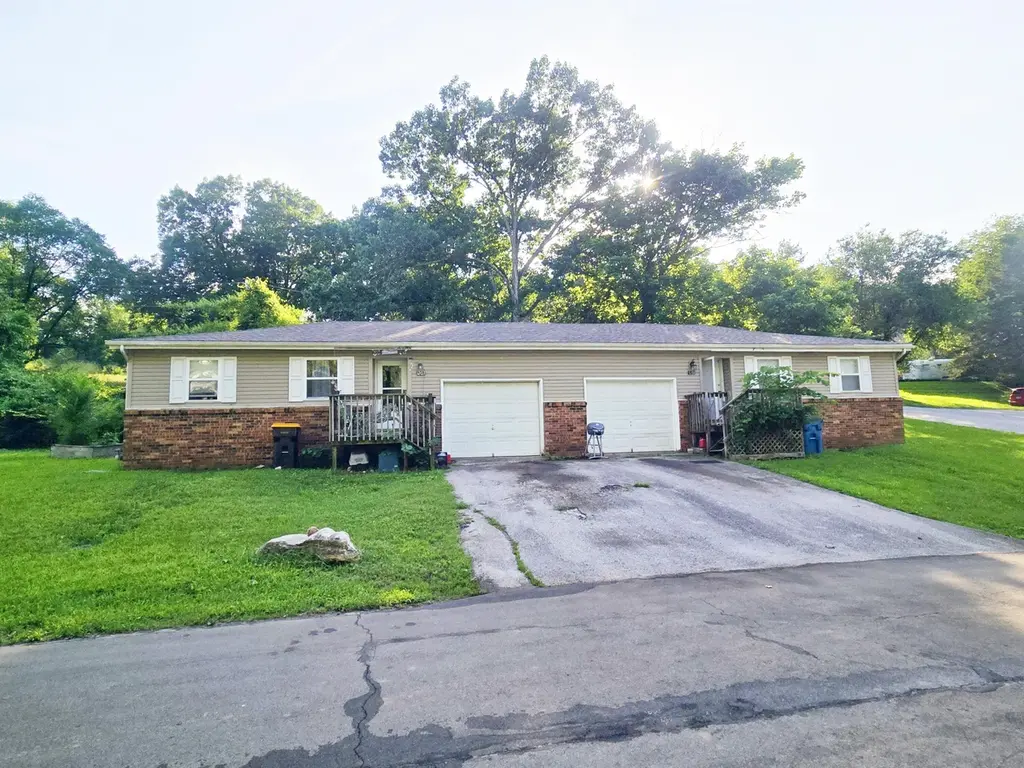
Condition & rehab AI · 2 photos
This multi-family property requires moderate repairs to the exterior siding and roof, along with some landscaping. Upgrades to these areas can significantly increase its value.
Repairs flagged
- Moderate Exterior siding — Weathered appearance
- Moderate Roof — Aged appearance
Value-add opportunities
- Both Paint exterior siding — Fresh paint can improve curb appeal and value
- Both Replace roof — A new roof will significantly increase the home's value and reduce maintenance costs
- Both Landscaping — Well-maintained landscaping can enhance curb appeal and attract tenants
Renovation cost estimate screening
| Repair item | Severity | Est. cost |
|---|---|---|
| Exterior siding · Weathered appearance | Moderate | $3,000–15,000 |
| Roof · Aged appearance | Moderate | $3,000–15,000 |
| Total estimated repair cost · 2 items | $6,000–30,000 |
Value-add ROI direction
- Both Paint exterior siding — Fresh paint can improve curb appeal and value ↑
- Both Replace roof — A new roof will significantly increase the home's value and reduce maintenance costs ↑
- Both Landscaping — Well-maintained landscaping can enhance curb appeal and attract tenants ↑
ⓘ Cost ranges are severity-bucket heuristics (US national rule-of-thumb). Get contractor quotes + a written scope before underwriting a rehab budget.
Schools (NCES district)
- District
- Ozark R-VI
- NCES district ID
- 2923430
- Math proficiency
- 60% ▼ -1.00%
- Reading proficiency
- 62% ▼ -3.00%
- Median HH income
- $54,408
- Composite
- 52.33/100
- National rank
- #1590
- State rank
- #10 of 324 in MO
Livability — Ozark
- Score
- 72/100
- State rank
- #94
- US rank
- #6242
Category grades
Schools grade is shown separately in the Schools card above.
Census & demographics
- Census place
- Ozark, MO
- County
- Christian County · 70,465 people
- City population
- 33,452
- Metro
- Springfield, MO
- Population (ZIP)
- 33,452
- Household income
- $77,507
- Rent vs Own
- Severe rent burden
- 673.0
Population outlook (Christian County) Hauer SSP2
- Today (2025)
- 95,071 people
- By 2030
- 100,379 · +5.6%
- By 2040
- 109,902 · +15.6%
- By 2050
- 117,487 · +23.6%
- By 2075
- 130,738 · +37.5%
- By 2100
- 131,730 · +38.6%
Race, ethnicity, and origin ACS 2023
- Neighborhood character
- Predominantly White (91%)
- Race & ethnicity
- White 91% Two or more races 5% Hispanic / Latino 4%
- Common ancestry
- Italian 3% Slovak 2% Portuguese 2%
- Foreign-born
- 3% · Canada
- Languages at home
- 95% English-only · Spanish 3% Other Indo-European 1% Russian/Polish/Slavic 1%
Political lean MEDSL · Christian
- 2024 margin
- Solid R (+52.2) · D 23.3% · R 75.6% · Other 1.1%
- 2008→2024 swing
- -16.4pp toward R · 2008: -35.8pp · 2024: -52.2pp
- All cycles
- 2024: R+52.2 2020: R+50.8 2016: R+54.2 2012: R+46.5 2008: R+35.8
Not yet ingested
- Civics
- —
Market trends
- HPI YoY
- ▼ -103.28%
- Current HPI
- 188.699
- Rent YoY
- ▲ 5.34%
- Metro
- Springfield, MO
- State GDP YoY
- ▲ 1.84%
- F500 in state
- 20
Industry mix (Fortune 500 HQ in MO)
| Industry | F500 HQs | Revenue |
|---|---|---|
| Healthcare | 1 | $163B |
|
||
| Insurance | 1 | $21B |
|
||
| Industrial Technology | 1 | $17B |
|
||
| Retail | 1 | $16B |
|
||
| Industrial Distribution | 1 | $10B |
|
||
| Utilities | 1 | $9B |
|
||
Price history
1 event — show timeline
- 2026-06-09 Listed $229,000 SOMO
Cash-flow waterfall
monthlySold comps — $/sqft
last 12 mo · ≤1 miLoading sold comps…