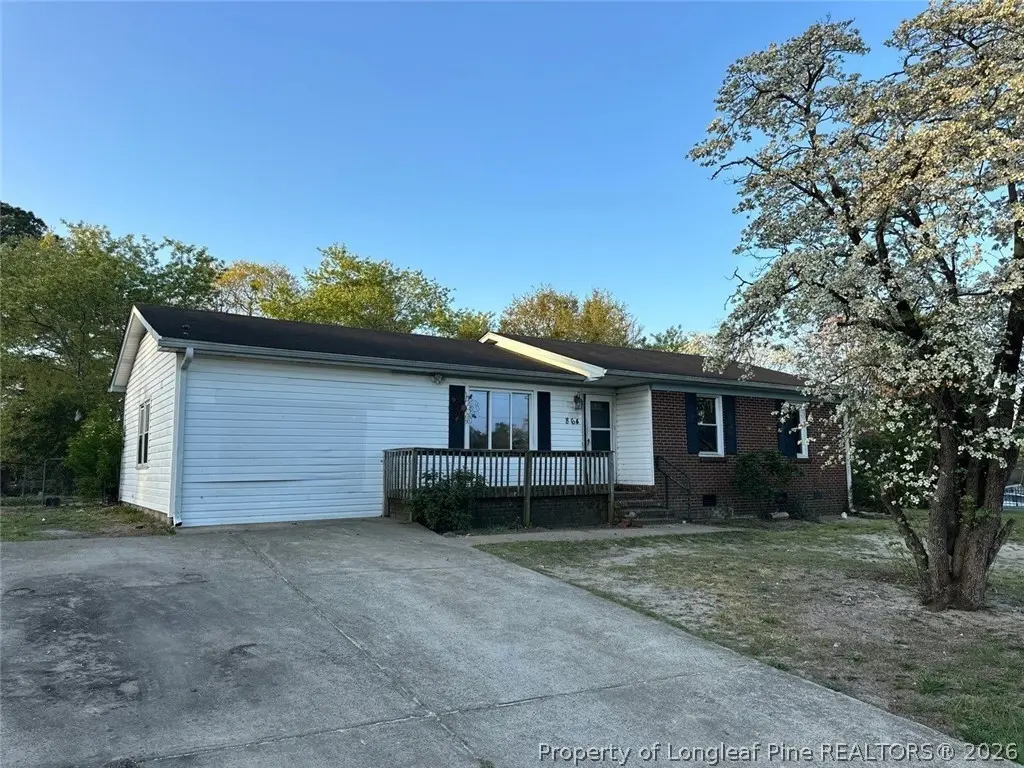
864 Durwood Dr · Fayetteville, NC
Flood risk 1/10 · Minimal
- FEMA flood zone
- X (unshaded)
- Chance of flooding over 30 yrs
- 0.0%
- Est. flood insurance / yr
- $473 – $860
Fire risk 5/10 · Moderate
- Est. fire insurance / yr
- $906 – $1,684
Heat risk 7/10 · Major
- Hot days now (above 105°F)
- 7 days/yr
- Hot days in 30 yrs
- 16 days/yr
Wind risk 7/10 · Major
- Chance of severe wind over 30 yrs
- 78.0%
Air-quality risk 2/10 · Minimal
- Unhealthy air days now
- 0 days/yr
- Unhealthy air days in 30 yrs
- 1 days/yr
Risk factors via First Street. Map © Google.
Why this score? — see what drove the B grade
The composite is a weighted blend of 9 inputs, each scored 0–100. Each bar is that input's sub-score; the figure is the points it added to the 100-point composite (weight × sub-score).
- Cash flow +26.8/30.0
- ARV discount +15.0/15.0
- DSCR +9.2/10.0
- 1% rule +7.6/10.0
- Livability +3.8/5.0
- Rent growth +3.2/5.0
- Schools +3.1/10.0
- Condition / age +2.5/5.0
- Appreciation +0.0/10.0
$125,000
🖨 Deal sheet 📄 Offer letter ✓ Due diligence
Listing remarks
NEW INVESTMENT PROPERTY LISTING! PRICE IMPROVEMENT! GREAT OPPORTUNITY TO FLIP OR HOLD PROPERTY! 3BED/2BATH HOME READY FOR YOUR PERSONAL TOUCH! SWEAT EQUITY IS THE BEST EQUITY FOR A CASH BUYER ONLY! TAKE A FAST LOOK YOU DON'T SEE MANY DEALS THESE DAYS! NEEDS A LOT OF WORK! GREAT PRICE AT ONLY $139,900 AND OVER 1300 SQFT THIS IS ONE TO TAKE ADVANTAGE OF TODAY! SCHEDULE TO SEE BEFORE IT IS GONE!
Key facts
- Built 1970
- Listed 22 days
Property features AI
Exterior
- Utilities: Public water; Public sewer
- Home design: Single family residential property
- Construction: Brick veneer construction
- Exterior features: Brick veneer exterior
Interior
- Kitchen: Eat-in kitchen
- Bedrooms: 5 total rooms (includes bedrooms and living spaces)
- Flooring: Other flooring
- Bathrooms: 2 full bathrooms
- Heating & cooling: Has heating; Other type of heating
- Interior features: Eat-in kitchen; Crawl space basement
- Laundry & utility: Washer hookup
Neighborhood map
What this means for you Summary
Snapshot
- This is a 4-bed/2.0-bath single-family listed at $125k.
Deal economics
- At list price, monthly cash flow is $343 ($4k/yr) — positive.
- The deal already cash-flows at list — no discount required.
- Meets the 1% rule at list price ($2k rent vs $125k).
- Recommended offer: $123k (1.5% below list) — sets the bar for market timing.
- Cap rate 9.6% vs local median 4.9% in Fayetteville — top-decile yield for the area; either an underpriced asset or a hidden risk that comps aren't pricing in. Stress-test before assuming the spread holds.
Location & tenants
- Location reads 75/100 on livability (#45 in NC, #4,031 nationally) — a middle-class / working-renter tenant base. Strengths: commute A+, cost of living A+, housing A+; Watch: crime F, employment D-.
- Cumberland County Schools (urban): math 32% / reading 41% proficiency, ranked #126 of 178 in NC (top 71%) — families likely to look elsewhere, expect single-tenant / working-renter base with shorter leases.
- Zoned schools: Spring Lake Middle (math 15% / reading 31%, grade F, #406 of 475 statewide, top 86%, 512 students, 99% FRL); E E Smith High (math 42% / reading 41%, grade F, #381 of 535 statewide, top 72%, 1,004 students, 99% FRL) — zoned schools average 99% FRL vs 55% district-wide (45 pts higher); higher-poverty schools than district average — tighter screening recommended.
- Market conditions: Rents rising (+2.8%/yr); 360 active listings in the ZIP; 18 comparable units currently listed for rent nearby; rentals at typical pace (median 21d on market — plan ~3-4 weeks tenant-placement turnaround); 1,125 units permitted in Cumberland County in 2024 (104 in 5+ unit buildings).
- This rent runs 30% of the median local income ($62k/yr) — at the standard rent-burdened threshold; future hikes will face affordability resistance.
Forward outlook
- Local home prices are declining (-3.0%/yr); year-one equity from $864 of loan paydown is wiped out by about $4k of value loss. Plan a longer hold.
- At projected returns (-3.0% appreciation + 2.8% rent growth), your $35k cash investment doubles in ~10 years — after that, you're playing with house money.
Negotiation context
- It's been on market 22 days — a 2% lower offer ($123k) is reasonable based on typical stale-listing flexibility.
- Current owner paid $62k; list at $125k implies a 100% gain — meaningful room to come down on a strong offer.
Risks & watch-outs
- Climate carrying-cost: major wind risk, 78% chance of damaging wind over 30y; moderate wildfire risk; extreme-heat days projected 7→16/yr by 2055 (HVAC capex compounding) — expect insurance premiums to compound above CPI over the hold.
Questions for the listing agent
- Built in 1970 — when were the roof, HVAC, electrical panel, plumbing, and water heater last replaced?
- Is there a deadline driving the sale (1031 exchange, divorce, estate, relocation)? That informs how much negotiation room exists.
- Crime grade is F in this area — have there been break-ins, vandalism, or insurance claims at this property in the last 3 years? What carrier currently insures it and at what premium?
- What's the average days-on-market for RENTAL listings here right now (not sales)? A rising rental-DOM trend means longer vacancies and softer asking-rent achievability than the comps imply.
- What's the recent tenant-quality profile in this submarket — average credit score on applications, eviction rate, late-payment / NSF rate, and stable-employment percentage? A property-management company in the area should have these aggregated.
- How much new for-sale + rental construction is in the pipeline within 1–3 miles? Heavy new supply typically softens prices + rents 12–24 months out; constrained supply supports both.
Investment metrics
- 1% rule
- 1.26% ✓
- Cap rate
- 9.59%
- Cash-on-cash
- 11.76%
- DSCR
- 1.52
- GRM
- 6.6
CMA / ARV
- ARV (on-the-fly)
- $182,160
- Comps found
- 12
Show comp detail 12 sales within ~0.75 mi
| Address | Dist | Beds/Ba | Sqft | Sold | Price | $/sf | Match |
|---|---|---|---|---|---|---|---|
| 801 Darlington Dr | 0.07mi | 3/2.0 (-1) | 1,066 (-3%) | 1mo | $100,000 | $94 | 85 |
| 1526 Argon Ave | 0.45mi | 3/2.0 (-1) | 1,116 (+1%) | 9mo | $189,000 | $169 | 65 |
| 319 Nugget Ct | 0.50mi | 3/1.5 (-1) | 1,132 (+2%) | 2mo | $195,000 | $172 | 64 |
| 806 Opal Ct | 0.12mi | 3/2.0 (-1) | 1,246 (+13%) | 6mo | $204,000 | $164 | 63 |
| 698 Dowfield Dr | 0.69mi | 3/2.0 (-1) | 1,111 (+1%) | 3mo | $128,000 | $115 | 59 |
| 758 Amber Dr | 0.37mi | 3/1.5 (-1) | 1,195 (+8%) | 6mo | $150,000 | $126 | 57 |
| 735 Amber Dr | 0.31mi | 3/1.5 (-1) | 1,184 (+7%) | 13mo | $160,000 | $135 | 55 |
| 683 Dowfield Dr | 0.72mi | 3/2.0 (-1) | 1,066 (-3%) | 3mo | $175,999 | $165 | 53 |
| 4414 Cameo Ct | 0.46mi | 3/2.0 (-1) | 1,244 (+13%) | 4mo | $212,000 | $170 | 49 |
| 1530 Argon Ave | 0.46mi | 3/2.0 (-1) | 1,259 (+14%) | 4mo | $213,800 | $170 | 46 |
| 927 Fiske Dr | 0.70mi | 3/1.0 (-1) | 1,012 (-8%) | 4mo | $127,000 | $125 | 41 |
| 328 Cadmium Ct | 0.62mi | 3/2.0 (-1) | 1,262 (+14%) | 5mo | $215,000 | $170 | 38 |
Match score weights: distance 35% · size 25% · config 20% · recency 20%. Top-matched comps best support the ARV.
Projected returns pro-forma
-3.0% appreciation · 2.82% rent growth · sell at horizon
- IRR
- 1.0%
- Equity multiple
- 1.04×
- Total profit
- $1,353
- Equity at exit
- $18,638
- IRR
- 10.5%
- Equity multiple
- 1.81×
- Total profit
- $28,332
- Equity at exit
- $10,808
Cash invested: $35,000 (down + closing). Projections, not guarantees.
Landlord ↔ Tenant lean methodology
- Overall (STATE)
- 85 Strongly Landlord-Friendly
- State North Carolina
- 85 Strongly Landlord-Friendly · R+3
- County
- — inherits STATE
- City
- — inherits STATE
ZIP-level market 28311
- Home prices YoY
- -18.4%
- Rents YoY
- 2.8%
- Active inventory
- 360
- Price-to-rent
- 6.6×
Monthly cashflow live
- Estimated rent
- $1,572 high interval (Pro) →
- Mortgage (P&I)
- −$656
- Tax from tax record
- −$192 /mo · $2,300/yr
- Insurance
- −$52
- HOA
- −$0
- Vacancy / Maint / Mgmt
- −$330
- Net cashflow
- $343
Break-even live
UW: 25.0% down · 7.5% · 30yr · 1.5% tax · 5.0% vac · 8.0% maint · 8.0% mgmt
Financing live
Cash to close
- Down payment
- $31,250
- Closing costs
- $3,750
- Reserves months
- —
- Total cash needed
- —
Loan-product check · same deal, 3 products live
Conventional
25% down · 7.5% · 30yr
- Down + closing
- —
- Monthly P&I
- —
- Monthly cashflow
- —
- DSCR
- —
- Eligible?
- —
Personal DTI + credit; lowest rate.
DSCR
20% down · 8.5% · 30yr
- Down + closing
- —
- Monthly P&I
- —
- Monthly cashflow
- —
- DSCR
- —
- Eligible?
- —
No personal income docs; deal must DSCR.
Hard money
10% down · 12.0% · 12mo
- Down + closing
- —
- Monthly P&I
- —
- Monthly cashflow
- —
- DSCR
- —
- Eligible?
- —
Short-term bridge; refi at stabilization.
Rent comps 18 comps
| Address | Beds | Baths | Sqft | Rent | $/sqft | DOM | Units | Dist |
|---|---|---|---|---|---|---|---|---|
| 4310 Coolidge St Fayetteville, NC | 3.0 | 1.5 | 1212 | $1,250 | $1.03 | 13d | 1 | 0.20mi |
| 318 Nugget Ct Fayetteville, NC | 4.0 | 2.0 | 1425 | $1,650 | $1.16 | 13d | 1 | 0.54mi |
| 4736 Rosehill Rd Fayetteville, NC | 3.0 | 2.0 | 1000 | $1,240 | $1.24 | 23d | 1 | 0.66mi |
| 3963 Loufield Dr Fayetteville, NC | 3.0 | 2.0 | 1446 | $1,500 | $1.04 | 23d | 1 | 0.68mi |
| 927 Fiske Dr Fayetteville, NC | 3.0 | 1.0 | 926 | $1,200 | $1.30 | 23d | 1 | 0.69mi |
| 5523 Livingston Dr Fayetteville, NC | 4.0 | 1.5 | 1305 | $1,600 | $1.23 | 23d | 1 | 0.75mi |
| 3613 Pine Lake Dr Fayetteville, NC | 1.0–3.0 | 1.0–2.0 | 1116 | $1,645 | $1.47 | 13d | 31 | 0.82mi |
| 2523 Mulranny Dr Fayetteville, NC | 1.0–3.0 | 1.0–2.0 | 1112 | $1,589 | $1.43 | 13d | 9 | 1.05mi |
| 3523 Rosehill Rd Fayetteville, NC | 4.0 | 1.0 | 1448 | $1,450 | $1.00 | 13d | 1 | 1.19mi |
| 3446 Sandystone Cir Fayetteville, NC | 3.0 | 2.5 | 1489 | $1,700 | $1.14 | 23d | 1 | 1.26mi |
| 2641 McArthur Landing Cir #102 Fayetteville, NC | 3.0 | 2.0 | 1400 | $1,375 | $0.98 | 23d | 1 | 1.29mi |
| 2641 McArthur Landing Cir Fayetteville, NC | 3.0 | 2.0 | 1450 | $1,500 | $1.03 | 23d | 1 | 1.29mi |
| 2641 McArthur Landing Cir Fayetteville, NC | 3.0 | 2.0 | 1450 | $1,400 | $0.97 | 21d | 1 | 1.29mi |
| 2500 McArthur Landing Cir Fayetteville, NC | 2.0–3.0 | 2.0 | 1226 | $1,420 | $1.16 | 13d | 13 | 1.31mi |
| 1404 Hibiscus Rd Fayetteville, NC | 3.0 | 1.5 | 1418 | $1,350 | $0.95 | 21d | 1 | 1.39mi |
| 5327 Chesapeake Rd Fayetteville, NC | 3.0 | 2.0 | 1400 | $1,600 | $1.14 | 13d | 1 | 1.42mi |
| 1350 Shaw Rd Fayetteville, NC | 3.0 | 2.0 | 1339 | $1,399 | $1.04 | 13d | 1 | 1.43mi |
| 5745 Holland St Fayetteville, NC | 3.0 | 1.0 | 1140 | $1,650 | $1.45 | 23d | 1 | 1.47mi |
Listing history 5 events
-
2026-05-12status Pending
-
2026-05-07price $125,000
-
2026-04-20$139,900 Active
-
2026-02-09soldstatus $62,500
-
2011-03-29soldstatus $70,000
ⓘ Source: listings_history table (triggers on properties + properties_extension) + one-shot
backfill from property_details.listing_events for pre-trigger history.
Tax reassessment forecast NC · Resets to sale price
- Current annual tax
- $2,300 · $192/mo
- Projected year-2 tax
- $2,300 · $192/mo
- Expected delta
- $0/yr ($0/mo · 0.0%)
ⓘ Screening estimate from a state-policy table — verify with the county assessor before closing.
Climate risk First Street
- Flood 1/10 Low FEMA zone X (unshaded) · 0% chance over 30 yrs
- Wildfire 5/10 Major
- Heat 7/10 Severe 7 d/yr ≥105°F today · 16 d/yr by 30 yrs out
- Wind 7/10 Severe 78% chance of damaging wind over 30 yrs
- Air quality 2/10 Low 0 unhealthy d/yr today · 1 by 30 yrs out
Nearby sold comps map
Loading sold comps map…
Walkable amenities ~0.75 mi
Loading nearby amenities…
Taxation est. · year 1
- Rental income
- $18,870
- − Mortgage interest
- −$7,002
- − Property taxes
- −$2,300
- − Insurance
- −$625
- − Repairs & maintenance
- −$1,510
- − Management
- −$1,510
- − Depreciation
- −$3,636
- Taxable income
- $2,288
- Est. tax owed @ 24.0%
- −$549
- After-tax cash flow
- $3,567/yr
For passive investors: Depreciation is non-cash, so a rental often shows a tax loss while cash-flowing — sheltering income. Rental losses are passive: they offset passive income freely, and up to $25,000/yr can offset ordinary (W-2) income if you actively participate and your MAGI is under $100k (phasing out to $0 by $150k); unused losses carry forward. On sale, claimed depreciation is recaptured at up to 25%, and gains may owe capital-gains tax (a 1031 exchange can defer both). Figures are a year-1 estimate at your 24.0% rate — not tax advice; consult a CPA.
Schools (NCES district)
- District
- Cumberland County Schools
- NCES district ID
- 3700011
- Math proficiency
- 32% ▼ -2.00%
- Reading proficiency
- 41% ▼ -1.00%
- Median HH income
- $44,168
- Composite
- 31.0/100
- National rank
- #6096
- State rank
- #126 of 178 in NC
Livability — Fayetteville
- Score
- 75/100
- State rank
- #45
- US rank
- #4031
Category grades
Schools grade is shown separately in the Schools card above.
Census & demographics
- Census place
- Fayetteville, NC
- County
- Cumberland County · 265,314 people
- City population
- 226,118
- Metro
- Fayetteville, NC
- Population (ZIP)
- 36,629
- Household income
- $62,170
- Rent vs Own
- Severe rent burden
- 1645.0
Population outlook (Cumberland County) Hauer SSP2
- Today (2025)
- 330,855 people
- By 2030
- 333,523 · +0.8%
- By 2040
- 335,583 · +1.4%
- By 2050
- 335,325 · +1.4%
- By 2075
- 342,853 · +3.6%
- By 2100
- 340,698 · +3.0%
Race, ethnicity, and origin ACS 2023
- Neighborhood character
- Diverse neighborhood (Simpson 0.67)
- Race & ethnicity
- Black 42% White 38% Hispanic / Latino 9% Two or more races 8% Asian 3% Native American 1%
- Hispanic origin (detail)
- Mexican 3% Puerto Rican 4%
- Common ancestry
- Slovak 1% Lithuanian 1% Italian 1%
- Foreign-born
- 7% · Canada, South Korea, Jamaica
- Languages at home
- 89% English-only · Spanish 6% German/W. Germanic 1% Other Indo-European 1%
Political lean MEDSL · Cumberland
- 2024 margin
- D (+13.4) · D 56.1% · R 42.7% · Other 1.2%
- 2008→2024 swing
- -4.3pp toward R · 2008: 17.7pp · 2024: 13.4pp
- All cycles
- 2024: D+13.4 2020: D+16.6 2016: D+16.0 2012: D+19.7 2008: D+17.7
Not yet ingested
- Civics
- —
Market trends
- HPI YoY
- ▼ -45.88%
- Current HPI
- 203.0731
- Rent YoY
- ▲ 2.82%
- Metro
- Fayetteville, NC
- State GDP YoY
- ▲ 3.28%
- F500 in state
- 26
Industry mix (Fortune 500 HQ in NC)
| Industry | F500 HQs | Revenue |
|---|---|---|
| Financial Services | 2 | $213B |
|
||
| Retail | 2 | $95B |
|
||
| Industrial Conglomerate | 1 | $38B |
|
||
| Metals / Steel | 1 | $35B |
|
||
| Utilities | 1 | $30B |
|
||
| Industrial Machinery | 1 | $19B |
|
||
Price history
+78.6% since first listed5 events — show timeline
- 2026-05-12 Pending — LPRMLS
- 2026-05-07 Price Changed $125,000 LPRMLS
- 2026-04-20 Listed $139,900 LPRMLS
- 2026-02-09 Sold (Public Records) $62,500 Public Records
- 2011-03-29 Sold (Public Records) $70,000 Public Records
Property tax history
+6.9%/yrLatest (2025): $2,300 · +52.7% YoY. Source: county tax records.
Cash-flow waterfall
monthlySold comps — $/sqft
last 12 mo · ≤1 miLoading sold comps…