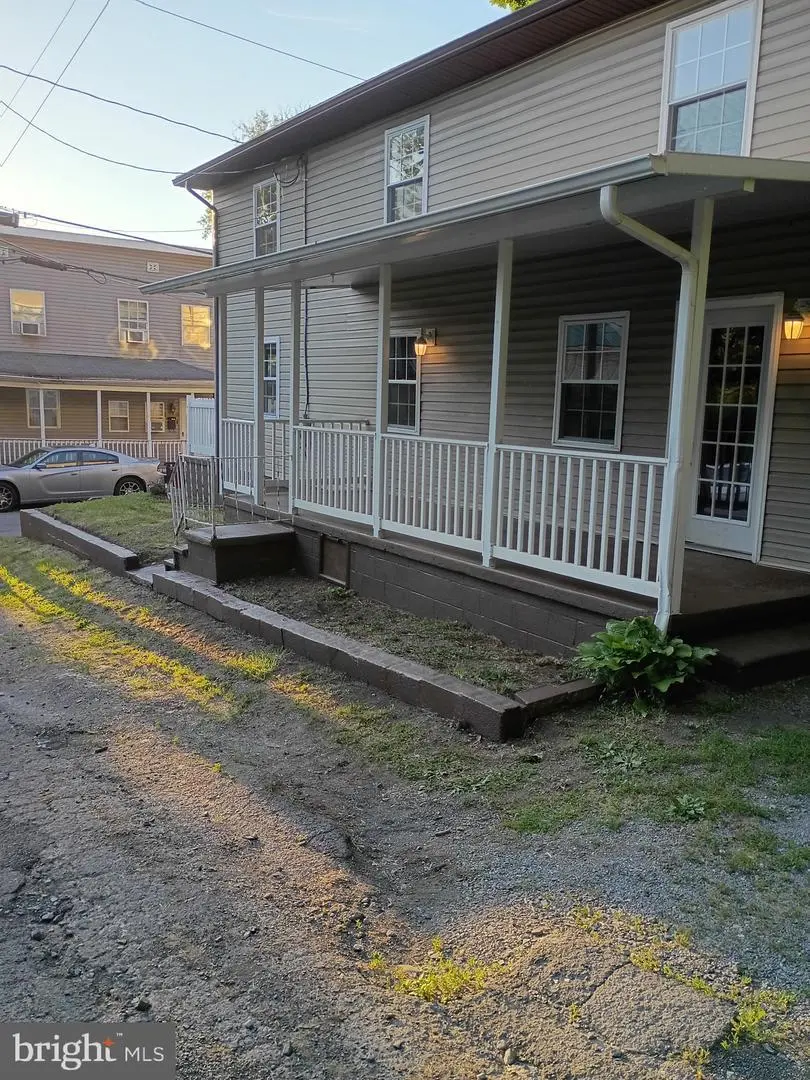
652 Baker St · Cumberland, MD
Flood risk 7/10 · Major
- FEMA flood zone
- X (unshaded)
- Chance of flooding over 30 yrs
- 0.76%
- Est. flood insurance / yr
- $473 – $860
Fire risk 3/10 · Minor
- Est. fire insurance / yr
- $755 – $1,403
Heat risk 5/10 · Moderate
- Hot days now (above 101°F)
- 7 days/yr
- Hot days in 30 yrs
- 17 days/yr
Wind risk 2/10 · Minimal
- Chance of severe wind over 30 yrs
- —
Air-quality risk 2/10 · Minimal
- Unhealthy air days now
- 0 days/yr
- Unhealthy air days in 30 yrs
- 1 days/yr
Risk factors via First Street. Map © Google.
Why this score? — see what drove the D+ grade
The composite is a weighted blend of 9 inputs, each scored 0–100. Each bar is that input's sub-score; the figure is the points it added to the 100-point composite (weight × sub-score).
- Cash flow +17.0/30.0
- ARV discount +7.5/15.0
- DSCR +5.3/10.0
- Rent growth +5.0/5.0
- Livability +3.9/5.0
- 1% rule +3.4/10.0
- Condition / age +2.5/5.0
- Schools +1.9/10.0
- Appreciation +0.0/10.0
$139,000
🖨 Deal sheet (PDF) 📄 Offer letter ✓ Due diligence
Listing remarks
Bright, open living space with warm hardwood floors and natural light. Perfect for families seeking a stylish, move‑in‑ready home that blends comfort, and value. Lead free cert available. Some photos are Virtually Staged" or Digitally Altered Landscape. - see photo description
Key facts
- 2,641 sq ft lot
- Built 1885
- Listed 14 days
Property features AI
Finance
- Financial info: Fee simple ownership; Property condition listed as very good; Property manager present
Exterior
- Parking: Private off-street parking
- Utilities: Public water; Public sewer; Electric service available; Electric hot water
- Home design: Detached structure; Estimated year built
- Construction: Block foundation; Block and vinyl siding construction; Architectural shingle roof; Double-hung, double-pane windows
- Exterior features: Corner lot; Partially fenced; Porch(es)
Interior
- Kitchen: Built-in microwave; Dishwasher; Disposal; Electric oven/range; Refrigerator
- Bedrooms: Three bedrooms on the upper level
- Bathrooms: One full bathroom
- Heating & cooling: Electric baseboard heating; Window cooling units (electric)
- Interior features: Dining area; Kitchen with table space; Upgraded countertops; Living Room; Dining Room; Kitchen
- Laundry & utility: Washer/dryer hookups in basement; Basement laundry hookup
Neighborhood map
What this means for you Summary
Snapshot
- This is a 3-bed/1.0-bath single-family listed at $139k.
Deal economics
- At list price, monthly cash flow is $39 ($470/yr) — positive.
- The deal already cash-flows at list — no discount required.
- To meet the 1% rule (rent ≥ 1% of price), the offer needs to be $116k (16.4% below list).
- Recommended offer: $116k (16.4% below list) — sets the bar for 1% rule.
Location & tenants
- Location reads 78/100 on livability (#64 in MD, #2,385 nationally) — a middle-class / working-renter tenant base. Strengths: amenities A+, commute A+, cost of living A+; Watch: crime F, employment F.
- Allegany County Public Schools (other): math 15% / reading 30% proficiency, ranked #18 of 24 in MD (top 75%) — low school quality limits family demand, transient renter base, plan for 1-2y turnover.
- Zoned schools: John Humbird Elementary (math 12% / reading 17%, grade F, #477 of 860 statewide, top 59%, 234 students, 87% FRL); Washington Middle (math 7% / reading 30%, grade F, #159 of 225 statewide, top 73%, 583 students, 62% FRL); Fort Hill High (math 42% / reading 62%, grade D+, #100 of 222 statewide, top 47%, 692 students, 58% FRL) — zoned schools average 69% FRL vs 47% district-wide (22 pts higher); higher-poverty schools than district average — tighter screening recommended.
- Market conditions: Rents rising fast (+10.9%/yr); 238 active listings in the ZIP; 9 comparable units currently listed for rent nearby; rentals lingering (median 46d on market — plan ~5-8 weeks vacancy on turnover, expect pricing pressure); 100% of comp listings sitting > 30 days — soft ceiling on asking rent; 24 units permitted in Allegany County in 2024 (0 in 5+ unit buildings).
Forward outlook
- Local home prices are declining (-3.0%/yr); year-one equity from $961 of loan paydown is wiped out by about $4k of value loss. Plan a longer hold.
- Allegany County population projected at -14% by 2050 — secular population decline; favor cash flow + early exit over multi-decade hold.
Negotiation context
- It's been on market 15 days — a 2% lower offer ($137k) is reasonable based on typical stale-listing flexibility.
- 3 sale attempts with the ask held roughly flat each time — persistent listings suggest the price (not the market) is what's stuck; bring a comps-based counter.
- Current owner paid $12k; list at $139k implies a 1109% gain — meaningful room to come down on a strong offer.
Risks & watch-outs
- Watch-outs: flood insurance adds $56/mo; built in 1885 — expect roof / HVAC / electrical / plumbing capex.
- Climate carrying-cost: major flood risk; extreme-heat days projected 7→17/yr by 2055 (HVAC capex compounding) — expect insurance premiums to compound above CPI over the hold.
Questions for the listing agent
- Built in 1885 — when were the roof, HVAC, electrical panel, plumbing, and water heater last replaced?
- What's the actual annual flood-insurance premium (NFIP or private), and is the property in a SFHA with mandatory coverage?
- Is there a deadline driving the sale (1031 exchange, divorce, estate, relocation)? That informs how much negotiation room exists.
- Schools are D-rated, which usually means shorter tenancies and higher turnover. Who's the typical renter profile here, and what's been the actual vacancy rate?
- Crime grade is F in this area — have there been break-ins, vandalism, or insurance claims at this property in the last 3 years? What carrier currently insures it and at what premium?
- The area grade is low — what's the realistic commute time and amenity access for the typical tenant pool here? Any planned neighborhood developments (good or bad) we should know about?
- What's the average days-on-market for RENTAL listings here right now (not sales)? A rising rental-DOM trend means longer vacancies and softer asking-rent achievability than the comps imply.
- What's the recent tenant-quality profile in this submarket — average credit score on applications, eviction rate, late-payment / NSF rate, and stable-employment percentage? A property-management company in the area should have these aggregated.
- How much new for-sale + rental construction is in the pipeline within 1–3 miles? Heavy new supply typically softens prices + rents 12–24 months out; constrained supply supports both.
Investment metrics
- 1% rule
- 0.84% ✗
- Cap rate
- 7.11%
- Cash-on-cash
- 2.92%
- DSCR
- 1.13
- GRM
- 10.0
CMA / ARV
- ARV (on-the-fly)
- $86,100
- Comps found
- 12
Show comp detail 12 sales within ~0.75 mi
| Address | Dist | Beds/Ba | Sqft | Sold | Price | $/sf | Match |
|---|---|---|---|---|---|---|---|
| 346 Williams St | 0.07mi | 3/1.0 | 1,092 (-11%) | 4mo | $45,000 | $41 | 75 |
| 880 Maryland Ave | 0.34mi | 2/1.0 (-1) | 1,200 (-2%) | 3mo | $84,500 | $70 | 72 |
| 408 Broadway St | 0.19mi | 3/1.0 | 1,352 (+10%) | 10mo | $85,000 | $63 | 66 |
| 504 Prince George St | 0.38mi | 3/1.5 | 1,152 (-6%) | 6mo | $252,600 | $219 | 64 |
| 6 Race St | 0.53mi | 3/1.0 | 1,280 (+4%) | 5mo | $10,000 | $8 | 64 |
| 408 Prince George St | 0.40mi | 3/1.5 | 1,116 (-9%) | 9mo | $170,000 | $152 | 56 |
| 615 Elwood St | 0.52mi | 2/1.0 (-1) | 1,152 (-6%) | 6mo | $75,000 | $65 | 55 |
| 920 Maryland Ave | 0.39mi | 3/1.0 | 1,408 (+14%) | 7mo | $46,350 | $33 | 52 |
| 129 Race St | 0.71mi | 3/1.0 | 1,330 (+8%) | 2mo | $90,400 | $68 | 52 |
| 618 Brookfield Ave | 0.40mi | 2/2.0 (-1) | 1,352 (+10%) | 9mo | $144,500 | $107 | 48 |
| 533 Fort Ave | 0.73mi | 3/1.0 | 1,368 (+11%) | 4mo | $120,000 | $88 | 44 |
| 604 White Ave | 0.71mi | 2/1.0 (-1) | 1,348 (+10%) | 4mo | $180,000 | $134 | 42 |
Match score weights: distance 35% · size 25% · config 20% · recency 20%. Top-matched comps best support the ARV.
Projected returns pro-forma
-3.0% appreciation · 8.0% rent growth · sell at horizon
- IRR
- -9.4%
- Equity multiple
- 0.64×
- Total profit
- $-13,925
- Equity at exit
- $20,725
- IRR
- 5.4%
- Equity multiple
- 1.49×
- Total profit
- $18,895
- Equity at exit
- $12,018
Cash invested: $38,920 (down + closing). Projections, not guarantees.
Landlord ↔ Tenant lean methodology
- Overall (STATE)
- 27 Tenant-Leaning
- State Maryland
- 27 Tenant-Leaning · D+14
- County
- — inherits STATE
- City
- — inherits STATE
ZIP-level market 21502
- Home prices YoY
- -17.4%
- Rents YoY
- 10.9%
- Active inventory
- 238
- Price-to-rent
- 10.0×
Monthly cashflow live
- Estimated rent
- $1,162 high interval (Pro) →
- Mortgage (P&I)
- −$729
- Tax from tax record
- −$36 /mo · $435/yr
- Insurance
- −$58
- Flood insurance flood zone
- −$56 /mo · $666/yr
- HOA
- −$0
- Vacancy / Maint / Mgmt
- −$244
- Net cashflow
- $39
Break-even live
Sensitivity live
| Price | -10% $118 | -5% $78 | +0% $39 | +5% $0 | +10% $-40 |
|---|---|---|---|---|---|
| Rent | -10% $-53 | -5% $-7 | +0% $39 | +5% $85 | +10% $131 |
| Rate | -1.0pp $109 | -0.5pp $74 | base $39 | +0.5pp $3 | +1.0pp $-34 |
UW: 25.0% down · 7.5% · 30yr · 1.5% tax · 5.0% vac · 8.0% maint · 8.0% mgmt
Financing live
Cash to close
- Down payment
- $34,750
- Closing costs
- $4,170
- Reserves months
- —
- Total cash needed
- —
Loan-product check · same deal, 3 products live
Conventional
25% down · 7.5% · 30yr
- Down + closing
- —
- Monthly P&I
- —
- Monthly cashflow
- —
- DSCR
- —
- Eligible?
- —
Personal DTI + credit; lowest rate.
DSCR
20% down · 8.5% · 30yr
- Down + closing
- —
- Monthly P&I
- —
- Monthly cashflow
- —
- DSCR
- —
- Eligible?
- —
No personal income docs; deal must DSCR.
Hard money
10% down · 12.0% · 12mo
- Down + closing
- —
- Monthly P&I
- —
- Monthly cashflow
- —
- DSCR
- —
- Eligible?
- —
Short-term bridge; refi at stabilization.
Rent comps 9 comps
| Address | Beds | Baths | Sqft | Rent | $/sqft | DOM | Units | Dist |
|---|---|---|---|---|---|---|---|---|
| 201 Spring St Cumberland, MD | 3.0 | 1.0 | 1332 | $950 | $0.71 | 45d | 1 | 0.08mi |
| 131 Grand Ave Cumberland, MD | 3.0 | 2.0 | 1444 | $1,300 | $0.90 | 45d | 1 | 0.74mi |
| 118 Independence St Cumberland, MD | 3.0 | 1.5 | 1260 | $1,250 | $0.99 | 46d | 1 | 0.84mi |
| 415 Grand Ave Cumberland, MD | 3.0 | 1.0 | 1325 | $1,250 | $0.94 | 45d | 1 | 0.94mi |
| 516 Bedford St Cumberland, MD | 3.0 | 1.5 | 1500 | $1,195 | $0.80 | 45d | 1 | 0.97mi |
| 418 N Mechanic St Unit 1B Cumberland, MD | 2.0 | 1.0 | 1000 | $1,195 | $1.20 | 45d | 1 | 1.00mi |
| 418 N Mechanic St Unit 1C Cumberland, MD | 3.0 | 1.0 | 1500 | $1,295 | $0.86 | 45d | 1 | 1.00mi |
| 529 N Centre St Unit Rear Cumberland, MD | 2.0 | 1.0 | 982 | $850 | $0.87 | 45d | 1 | 1.17mi |
| 423 Furnace St Cumberland, MD | 3.0 | 1.5 | 1440 | $1,250 | $0.87 | 45d | 1 | 1.22mi |
Listing history 12 events
-
2026-06-21days on market $139,000 Active 15 DOM
-
2026-06-19days on market $139,000 Active 13 DOM
-
2026-06-18days on market $139,000 Active 12 DOM
-
2026-06-17days on market $139,000 Active 11 DOM
-
2026-06-16days on market $139,000 Active 10 DOM
-
2026-06-15days on market $139,000 Active 9 DOM
-
2026-06-14days on market $139,000 Active 7 DOM
-
2026-06-12days on market $139,000 Active 6 DOM
-
2026-06-09days on market $139,000 Active 3 DOM
-
2026-06-08days on market $139,000 Active 2 DOM
-
2026-06-07remarks 277-char remark
-
2026-06-07$139,000 Active 1 DOM
ⓘ Source: listings_history table (triggers on properties + properties_extension) + one-shot
backfill from property_details.listing_events for pre-trigger history.
Tax reassessment forecast MD · Partial reset (capped growth)
- Current annual tax
- $435 · $36/mo
- Projected year-2 tax
- $975 · $81/mo
- Expected delta
- +$540/yr (+$45/mo · 124.0%)
ⓘ Screening estimate from a state-policy table — verify with the county assessor before closing.
Climate risk First Street
- Flood 7/10 Severe FEMA zone X (unshaded) · 76% chance over 30 yrs
- Wildfire 3/10 Moderate
- Heat 5/10 Major 7 d/yr ≥101°F today · 17 d/yr by 30 yrs out
- Wind 2/10 Low
- Air quality 2/10 Low 0 unhealthy d/yr today · 1 by 30 yrs out
Nearby sold comps map
Loading sold comps map…
Walkable amenities ~0.75 mi
Loading nearby amenities…
Taxation est. · year 1
- Rental income
- $13,941
- − Mortgage interest
- −$7,786
- − Property taxes
- −$435
- − Insurance
- −$1,362
- − Repairs & maintenance
- −$1,115
- − Management
- −$1,115
- − Depreciation
- −$4,044
- Taxable loss
- −$1,916
- Est. tax savings @ 24.0%
- +$460
- After-tax cash flow
- $929/yr
For passive investors: Depreciation is non-cash, so a rental often shows a tax loss while cash-flowing — sheltering income. Rental losses are passive: they offset passive income freely, and up to $25,000/yr can offset ordinary (W-2) income if you actively participate and your MAGI is under $100k (phasing out to $0 by $150k); unused losses carry forward. On sale, claimed depreciation is recaptured at up to 25%, and gains may owe capital-gains tax (a 1031 exchange can defer both). Figures are a year-1 estimate at your 24.0% rate — not tax advice; consult a CPA.
Schools (NCES district)
- District
- Allegany County Public Schools
- NCES district ID
- 2400030
- Math proficiency
- 15% ▼ -26.00%
- Reading proficiency
- 30% ▼ -20.00%
- Median HH income
- $39,760
- Composite
- 18.95/100
- National rank
- #8854
- State rank
- #18 of 24 in MD
Livability — Cumberland
- Score
- 78/100
- State rank
- #64
- US rank
- #2385
Category grades
Schools grade is shown separately in the Schools card above.
Census & demographics
- Census place
- Cumberland, MD
- County
- Allegany County · 41,015 people
- City population
- 41,015
- Metro
- Cumberland, MD-WV
- Population (ZIP)
- 41,015
- Household income
- $60,725
- Rent vs Own
- Severe rent burden
- 824.0
Population outlook (Allegany County) Hauer SSP2
- Today (2025)
- 68,778 people
- By 2030
- 66,766 · -2.9%
- By 2040
- 62,784 · -8.7%
- By 2050
- 59,179 · -14.0%
- By 2075
- 50,732 · -26.2%
- By 2100
- 40,837 · -40.6%
Race, ethnicity, and origin ACS 2023
- Neighborhood character
- Predominantly White (83%)
- Race & ethnicity
- White 83% Black 9% Two or more races 5% Hispanic / Latino 2%
- Common ancestry
- Slovak 3% Romanian 2% Italian 1%
- Foreign-born
- 2% · Canada
- Languages at home
- 96% English-only · Spanish 2%
Political lean MEDSL · Allegany
- 2024 margin
- Solid R (+40.3) · D 28.9% · R 69.2% · Other 2.0%
- 2008→2024 swing
- -14.4pp toward R · 2008: -25.9pp · 2024: -40.3pp
- All cycles
- 2024: R+40.3 2020: R+38.3 2016: R+48.0 2012: R+32.9 2008: R+25.9
Not yet ingested
- Civics
- —
Market trends
- HPI YoY
- ▼ -54.33%
- Current HPI
- 258.6676
- Rent YoY
- ▲ 10.88%
- Metro
- Cumberland, MD-WV
- State GDP YoY
- ▲ 2.97%
- F500 in state
- 12
Industry mix (Fortune 500 HQ in MD)
| Industry | F500 HQs | Revenue |
|---|---|---|
| Aerospace / Defense | 1 | $71B |
|
||
| Utilities | 1 | $25B |
|
||
| Hotels | 1 | $24B |
|
||
| Consumer Goods | 1 | $7B |
|
||
| Real Estate | 1 | $6B |
|
||
| Chemicals | 1 | $2B |
|
||
Price history
+1108.7% since first listed8 events — show timeline
- 2026-06-07 Listed $139,000 BRIGHT MLS
- 2025-12-31 Listing Removed — BRIGHT MLS
- 2025-12-31 Listing Removed — BRIGHT MLS
- 2025-03-25 Price Changed $139,900 BRIGHT MLS
- 2025-03-24 Listed $139,900 BRIGHT MLS
- 2025-02-07 Listed $145,000 BRIGHT MLS
- 2025-02-03 Coming Soon — BRIGHT MLS
- 1986-10-29 Sold (Public Records) $11,500 Public Records
Property tax history
+12.1%/yrLatest (2025): $435 · +7.6% YoY. Source: county tax records.
Cash-flow waterfall
monthlySold comps — $/sqft
last 12 mo · ≤1 miLoading sold comps…