9100 Surveyor Rd · Amarillo, TX
Flood risk No data
- FEMA flood zone
- —
- Chance of flooding over 30 yrs
- —
- Est. flood insurance / yr
- —
Fire risk No data
- Est. fire insurance / yr
- —
Heat risk No data
- Hot days now (above threshold)
- —
- Hot days in 30 yrs
- —
Wind risk No data
- Chance of severe wind over 30 yrs
- —
Air-quality risk No data
- Unhealthy air days now
- —
- Unhealthy air days in 30 yrs
- —
Risk factors via First Street. Map © Google.
Why this score? — see what drove the D grade
The composite is a weighted blend of 9 inputs, each scored 0–100. Each bar is that input's sub-score; the figure is the points it added to the 100-point composite (weight × sub-score).
- Cash flow +13.1/30.0
- ARV discount +7.5/15.0
- Condition / age +4.0/5.0
- DSCR +3.9/10.0
- 1% rule +3.7/10.0
- Schools +3.6/10.0
- Livability +3.3/5.0
- Rent growth +2.5/5.0
- Appreciation +0.0/10.0
$220,350
🖨 Deal sheet (PDF) 📄 Offer letter ✓ Due diligence
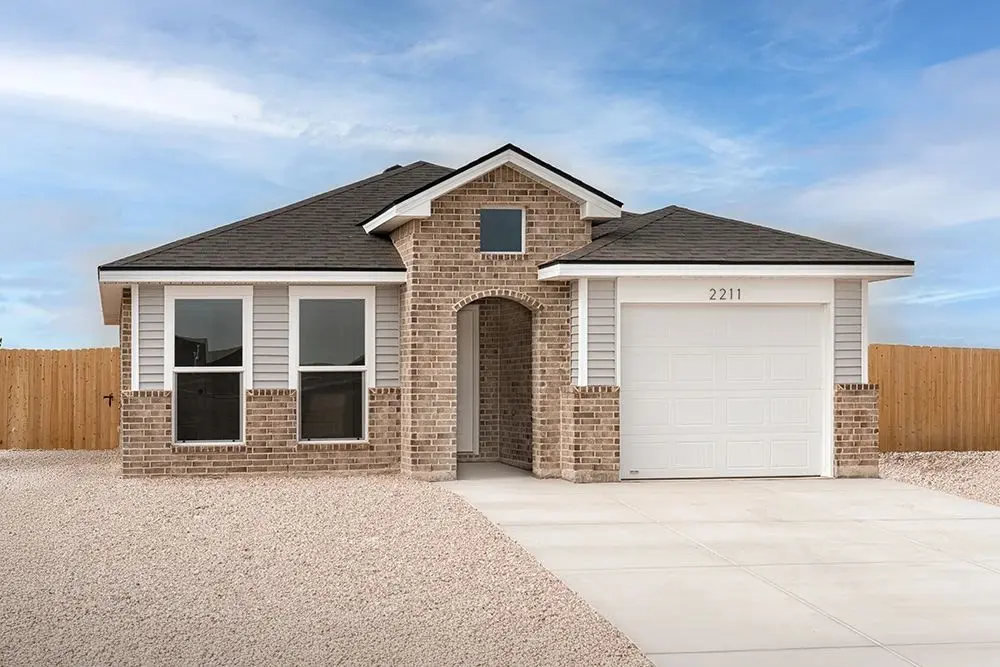
Listing remarks
The 1,100 square-foot Kathleen floor plan is a smart, efficient layout with open living spaces that just make sense. Brick and vinyl exterior with covered entryLuxury vinyl plank flooring in main areasOpen-concept kitchen, living, and dining areaKitchen islandGranite or quartz countertopsStainless steel appliancesPrivate primary suite with walk-in closet
Key facts
- Open living spaces
- Covered entry
- Kitchen island
Tags
Property features AI
Finance
- Other: List price: $220,350; Status: Active
Exterior
- Parking: 1 parking space
- Utilities: Has heating; Has cooling
- Home design: Spec home — Plan name: Kathleen
- Exterior features: Living area approximately 1100
Interior
- Kitchen: Dishwasher; Disposal; Microwave
- Bedrooms: 3 bedrooms
- Bathrooms: 2 full bathrooms
- Heating & cooling: Forced air heating; Central air; Ceiling fan(s)
- Interior features: Dishwasher; Disposal; Microwave
Neighborhood map
What this means for you Summary
Snapshot
- This is a 3-bed/2.0-bath single-family listed at $220k. Condition is rated good.
Deal economics
- At list price, monthly cash flow is $-7 ($-84/yr) — negative.
- To cash-flow at today's rent, offer at most $219k (0.5% below list).
- To meet the 1% rule (rent ≥ 1% of price), the offer needs to be $192k (12.9% below list).
- Recommended offer: $192k (12.9% below list) — sets the bar for 1% rule.
Location & tenants
- Location reads 66/100 on livability (#624 in TX) — a middle-class / working-renter tenant base. Strengths: cost of living A+, housing A+; Watch: amenities C-, crime F, commute F.
- Amarillo ISD (urban): math 44% / reading 41% proficiency, ranked #336 of 826 in TX (top 41%) — families likely to look elsewhere, expect single-tenant / working-renter base with shorter leases.
- Zoned schools: Sleepy Hollow El (math 72% / reading 66%, grade A-, #168 of 4,322 statewide, top 4%, 517 students, 31% FRL); Crockett Middle (math 66% / reading 47%, grade B, #226 of 1,662 statewide, top 14%, 874 students, 44% FRL); Amarillo H S (math 55% / reading 64%, grade C+, #275 of 1,632 statewide, top 19%, 2,170 students, 34% FRL) — zoned schools average 36% FRL vs 58% district-wide (22 pts lower); this property's tenant base skews higher-income than the district average.
- Zoned-school proficiency averages 62% at this address vs 42% district-wide (+19 pts) — the actual schools serving this property are materially stronger than the Amarillo ISD average implies; a family-tenant draw the district grade alone would hide.
- Market conditions: 310 active listings in the ZIP; 3 comparable units currently listed for rent nearby; rentals lingering (median 46d on market — plan ~5-8 weeks vacancy on turnover, expect pricing pressure); 100% of comp listings sitting > 30 days — soft ceiling on asking rent; 1,214 units permitted in Potter County in 2024 (650 in 5+ unit buildings).
Forward outlook
- Local home prices are declining (-3.0%/yr); year-one equity from $2k of loan paydown is wiped out by about $7k of value loss. Plan a longer hold.
Negotiation context
- Only 1 days on market — expect competitive offers; lowballing is unlikely to land.
Questions for the listing agent
- What do current leases actually rent for vs. the listed asking? Can we see a recent rent roll and the last 12 months of T-12 income?
- Is there a deadline driving the sale (1031 exchange, divorce, estate, relocation)? That informs how much negotiation room exists.
- Schools are D-rated, which usually means shorter tenancies and higher turnover. Who's the typical renter profile here, and what's been the actual vacancy rate?
- Crime grade is F in this area — have there been break-ins, vandalism, or insurance claims at this property in the last 3 years? What carrier currently insures it and at what premium?
- The area grade is low — what's the realistic commute time and amenity access for the typical tenant pool here? Any planned neighborhood developments (good or bad) we should know about?
- What's the average days-on-market for RENTAL listings here right now (not sales)? A rising rental-DOM trend means longer vacancies and softer asking-rent achievability than the comps imply.
- What's the recent tenant-quality profile in this submarket — average credit score on applications, eviction rate, late-payment / NSF rate, and stable-employment percentage? A property-management company in the area should have these aggregated.
- How much new for-sale + rental construction is in the pipeline within 1–3 miles? Heavy new supply typically softens prices + rents 12–24 months out; constrained supply supports both.
Investment metrics
- 1% rule
- 0.87% ✗
- Cap rate
- 6.25%
- Cash-on-cash
- -0.14%
- DSCR
- 0.99
- GRM
- 9.6
CMA / ARV
No comps found within radius.
Projected returns pro-forma
-3.0% appreciation · 3.0% rent growth · sell at horizon
- IRR
- -16.5%
- Equity multiple
- 0.41×
- Total profit
- $-36,125
- Equity at exit
- $32,855
- IRR
- -8.3%
- Equity multiple
- 0.48×
- Total profit
- $-31,916
- Equity at exit
- $19,052
Cash invested: $61,698 (down + closing). Projections, not guarantees.
Landlord ↔ Tenant lean methodology
- Overall (STATE)
- 87 Strongly Landlord-Friendly
- State Texas
- 87 Strongly Landlord-Friendly · R+5
- County
- — inherits STATE
- City
- — inherits STATE
ZIP-level market 79124
- Home prices YoY
- -28.7%
- Active inventory
- 310
- Price-to-rent
- 9.6×
Monthly cashflow live
- Estimated rent
- $1,919 medium interval (Pro) →
- Mortgage (P&I)
- −$1,156
- Tax est. 1.5%
- −$275 /mo · $3,305/yr
- Insurance
- −$92
- HOA
- −$0
- Vacancy / Maint / Mgmt
- −$403
- Net cashflow
- $-7
Break-even live
Sensitivity live
| Price | -10% $145 | -5% $69 | +0% $-7 | +5% $-83 | +10% $-159 |
|---|---|---|---|---|---|
| Rent | -10% $-159 | -5% $-83 | +0% $-7 | +5% $69 | +10% $145 |
| Rate | -1.0pp $104 | -0.5pp $49 | base $-7 | +0.5pp $-64 | +1.0pp $-122 |
UW: 25.0% down · 7.5% · 30yr · 1.5% tax · 5.0% vac · 8.0% maint · 8.0% mgmt
Financing live
Cash to close
- Down payment
- $55,088
- Closing costs
- $6,610
- Reserves months
- —
- Total cash needed
- —
Loan-product check · same deal, 3 products live
Conventional
25% down · 7.5% · 30yr
- Down + closing
- —
- Monthly P&I
- —
- Monthly cashflow
- —
- DSCR
- —
- Eligible?
- —
Personal DTI + credit; lowest rate.
DSCR
20% down · 8.5% · 30yr
- Down + closing
- —
- Monthly P&I
- —
- Monthly cashflow
- —
- DSCR
- —
- Eligible?
- —
No personal income docs; deal must DSCR.
Hard money
10% down · 12.0% · 12mo
- Down + closing
- —
- Monthly P&I
- —
- Monthly cashflow
- —
- DSCR
- —
- Eligible?
- —
Short-term bridge; refi at stabilization.
Rent comps 3 comps
| Address | Beds | Baths | Sqft | Rent | $/sqft | DOM | Units | Dist |
|---|---|---|---|---|---|---|---|---|
| 2808 Haystack Way Amarillo, TX | 2.0 | 2.0 | 1010 | $1,850 | $1.83 | 45d | 1 | 0.07mi |
| 8910 Hockley St Amarillo, TX | 2.0 | 2.0 | 1005 | $1,850 | $1.84 | 45d | 1 | 0.07mi |
| 2801 Ranch House Rd Amarillo, TX | 3.0 | 2.0 | 1205 | $2,100 | $1.74 | 45d | 1 | 0.13mi |
Listing history 2 events
-
2026-05-30remarks 356-char remark
-
2026-05-30$220,350 Active 1 DOM
ⓘ Source: listings_history table (triggers on properties + properties_extension) + one-shot
backfill from property_details.listing_events for pre-trigger history.
Nearby sold comps map
Loading sold comps map…
Walkable amenities ~0.75 mi
Loading nearby amenities…
Taxation est. · year 1
- Rental income
- $23,024
- − Mortgage interest
- −$12,343
- − Property taxes
- −$3,305
- − Insurance
- −$1,102
- − Repairs & maintenance
- −$1,842
- − Management
- −$1,842
- − Depreciation
- −$6,410
- Taxable loss
- −$3,820
- Est. tax savings @ 24.0%
- +$917
- After-tax cash flow
- $832/yr
For passive investors: Depreciation is non-cash, so a rental often shows a tax loss while cash-flowing — sheltering income. Rental losses are passive: they offset passive income freely, and up to $25,000/yr can offset ordinary (W-2) income if you actively participate and your MAGI is under $100k (phasing out to $0 by $150k); unused losses carry forward. On sale, claimed depreciation is recaptured at up to 25%, and gains may owe capital-gains tax (a 1031 exchange can defer both). Figures are a year-1 estimate at your 24.0% rate — not tax advice; consult a CPA.
Condition & rehab AI · 13 photos
This home is in excellent condition with a good layout and modern finishes. It is move-in ready and has potential for further value increases with minor updates.
Value-add opportunities
- Both Landscaping — Enhances curb appeal and adds value.
- Both Paint exterior — Improves curb appeal and adds value.
- Both Add smart home features — Enhances convenience and adds value.
- Both Install smart thermostat — Saves energy and adds value.
- Both Add smart lighting — Enhances convenience and adds value.
Renovation cost estimate screening
Value-add ROI direction
- Both Landscaping — Enhances curb appeal and adds value. ↑
- Both Paint exterior — Improves curb appeal and adds value. ↑
- Both Add smart home features — Enhances convenience and adds value. ↑
- Both Install smart thermostat — Saves energy and adds value. ↑
- Both Add smart lighting — Enhances convenience and adds value. ↑
ⓘ Cost ranges are severity-bucket heuristics (US national rule-of-thumb). Get contractor quotes + a written scope before underwriting a rehab budget.
Schools (NCES district)
- District
- Amarillo ISD
- NCES district ID
- 4808130
- Math proficiency
- 44% ▼ -9.00%
- Reading proficiency
- 41% ▼ -3.00%
- Median HH income
- $43,478
- Composite
- 35.96/100
- National rank
- #4798
- State rank
- #336 of 826 in TX
Livability — Amarillo
- Score
- 66/100
- State rank
- #624
- US rank
- #11876
Category grades
Schools grade is shown separately in the Schools card above.
Census & demographics
- Census place
- Amarillo, TX
- City population
- 185,802
- Population (ZIP)
- 11,800
Population outlook (Potter County) Hauer SSP2
- Today (2025)
- 121,296 people
- By 2030
- 120,883 · -0.3%
- By 2040
- 119,668 · -1.3%
- By 2050
- 117,788 · -2.9%
- By 2075
- 110,250 · -9.1%
- By 2100
- 92,923 · -23.4%
Race, ethnicity, and origin ACS 2023
- Neighborhood character
- Predominantly White (81%)
- Race & ethnicity
- White 81% Hispanic / Latino 16% Two or more races 6%
- Hispanic origin (detail)
- Mexican 12% Cuban 1%
- Common ancestry
- Slovak 4% Italian 2% Romanian 2%
- Foreign-born
- 2% · Canada, China
- Languages at home
- 90% English-only · Spanish 8% Vietnamese 1%
Political lean MEDSL · Potter
- 2024 margin
- Solid R (+44.4) · D 27.3% · R 71.7% · Other 1.1%
- 2008→2024 swing
- -5.0pp toward R · 2008: -39.4pp · 2024: -44.4pp
- All cycles
- 2024: R+44.4 2020: R+38.7 2016: R+41.9 2012: R+44.6 2008: R+39.4
Not yet ingested
- Civics
- —
Market trends
- HPI YoY
- ▼ -66.66%
- Current HPI
- 165.6073
- Rent YoY
- —
- Metro
- —
- State GDP YoY
- ▲ 3.95%
- F500 in state
- 110
Industry mix (Fortune 500 HQ in TX)
| Industry | F500 HQs | Revenue |
|---|---|---|
| Energy | 16 | $1,198B |
|
||
| Technology | 5 | $198B |
|
||
| Engineering / Construction | 4 | $72B |
|
||
| Energy Services | 3 | $60B |
|
||
| Utilities | 3 | $41B |
|
||
| Healthcare | 2 | $330B |
|
||
Cash-flow waterfall
monthlySold comps — $/sqft
last 12 mo · ≤1 miLoading sold comps…