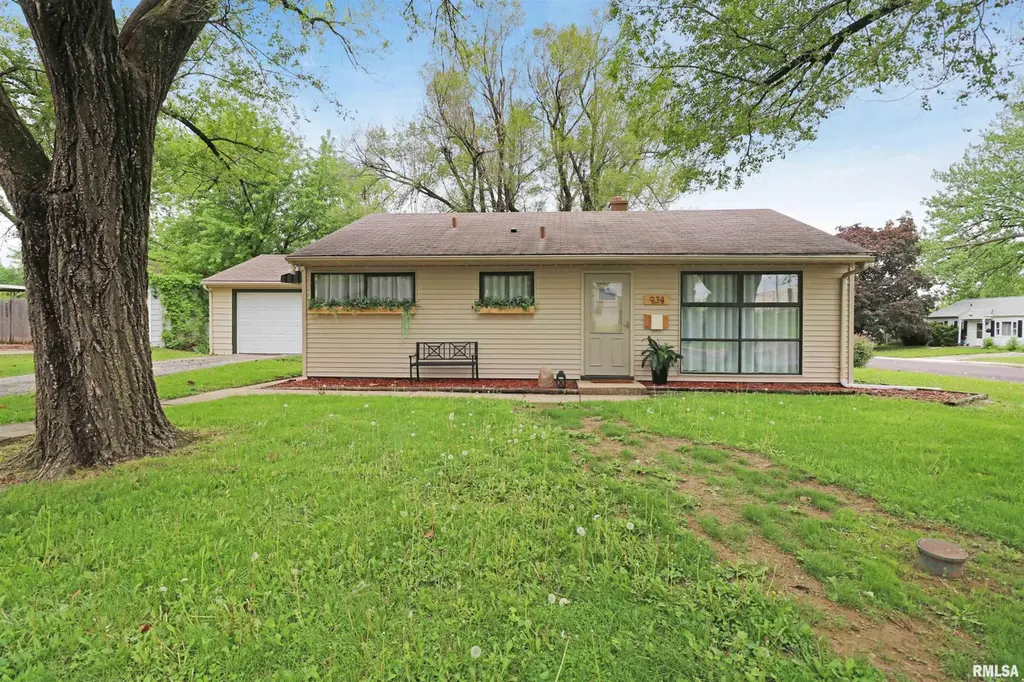
934 W Ridgemont Rd · Peoria, IL
Flood risk 1/10 · Minimal
- FEMA flood zone
- X
- Chance of flooding over 30 yrs
- 0.0%
- Est. flood insurance / yr
- $507 – $1,088
Fire risk 1/10 · Minimal
- Est. fire insurance / yr
- $804 – $1,492
Heat risk 3/10 · Minor
- Hot days now (above 104°F)
- 7 days/yr
- Hot days in 30 yrs
- 18 days/yr
Wind risk 2/10 · Minimal
- Chance of severe wind over 30 yrs
- 1.0%
Air-quality risk 3/10 · Minor
- Unhealthy air days now
- 1 days/yr
- Unhealthy air days in 30 yrs
- 3 days/yr
Risk factors via First Street. Map © Google.
Why this score? — see what drove the D+ grade
The composite is a weighted blend of 9 inputs, each scored 0–100. Each bar is that input's sub-score; the figure is the points it added to the 100-point composite (weight × sub-score).
- Cash flow +20.7/30.0
- DSCR +6.6/10.0
- 1% rule +5.7/10.0
- Rent growth +5.0/5.0
- Livability +3.7/5.0
- ARV discount +3.4/15.0
- Condition / age +2.5/5.0
- Schools +1.1/10.0
- Appreciation +0.0/10.0
$115,000
🖨 Deal sheet (PDF) 📄 Offer letter ✓ Due diligence
Listing remarks
Super cute 3BR/1BA ranch loaded with updates! Kitchen and bath remodel, new flooring, fresh paint, modern fixtures, and more!
Key facts
- 6,300 sq ft lot
- Garage
- Built 1961
Neighborhood map
What this means for you Summary
Snapshot
- This is a 3-bed/1.0-bath single-family listed at $115k.
Deal economics
- At list price, monthly cash flow is $155 ($2k/yr) — positive.
- The deal already cash-flows at list — no discount required.
- Meets the 1% rule at list price ($1k rent vs $115k).
- Cap rate 7.9% vs local median 5.6% in Peoria — top-decile yield for the area; either an underpriced asset or a hidden risk that comps aren't pricing in. Stress-test before assuming the spread holds.
Location & tenants
- Location reads 73/100 on livability (#270 in IL) — a middle-class / working-renter tenant base. Strengths: commute A+, cost of living A+, housing A+; Watch: employment D+, crime F.
- Peoria SD 150 (urban): math 11% / reading 14% proficiency, ranked #554 of 620 in IL (top 89%) — low school quality limits family demand, transient renter base, plan for 1-2y turnover; 70% free/reduced lunch — lower-income household profile, screen leases tightly.
- Zoned schools: Peoria High School (math 4% / reading 7%, grade F, #609 of 693 statewide, top 88%, 1,447 students, 0% FRL) — zoned schools average 0% FRL vs 70% district-wide (70 pts lower); this property's tenant base skews higher-income than the district average.
- Market conditions: Rents rising fast (+10.3%/yr); 150 active listings in the ZIP; 19 comparable units currently listed for rent nearby; rentals at typical pace (median 14d on market — plan ~3-4 weeks tenant-placement turnaround); 73 units permitted in Peoria County in 2024 (0 in 5+ unit buildings).
Forward outlook
- Local home prices are declining (-3.0%/yr); year-one equity from $795 of loan paydown is wiped out by about $3k of value loss. Plan a longer hold.
- Peoria County population projected at -11% by 2050 — secular population decline; favor cash flow + early exit over multi-decade hold.
- At projected returns (-3.0% appreciation + 8.0% rent growth), your $32k cash investment doubles in ~9 years — after that, you're playing with house money.
Negotiation context
- Only 0 days on market — expect competitive offers; lowballing is unlikely to land.
- 2 sale attempts since 8y ago with the ask held roughly flat each time — persistent listings suggest the price (not the market) is what's stuck; bring a comps-based counter.
- Current owner paid $50k; list at $115k implies a 132% gain — meaningful room to come down on a strong offer.
Questions for the listing agent
- Built in 1961 — when were the roof, HVAC, electrical panel, plumbing, and water heater last replaced?
- Is there a deadline driving the sale (1031 exchange, divorce, estate, relocation)? That informs how much negotiation room exists.
- Schools are F-rated, which usually means shorter tenancies and higher turnover. Who's the typical renter profile here, and what's been the actual vacancy rate?
- Crime grade is F in this area — have there been break-ins, vandalism, or insurance claims at this property in the last 3 years? What carrier currently insures it and at what premium?
- The area grade is low — what's the realistic commute time and amenity access for the typical tenant pool here? Any planned neighborhood developments (good or bad) we should know about?
- What's the average days-on-market for RENTAL listings here right now (not sales)? A rising rental-DOM trend means longer vacancies and softer asking-rent achievability than the comps imply.
- What's the recent tenant-quality profile in this submarket — average credit score on applications, eviction rate, late-payment / NSF rate, and stable-employment percentage? A property-management company in the area should have these aggregated.
- How much new for-sale + rental construction is in the pipeline within 1–3 miles? Heavy new supply typically softens prices + rents 12–24 months out; constrained supply supports both.
Investment metrics
- 1% rule
- 1.07% ✓
- Cap rate
- 7.91%
- Cash-on-cash
- 5.79%
- DSCR
- 1.26
- GRM
- 7.8
CMA / ARV
- ARV (on-the-fly)
- $105,408
- Comps found
- 12
Show comp detail 12 sales within ~0.75 mi
| Address | Dist | Beds/Ba | Sqft | Sold | Price | $/sf | Match |
|---|---|---|---|---|---|---|---|
| 934 W Ridgemont Rd | 0.00mi | 3/1.0 | 864 (0%) | 0mo | $115,000 | $133 | 100 |
| 821 W Purtscher Dr | 0.14mi | 3/1.0 | 864 (0%) | 8mo | $100,000 | $116 | 87 |
| 1219 W Purtscher Dr | 0.23mi | 2/1.0 (-1) | 858 (-1%) | 3mo | $65,000 | $76 | 80 |
| 937 W Kenwick Ln | 0.09mi | 2/1.0 (-1) | 900 (+4%) | 7mo | $105,000 | $117 | 78 |
| 905 W Ridgemont Rd | 0.06mi | 2/1.0 (-1) | 775 (-10%) | 11mo | $94,900 | $122 | 66 |
| 716 W Purtscher Dr | 0.23mi | 2/1.0 (-1) | 930 (+8%) | 8mo | $52,500 | $56 | 65 |
| 411 W Knoll Crest Dr | 0.49mi | 3/1.5 | 908 (+5%) | 6mo | $171,000 | $188 | 62 |
| 712 W Northcrest Ave | 0.33mi | 2/1.5 (-1) | 917 (+6%) | 11mo | $170,000 | $185 | 58 |
| 812 W Ridge Rd | 0.24mi | 3/1.0 | 972 (+12%) | 12mo | $133,000 | $137 | 58 |
| 429 W Lakewood Ave | 0.57mi | 2/1.0 (-1) | 928 (+7%) | 5mo | $109,900 | $118 | 52 |
| 4016 N Jacqualine St | 0.32mi | 2/1.0 (-1) | 988 (+14%) | 5mo | $85,000 | $86 | 52 |
| 4733 N Edgebrook Dr | 0.64mi | 2/1.0 (-1) | 960 (+11%) | 11mo | $150,000 | $156 | 37 |
Match score weights: distance 35% · size 25% · config 20% · recency 20%. Top-matched comps best support the ARV.
Projected returns pro-forma
-3.0% appreciation · 8.0% rent growth · sell at horizon
- IRR
- -1.7%
- Equity multiple
- 0.93×
- Total profit
- $-2,226
- Equity at exit
- $17,147
- IRR
- 12.8%
- Equity multiple
- 2.26×
- Total profit
- $40,431
- Equity at exit
- $9,943
Cash invested: $32,200 (down + closing). Projections, not guarantees.
Landlord ↔ Tenant lean methodology
- Overall (STATE)
- 43 Moderately Tenant-Leaning
- State Illinois
- 43 Moderately Tenant-Leaning · D+7
- County
- — inherits STATE
- City
- — inherits STATE
ZIP-level market 61614
- Home prices YoY
- -29.1%
- Rents YoY
- 10.3%
- Active inventory
- 150
- Price-to-rent
- 7.8×
Monthly cashflow live
- Estimated rent
- $1,227 high interval (Pro) →
- Mortgage (P&I)
- −$603
- Tax from tax record
- −$163 /mo · $1,951/yr
- Insurance
- −$48
- HOA
- −$0
- Vacancy / Maint / Mgmt
- −$258
- Net cashflow
- $155
Break-even live
Sensitivity live
| Price | -10% $220 | -5% $188 | +0% $155 | +5% $123 | +10% $90 |
|---|---|---|---|---|---|
| Rent | -10% $58 | -5% $107 | +0% $155 | +5% $204 | +10% $252 |
| Rate | -1.0pp $213 | -0.5pp $185 | base $155 | +0.5pp $126 | +1.0pp $95 |
UW: 25.0% down · 7.5% · 30yr · 1.5% tax · 5.0% vac · 8.0% maint · 8.0% mgmt
Financing live
Cash to close
- Down payment
- $28,750
- Closing costs
- $3,450
- Reserves months
- —
- Total cash needed
- —
Loan-product check · same deal, 3 products live
Conventional
25% down · 7.5% · 30yr
- Down + closing
- —
- Monthly P&I
- —
- Monthly cashflow
- —
- DSCR
- —
- Eligible?
- —
Personal DTI + credit; lowest rate.
DSCR
20% down · 8.5% · 30yr
- Down + closing
- —
- Monthly P&I
- —
- Monthly cashflow
- —
- DSCR
- —
- Eligible?
- —
No personal income docs; deal must DSCR.
Hard money
10% down · 12.0% · 12mo
- Down + closing
- —
- Monthly P&I
- —
- Monthly cashflow
- —
- DSCR
- —
- Eligible?
- —
Short-term bridge; refi at stabilization.
Rent comps 19 comps
| Address | Beds | Baths | Sqft | Rent | $/sqft | DOM | Units | Dist |
|---|---|---|---|---|---|---|---|---|
| 4020 N Bryer Pl Peoria, IL | 2.0 | 1.0 | 720 | $1,250 | $1.74 | 21d | 1 | 0.08mi |
| 811 W Purtscher Dr Peoria, IL | 3.0 | 1.0 | 864 | $1,100 | $1.27 | 44d | 1 | 0.19mi |
| W Crestwood Dr Peoria, IL | 1.0–2.0 | 1.0 | 800 | $975 | $1.22 | 14d | 4 | 0.24mi |
| 751 W Joan Ct Peoria, IL | 2.0 | 2.0 | 1000 | $1,150 | $1.15 | 14d | 1 | 0.51mi |
| 1308 W Covington Ct Peoria, IL | 2.0 | 1.5 | 975 | $1,170 | $1.20 | 21d | 1 | 0.57mi |
| 4010 N Brandywine Dr Peoria, IL | 1.0–2.0 | 1.0–2.0 | 797 | $1,082 | $1.36 | 14d | 17 | 0.61mi |
| 1327 W Covington Ct Peoria, IL | 2.0 | 2.0 | 1025 | $1,295 | $1.26 | 44d | 1 | 0.64mi |
| 126 E Lake Ave Peoria, IL | 2.0 | 1.0 | 950 | $1,050 | $1.11 | 14d | 9 | 0.85mi |
| 3108 N Parish Ave Peoria, IL | 3.0 | 1.5 | 967 | $1,750 | $1.81 | 44d | 1 | 0.87mi |
| 4809 Knoxville Ave Unit 4819 4B, 5A, & 5B Peoria, IL | 3.0 | 2.0 | 700 | $1,800 | $2.57 | 14d | 1 | 0.88mi |
| 249 E Oak Cliff Ct Unit 4 Peoria, IL | 2.0 | 1.0 | 600 | $800 | $1.33 | 14d | 1 | 0.94mi |
| 228 E Oak Cliff Ct Unit A2 Peoria, IL | 2.0 | 1.0 | 1000 | $1,050 | $1.05 | 14d | 1 | 0.95mi |
| 3629 N Leroy Ave Unit A Peoria, IL | 2.0 | 1.0 | 1000 | $1,150 | $1.15 | 44d | 1 | 1.10mi |
| 4914 N Best St Peoria Heights, IL | 2.0 | 1.0 | 720 | $1,200 | $1.67 | 44d | 1 | 1.35mi |
| 811 E Lake Ave Peoria Heights, IL | 2.0 | 1.0 | 576 | $875 | $1.52 | 14d | 1 | 1.43mi |
| 2805 W Larchmont Ln Peoria, IL | 1.0–2.0 | 1.0 | 695 | $1,060 | $1.53 | 14d | 3 | 1.43mi |
| 5106 N Glen Elm Dr Peoria Heights, IL | 2.0 | 1.0 | 1008 | $2,400 | $2.38 | 14d | 1 | 1.43mi |
| 813 E Sciota Ave Peoria Heights, IL | 2.0 | 2.0 | 800 | $1,400 | $1.75 | 14d | 1 | 1.45mi |
| 812 W Macqueen Ave Peoria, IL | 2.0 | 1.0 | 822 | $795 | $0.97 | 44d | 1 | 1.48mi |
Listing history 14 events
-
2026-05-08historical
-
2026-05-06$115,000
-
2021-08-06historical
-
2021-08-06historical
-
2021-08-06historical
-
2021-08-06historical
-
2021-08-06historical
-
2021-08-06historical
-
2021-08-06historical
-
2018-09-18soldstatus $49,500
-
2018-09-14soldstatus $49,500
-
2018-05-14$53,500
-
2017-09-12soldstatus $53,000
-
2014-11-11historical
ⓘ Source: listings_history table (triggers on properties + properties_extension) + one-shot
backfill from property_details.listing_events for pre-trigger history.
Tax reassessment forecast IL · Partial reset (capped growth)
- Current annual tax
- $1,951 · $163/mo
- Projected year-2 tax
- $2,281 · $190/mo
- Expected delta
- +$330/yr (+$27/mo · 16.9%)
ⓘ Screening estimate from a state-policy table — verify with the county assessor before closing.
Climate risk First Street
- Flood 1/10 Low FEMA zone X · 0% chance over 30 yrs
- Wildfire 1/10 Low
- Heat 3/10 Moderate 7 d/yr ≥104°F today · 18 d/yr by 30 yrs out
- Wind 2/10 Low 100% chance of damaging wind over 30 yrs
- Air quality 3/10 Moderate 1 unhealthy d/yr today · 3 by 30 yrs out
Nearby sold comps map
Loading sold comps map…
Walkable amenities ~0.75 mi
Loading nearby amenities…
Taxation est. · year 1
- Rental income
- $14,719
- − Mortgage interest
- −$6,442
- − Property taxes
- −$1,951
- − Insurance
- −$575
- − Repairs & maintenance
- −$1,177
- − Management
- −$1,177
- − Depreciation
- −$3,345
- Taxable income
- $50
- Est. tax owed @ 24.0%
- −$12
- After-tax cash flow
- $1,853/yr
For passive investors: Depreciation is non-cash, so a rental often shows a tax loss while cash-flowing — sheltering income. Rental losses are passive: they offset passive income freely, and up to $25,000/yr can offset ordinary (W-2) income if you actively participate and your MAGI is under $100k (phasing out to $0 by $150k); unused losses carry forward. On sale, claimed depreciation is recaptured at up to 25%, and gains may owe capital-gains tax (a 1031 exchange can defer both). Figures are a year-1 estimate at your 24.0% rate — not tax advice; consult a CPA.
Schools (NCES district)
- District
- Peoria SD 150
- NCES district ID
- 1731230
- Math proficiency
- 11% ▼ -5.00%
- Reading proficiency
- 14% ▼ -4.00%
- Median HH income
- $41,951
- Composite
- 10.92/100
- National rank
- #9751
- State rank
- #554 of 620 in IL
Livability — Peoria
- Score
- 73/100
- State rank
- #270
- US rank
- #5096
Category grades
Schools grade is shown separately in the Schools card above.
Census & demographics
- Census place
- Peoria, IL
- County
- Peoria County · 120,495 people
- City population
- 114,670
- Metro
- Peoria, IL
- Population (ZIP)
- 27,370
- Household income
- $66,924
- Rent vs Own
- Severe rent burden
- 1179.0
Population outlook (Peoria County) Hauer SSP2
- Today (2025)
- 183,007 people
- By 2030
- 179,643 · -1.8%
- By 2040
- 171,782 · -6.1%
- By 2050
- 163,508 · -10.7%
- By 2075
- 140,178 · -23.4%
- By 2100
- 114,493 · -37.4%
Race, ethnicity, and origin ACS 2023
- Neighborhood character
- Predominantly White (70%)
- Race & ethnicity
- White 70% Black 17% Two or more races 5% Asian 5% Hispanic / Latino 5%
- Common ancestry
- Romanian 2% Lithuanian 2% Italian 2%
- Foreign-born
- 9% · Canada, South Korea, China
- Languages at home
- 92% English-only · Spanish 2% Other Asian/Pacific 2% Other Indo-European 1%
Political lean MEDSL · Peoria
- 2024 margin
- Toss-up / Even · D 51.5% · R 46.9% · Other 1.6%
- 2008→2024 swing
- -9.2pp toward R · 2008: 13.9pp · 2024: 4.7pp
- All cycles
- 2024: D+4.7 2020: D+6.3 2016: D+2.8 2012: D+4.4 2008: D+13.9
Not yet ingested
- Civics
- —
Market trends
- HPI YoY
- ▼ -76.07%
- Current HPI
- 185.122
- Rent YoY
- ▲ 10.35%
- Metro
- Peoria, IL
- State GDP YoY
- ▲ 1.59%
- F500 in state
- 60
Industry mix (Fortune 500 HQ in IL)
| Industry | F500 HQs | Revenue |
|---|---|---|
| Insurance | 4 | $201B |
|
||
| Consumer Goods | 4 | $87B |
|
||
| Industrial Machinery | 3 | $64B |
|
||
| Healthcare | 2 | $55B |
|
||
| Retail / Pharmacy | 1 | $148B |
|
||
| Agriculture / Food | 1 | $86B |
|
||
Price history
+117.0% since first listed14 events — show timeline
- 2026-05-08 Listing Removed — RMLSA as Distributed by MLS Grid
- 2026-05-06 Listed $115,000 RMLSA as Distributed by MLS Grid
- 2021-08-06 Listing Removed — RMLSA as Distributed by MLS Grid
- 2021-08-06 Listing Removed — RMLSA as Distributed by MLS Grid
- 2021-08-06 Listing Removed — RMLSA as Distributed by MLS Grid
- 2021-08-06 Listing Removed — RMLSA as Distributed by MLS Grid
- 2021-08-06 Listing Removed — RMLSA as Distributed by MLS Grid
- 2021-08-06 Listing Removed — RMLSA as Distributed by MLS Grid
- 2021-08-06 Listing Removed — RMLSA as Distributed by MLS Grid
- 2018-09-18 Sold (Public Records) $49,500 Public Records
- 2018-09-14 Sold (MLS) $49,500 RMLSA as Distributed by MLS Grid
- 2018-05-14 Listed $53,500 RMLSA as Distributed by MLS Grid
- 2017-09-12 Sold (Public Records) $53,000 Public Records
- 2014-11-11 Listing Removed — RMLSA as Distributed by MLS Grid
Property tax history
-0.7%/yrLatest (2024): $1,951 · +4.8% YoY. Source: county tax records.
Cash-flow waterfall
monthlySold comps — $/sqft
last 12 mo · ≤1 miLoading sold comps…