2600 Lost River Rd · Mobile, AL
Flood risk 8/10 · Major
- FEMA flood zone
- X (shaded)
- Chance of flooding over 30 yrs
- 0.97%
- Est. flood insurance / yr
- $507 – $1,088
Fire risk 3/10 · Minor
- Est. fire insurance / yr
- $916 – $1,700
Heat risk 9/10 · Severe
- Hot days now (above 105°F)
- 7 days/yr
- Hot days in 30 yrs
- 22 days/yr
Wind risk 9/10 · Severe
- Chance of severe wind over 30 yrs
- 99.0%
Air-quality risk 2/10 · Minimal
- Unhealthy air days now
- 1 days/yr
- Unhealthy air days in 30 yrs
- 1 days/yr
Risk factors via First Street. Map © Google.
Why this score? — see what drove the C- grade
The composite is a weighted blend of 9 inputs, each scored 0–100. Each bar is that input's sub-score; the figure is the points it added to the 100-point composite (weight × sub-score).
- Cash flow +19.8/30.0
- ARV discount +7.5/15.0
- DSCR +6.3/10.0
- Rent growth +4.6/5.0
- 1% rule +3.9/10.0
- Livability +3.8/5.0
- Condition / age +2.5/5.0
- Schools +2.3/10.0
- Appreciation +0.0/10.0
$165,000
🖨 Deal sheet 📄 Offer letter ✓ Due diligence
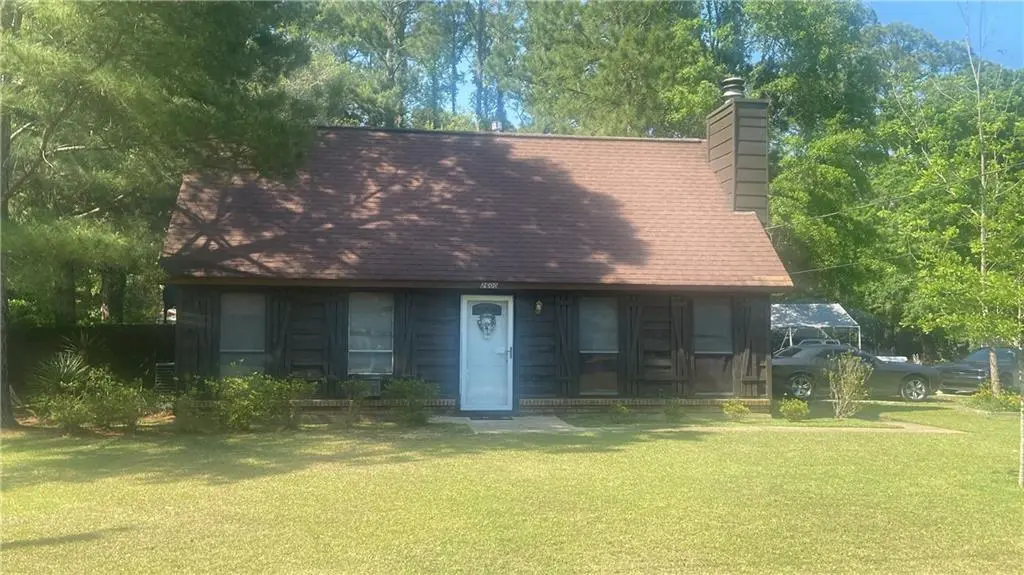
Listing remarks
This beautiful corner lot home is ready for its new owner. From the moment you arrive, you will notice the strong curb appeal, spacious lot, and welcoming feel this home offers. The home sits nicely on the corner, giving it a great presence and plenty of space to enjoy. Inside, you are welcomed by a large living room and family room that give you plenty of room to relax, entertain, and make memories. Whether you are hosting guests, enjoying a quiet night in, or spending time with family, this home gives you the space to do it comfortably. The cozy kitchen is easy to maintain and keeps daily life simple, while still giving you a great place to prepare meals and stay connected with the rest o
Key facts
- 0.32 acre lot
- Built 1980
- Listed 28 days
Property features AI
Finance
- Other: Located in the Piele subdivision; Address: 2600 Lost River Rd, Mobile AL 36605; Directions available from I-10 via Dauphin Island Pkwy to Lost River Rd
Exterior
- Parking: No parking
- Security: No accessibility or special security features listed
- Utilities: Electricity available; Public sewer
- Home design: Single family residence; Residential property
- Construction: Wood siding exterior; Ridge vents on roof; Built in 1980; No foundation details specified; No other structures noted
- Exterior features: No exterior features specified; Fenced yard; Property has a view; No waterfront
Interior
- Kitchen: No kitchen features specified; Appliances listed as Other
- Bedrooms: 3 bedrooms
- Flooring: Carpet flooring
- Bathrooms: 2 full bathrooms
- Heating & cooling: Natural gas heating; No cooling system
- Interior features: Other interior features; No fireplace; Basement not present
- Laundry & utility: No specific laundry or utility appliances listed
Neighborhood map
What this means for you Summary
Snapshot
- This is a 3-bed/2.0-bath single-family listed at $165k.
Deal economics
- At list price, monthly cash flow is $130 ($2k/yr) — positive.
- The deal already cash-flows at list — no discount required.
- To meet the 1% rule (rent ≥ 1% of price), the offer needs to be $148k (10.6% below list).
- Recommended offer: $148k (10.6% below list) — sets the bar for 1% rule.
- Cap rate 7.7% vs local median 4.9% in Mobile — top-decile yield for the area; either an underpriced asset or a hidden risk that comps aren't pricing in. Stress-test before assuming the spread holds.
Location & tenants
- Location reads 75/100 on livability (#20 in AL, #4,262 nationally) — a middle-class / working-renter tenant base. Strengths: commute A+, cost of living A+, housing A+; Watch: crime F, employment D-.
- Mobile County (urban): math 15% / reading 39% proficiency, ranked #81 of 129 in AL (top 63%) — low school quality limits family demand, transient renter base, plan for 1-2y turnover; 67% free/reduced lunch — lower-income household profile, screen leases tightly.
- Zoned schools: Murphy High School (math 10% / reading 19%, grade F, #220 of 305 statewide, top 77%, 1,254 students, 66% FRL) — zoned schools at 66% FRL track the district average.
- Zoned-school proficiency averages 14% at this address vs 27% district-wide (-12 pts) — the specific schools serving this property underperform the Mobile County average; the district grade overstates school quality for this exact location.
- Market conditions: Rents rising fast (+8.3%/yr); 139 active listings in the ZIP; 3 comparable units currently listed for rent nearby; rentals lingering (median 44d on market — plan ~5-8 weeks vacancy on turnover, expect pricing pressure); 100% of comp listings sitting > 30 days — soft ceiling on asking rent; lower-income renter base — watch delinquency; 1,678 units permitted in Mobile County in 2024 (264 in 5+ unit buildings).
Forward outlook
- Local home prices are declining (-3.0%/yr); year-one equity from $1k of loan paydown is wiped out by about $5k of value loss. Plan a longer hold.
- Mobile County population projected to shrink 8% by 2050 — rents likely to lag national; underwrite the cash flow, not the appreciation.
- At projected returns (-3.0% appreciation + 8.0% rent growth), your $46k cash investment doubles in ~10 years — after that, you're playing with house money.
Negotiation context
- It's been on market 28 days — a 2% lower offer ($163k) is reasonable based on typical stale-listing flexibility.
- Current owner paid $98k; list at $165k implies a 69% gain — meaningful room to come down on a strong offer.
Risks & watch-outs
- Watch-outs: flood insurance adds $66/mo.
- Climate carrying-cost: severe flood risk; severe wind risk, 99% chance of damaging wind over 30y; extreme-heat days projected 7→22/yr by 2055 (HVAC capex compounding) — expect insurance premiums to compound above CPI over the hold.
Questions for the listing agent
- What's the actual annual flood-insurance premium (NFIP or private), and is the property in a SFHA with mandatory coverage?
- Is there a deadline driving the sale (1031 exchange, divorce, estate, relocation)? That informs how much negotiation room exists.
- Schools are D-rated, which usually means shorter tenancies and higher turnover. Who's the typical renter profile here, and what's been the actual vacancy rate?
- Crime grade is F in this area — have there been break-ins, vandalism, or insurance claims at this property in the last 3 years? What carrier currently insures it and at what premium?
- What's the average days-on-market for RENTAL listings here right now (not sales)? A rising rental-DOM trend means longer vacancies and softer asking-rent achievability than the comps imply.
- What's the recent tenant-quality profile in this submarket — average credit score on applications, eviction rate, late-payment / NSF rate, and stable-employment percentage? A property-management company in the area should have these aggregated.
- How much new for-sale + rental construction is in the pipeline within 1–3 miles? Heavy new supply typically softens prices + rents 12–24 months out; constrained supply supports both.
Investment metrics
- 1% rule
- 0.89% ✗
- Cap rate
- 7.72%
- Cash-on-cash
- 5.11%
- DSCR
- 1.23
- GRM
- 9.3
CMA / ARV
- ARV (median comp)
- $109,284
- List price
- $165,000
- Delta
- 50.98%
- Verdict
- OVERPRICED
- Comps
- 20 within 1.0 mi
Show comp detail 10 sales within ~0.75 mi
| Address | Dist | Beds/Ba | Sqft | Sold | Price | $/sf | Match |
|---|---|---|---|---|---|---|---|
| 3820 Inerarity Rd | 0.21mi | 3/2.0 | 1,232 (+1%) | 9mo | $141,000 | $114 | 82 |
| 2416 Lost River Rd | 0.20mi | 3/1.5 | 1,125 (-8%) | 5mo | $115,000 | $102 | 72 |
| 3005 Club House Rd | 0.49mi | 3/1.5 | 1,222 (+0%) | 10mo | $170,000 | $139 | 67 |
| 3828 MCGRUE Ln | 0.42mi | 3/2.0 | 1,232 (+1%) | 19mo | $150,000 | $122 | 63 |
| 3420 Fairfield Rd | 0.48mi | 3/2.0 | 1,285 (+5%) | 23mo | $132,625 | $103 | 50 |
| 2511 Club House Rd | 0.63mi | 3/1.5 | 1,092 (-10%) | 3mo | $140,000 | $128 | 48 |
| 2665 Club House Rd | 0.48mi | 3/1.0 | 1,104 (-10%) | 18mo | $33,000 | $30 | 43 |
| 2855 Gill Rd | 0.70mi | 3/1.0 | 1,089 (-11%) | 5mo | $24,500 | $22 | 42 |
| 2754 Club House Rd | 0.49mi | 2/1.0 (-1) | 1,092 (-10%) | 21mo | $30,000 | $27 | 33 |
| 3916 Del Monte Ct | 0.65mi | 2/2.0 (-1) | 1,044 (-14%) | 19mo | $93,000 | $89 | 25 |
Match score weights: distance 35% · size 25% · config 20% · recency 20%. Top-matched comps best support the ARV.
Projected returns pro-forma
-3.0% appreciation · 8.0% rent growth · sell at horizon
- IRR
- -6.0%
- Equity multiple
- 0.77×
- Total profit
- $-10,689
- Equity at exit
- $24,602
- IRR
- 8.6%
- Equity multiple
- 1.79×
- Total profit
- $36,696
- Equity at exit
- $14,266
Cash invested: $46,200 (down + closing). Projections, not guarantees.
Landlord ↔ Tenant lean methodology
- Overall (STATE)
- 90 Strongly Landlord-Friendly
- State Alabama
- 90 Strongly Landlord-Friendly · R+15
- County
- — inherits STATE
- City
- — inherits STATE
ZIP-level market 36605
- Rents YoY
- 8.3%
- Active inventory
- 139
- Price-to-rent
- 9.3×
Monthly cashflow live
- Estimated rent
- $1,476 medium interval (Pro) →
- Mortgage (P&I)
- −$865
- Tax from tax record
- −$35 /mo · $423/yr
- Insurance
- −$69
- Flood insurance flood zone
- −$66 /mo · $798/yr
- HOA
- −$0
- Vacancy / Maint / Mgmt
- −$310
- Net cashflow
- $130
Break-even live
UW: 25.0% down · 7.5% · 30yr · 1.5% tax · 5.0% vac · 8.0% maint · 8.0% mgmt
Financing live
Cash to close
- Down payment
- $41,250
- Closing costs
- $4,950
- Reserves months
- —
- Total cash needed
- —
Loan-product check · same deal, 3 products live
Conventional
25% down · 7.5% · 30yr
- Down + closing
- —
- Monthly P&I
- —
- Monthly cashflow
- —
- DSCR
- —
- Eligible?
- —
Personal DTI + credit; lowest rate.
DSCR
20% down · 8.5% · 30yr
- Down + closing
- —
- Monthly P&I
- —
- Monthly cashflow
- —
- DSCR
- —
- Eligible?
- —
No personal income docs; deal must DSCR.
Hard money
10% down · 12.0% · 12mo
- Down + closing
- —
- Monthly P&I
- —
- Monthly cashflow
- —
- DSCR
- —
- Eligible?
- —
Short-term bridge; refi at stabilization.
Rent comps 3 comps
| Address | Beds | Baths | Sqft | Rent | $/sqft | DOM | Units | Dist |
|---|---|---|---|---|---|---|---|---|
| 2897 Arc Rd Mobile, AL | 4.0 | 2.0 | 1200 | $1,550 | $1.29 | 44d | 1 | 0.15mi |
| 3922 Wiggins Dr Mobile, AL | 2.0 | 1.0 | 720 | $1,000 | $1.39 | 44d | 1 | 0.49mi |
| 3311 Alba Club Rd Mobile, AL | 3.0 | 1.0 | 1200 | $1,200 | $1.00 | 44d | 1 | 0.81mi |
Listing history 17 events
-
2026-06-15status $165,000 Pending 28 DOM
-
2026-06-15days on market $165,000 Active 28 DOM
-
2026-06-14days on market $165,000 Active 26 DOM
-
2026-06-13days on market $165,000 Active 25 DOM
-
2026-06-10days on market $165,000 Active 23 DOM
-
2026-06-09days on market $165,000 Active 22 DOM
-
2026-06-08days on market $165,000 Active 21 DOM
-
2026-06-07days on market $165,000 Active 20 DOM
-
2026-06-05days on market $165,000 Active 17 DOM
-
2026-06-03days on market $165,000 Active 16 DOM
-
2026-06-02days on market $165,000 Active 15 DOM
-
2026-06-01days on market $165,000 Active 14 DOM
-
2026-05-31days on market $165,000 Active 13 DOM
-
2026-05-30days on market $165,000 Active 12 DOM
-
2026-05-18$165,000 Active 1334-char remark
-
2026-04-24historical $165,000 1334-char remark
-
2007-07-09soldstatus $97,845
ⓘ Source: listings_history table (triggers on properties + properties_extension) + one-shot
backfill from property_details.listing_events for pre-trigger history.
Tax reassessment forecast AL · Resets to sale price
- Current annual tax
- $423 · $35/mo
- Projected year-2 tax
- $677 · $56/mo
- Expected delta
- +$254/yr (+$21/mo · 59.9%)
ⓘ Screening estimate from a state-policy table — verify with the county assessor before closing.
Climate risk First Street
- Flood 8/10 Severe FEMA zone X (shaded) · 97% chance over 30 yrs
- Wildfire 3/10 Moderate
- Heat 9/10 Extreme 7 d/yr ≥105°F today · 22 d/yr by 30 yrs out
- Wind 9/10 Extreme 99% chance of damaging wind over 30 yrs
- Air quality 2/10 Low 1 unhealthy d/yr today · 1 by 30 yrs out
Nearby sold comps map
Loading sold comps map…
Walkable amenities ~0.75 mi
Loading nearby amenities…
Taxation est. · year 1
- Rental income
- $17,710
- − Mortgage interest
- −$9,243
- − Property taxes
- −$423
- − Insurance
- −$1,622
- − Repairs & maintenance
- −$1,417
- − Management
- −$1,417
- − Depreciation
- −$4,800
- Taxable loss
- −$1,212
- Est. tax savings @ 24.0%
- +$291
- After-tax cash flow
- $1,853/yr
For passive investors: Depreciation is non-cash, so a rental often shows a tax loss while cash-flowing — sheltering income. Rental losses are passive: they offset passive income freely, and up to $25,000/yr can offset ordinary (W-2) income if you actively participate and your MAGI is under $100k (phasing out to $0 by $150k); unused losses carry forward. On sale, claimed depreciation is recaptured at up to 25%, and gains may owe capital-gains tax (a 1031 exchange can defer both). Figures are a year-1 estimate at your 24.0% rate — not tax advice; consult a CPA.
Schools (NCES district)
- District
- Mobile County
- NCES district ID
- 0102370
- Math proficiency
- 15% ▼ -28.00%
- Reading proficiency
- 39% ▬ 0.00%
- Median HH income
- $42,455
- Composite
- 22.9/100
- National rank
- #8002
- State rank
- #81 of 129 in AL
Livability — Mobile
- Score
- 75/100
- State rank
- #20
- US rank
- #4262
Category grades
Schools grade is shown separately in the Schools card above.
Census & demographics
- Census place
- Mobile, AL
- County
- Mobile County · 246,577 people
- City population
- 205,729
- Metro
- Mobile, AL
- Population (ZIP)
- 25,104
- Household income
- $43,538
- Rent vs Own
- Severe rent burden
- 1521.0
Population outlook (Mobile County) Hauer SSP2
- Today (2025)
- 415,303 people
- By 2030
- 411,755 · -0.9%
- By 2040
- 399,670 · -3.8%
- By 2050
- 382,616 · -7.9%
- By 2075
- 337,353 · -18.8%
- By 2100
- 283,391 · -31.8%
Race, ethnicity, and origin ACS 2023
- Neighborhood character
- Predominantly Black (67%)
- Race & ethnicity
- Black 67% White 27% Two or more races 4% Hispanic / Latino 3%
- Common ancestry
- Lithuanian 3% Slovak 2% Iranian 1%
- Foreign-born
- 3% · Canada
- Languages at home
- 97% English-only · Spanish 2%
Political lean MEDSL · Mobile
- 2024 margin
- R (+16.4) · D 41.3% · R 57.7%
- 2008→2024 swing
- -7.7pp toward R · 2008: -8.7pp · 2024: -16.4pp
- All cycles
- 2024: R+16.4 2020: R+11.9 2016: R+13.9 2012: R+9.3 2008: R+8.7
Not yet ingested
- Civics
- —
Market trends
- HPI YoY
- ▼ -96.46%
- Current HPI
- 125.9526
- Rent YoY
- ▲ 8.26%
- Metro
- Mobile, AL
- State GDP YoY
- ▲ 2.94%
- F500 in state
- 4
Industry mix (Fortune 500 HQ in AL)
| Industry | F500 HQs | Revenue |
|---|---|---|
| Financial Services | 1 | $8B |
|
||
| Healthcare | 1 | $5B |
|
||
Price history
+68.6% since first listed4 events — show timeline
- 2026-06-15 Pending — GCMLS AL
- 2026-05-18 Listed $165,000 GCMLS AL
- 2026-04-24 Coming Soon $165,000 GCMLS AL
- 2007-07-09 Sold (Public Records) $97,845 Public Records
Property tax history
-0.2%/yrLatest (2025): $423 · -1.2% YoY. Source: county tax records.
Cash-flow waterfall
monthlySold comps — $/sqft
last 12 mo · ≤1 miLoading sold comps…