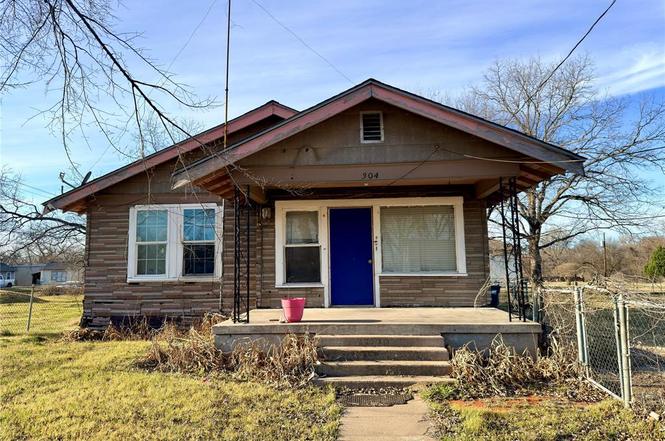
304 E 1st Ave · Corsicana, TX
Flood risk 1/10 · Minimal
- FEMA flood zone
- X (unshaded)
- Chance of flooding over 30 yrs
- 0.0%
- Est. flood insurance / yr
- $507 – $1,088
Fire risk 5/10 · Moderate
- Est. fire insurance / yr
- $1,222 – $2,270
Heat risk 7/10 · Major
- Hot days now (above 109°F)
- 7 days/yr
- Hot days in 30 yrs
- 26 days/yr
Wind risk 6/10 · Moderate
- Chance of severe wind over 30 yrs
- 58.0%
Air-quality risk 2/10 · Minimal
- Unhealthy air days now
- 0 days/yr
- Unhealthy air days in 30 yrs
- 1 days/yr
Risk factors via First Street. Map © Google.
Why this score? — see what drove the B- grade
The composite is a weighted blend of 9 inputs, each scored 0–100. Each bar is that input's sub-score; the figure is the points it added to the 100-point composite (weight × sub-score).
- Cash flow +30.0/30.0
- 1% rule +10.0/10.0
- DSCR +10.0/10.0
- ARV discount +7.5/15.0
- Livability +3.6/5.0
- Schools +3.2/10.0
- Condition / age +2.5/5.0
- Rent growth +2.1/5.0
- Appreciation +0.0/10.0
$75,000
🖨 Deal sheet 📄 Offer letter ✓ Due diligence
Listing remarks
An incredible investment opportunity is right at your fingertips and crying out for you to scratch your inner handyman. 304 E 1st Avenue is perfectly situated in close proximity to the award winning Downtown Corsicana, grocery shopping, the YMCA, and community parks. The bones are good; with a little bit of sweat and imagination, this gem will shine.
Key facts
- 7,492 sq ft lot
- Built 1950
- Listed 89 days
Tags
Property features AI
Finance
- Other: Property is not in a municipal utility district
- Financial info: Listing accepted as part of a probate sale; Acceptable financing: Cash, Conventional, 1031 Exchange
- HOA & community: No homeowners association
Exterior
- Parking: Off-street open parking
- Utilities: City water; City sewer; Electricity available and connected; Individual gas meter; Overhead utilities; All-weather road access
- Home design: Single family residence; One story; Residential property; Built in 1950
- Construction: Composition roof; Pillar/post/pier foundation
- Exterior features: Chain link fenced front yard; Fenced property with large backyard and some trees; Covered patio/porch
Interior
- Kitchen: Plumbed for gas in kitchen; Built-in cabinets; Eat-in kitchen; Utility area in kitchen
- Bedrooms: Primary bedroom (12 x 13); Bedroom (12 x 13); Bedroom (10 x 13)
- Flooring: Carpet; Vinyl; Wood under carpet
- Bathrooms: One full bathroom with garden tub (7 x 9)
- Heating & cooling: Gas jets heating
- Interior features: Eat-in kitchen; Six total rooms; One living area; Covered patio/porch
- Laundry & utility: Electric dryer hookup; Laundry located in kitchen
Neighborhood map
What this means for you Summary
Snapshot
- This is a 3-bed/1.0-bath single-family listed at $75k.
Deal economics
- At list price, monthly cash flow is $1k ($12k/yr) — positive.
- The deal already cash-flows at list — no discount required.
- Meets the 1% rule at list price ($2k rent vs $75k).
- Recommended offer: $70k (6.0% below list) — sets the bar for market timing.
- Cap rate 22.3% vs local median 4.5% in Corsicana — top-decile yield for the area; either an underpriced asset or a hidden risk that comps aren't pricing in. Stress-test before assuming the spread holds.
Location & tenants
- Location reads 71/100 on livability (#283 in TX) — a middle-class / working-renter tenant base. Strengths: cost of living A+, housing A+, health & safety A+; Watch: amenities D, crime F, commute F.
- Corsicana ISD (town): math 39% / reading 37% proficiency, ranked #471 of 826 in TX (top 57%) — families likely to look elsewhere, expect single-tenant / working-renter base with shorter leases; 65% free/reduced lunch — lower-income household profile, screen leases tightly.
- Zoned schools: Fannin El (math 27% / reading 22%, grade F, #3,052 of 4,322 statewide, top 74%, 399 students, 84% FRL) — zoned schools average 84% FRL vs 65% district-wide (19 pts higher); higher-poverty schools than district average — tighter screening recommended.
- Zoned-school proficiency averages 24% at this address vs 38% district-wide (-14 pts) — the specific schools serving this property underperform the Corsicana ISD average; the district grade overstates school quality for this exact location.
- Market conditions: Rents soft (-1.5%/yr); 268 active listings in the ZIP; 6 comparable units currently listed for rent nearby; rentals lingering (median 44d on market — plan ~5-8 weeks vacancy on turnover, expect pricing pressure); 83% of comp listings sitting > 30 days — soft ceiling on asking rent; 522 units permitted in Navarro County in 2024 (0 in 5+ unit buildings).
- This rent runs 41% of the median local income ($57k/yr) — at the standard rent-burdened threshold; future hikes will face affordability resistance.
Forward outlook
- Local home prices are declining (-3.0%/yr); year-one equity from $519 of loan paydown is wiped out by about $2k of value loss. Plan a longer hold.
- Navarro County population projected to shrink 4% by 2050 — rents likely to lag national; underwrite the cash flow, not the appreciation.
- At projected returns (-3.0% appreciation + 0.0% rent growth), your $21k cash investment doubles in ~3 years — after that, you're playing with house money.
Negotiation context
- It's been on market 89 days — a 6% lower offer ($70k) is reasonable based on typical stale-listing flexibility.
Risks & watch-outs
- Watch-outs: built in 1950 — expect roof / HVAC / electrical / plumbing capex.
- Climate carrying-cost: major wind risk, 58% chance of damaging wind over 30y; moderate wildfire risk; extreme-heat days projected 7→26/yr by 2055 (HVAC capex compounding) — expect insurance premiums to compound above CPI over the hold.
Questions for the listing agent
- It's been on market 89 days. Have you received any prior offers? Is the seller open to a 6% concession, seller financing, or rate buy-down credit?
- Built in 1950 — when were the roof, HVAC, electrical panel, plumbing, and water heater last replaced?
- Why hasn't it sold? Are there any deal-killer items the seller is aware of (foundation, flood, title, zoning, code violations)?
- Is there a deadline driving the sale (1031 exchange, divorce, estate, relocation)? That informs how much negotiation room exists.
- Schools are F-rated, which usually means shorter tenancies and higher turnover. Who's the typical renter profile here, and what's been the actual vacancy rate?
- Crime grade is F in this area — have there been break-ins, vandalism, or insurance claims at this property in the last 3 years? What carrier currently insures it and at what premium?
- What's the average days-on-market for RENTAL listings here right now (not sales)? A rising rental-DOM trend means longer vacancies and softer asking-rent achievability than the comps imply.
- What's the recent tenant-quality profile in this submarket — average credit score on applications, eviction rate, late-payment / NSF rate, and stable-employment percentage? A property-management company in the area should have these aggregated.
- How much new for-sale + rental construction is in the pipeline within 1–3 miles? Heavy new supply typically softens prices + rents 12–24 months out; constrained supply supports both.
Investment metrics
- 1% rule
- 2.60% ✓
- Cap rate
- 22.31%
- Cash-on-cash
- 57.20%
- DSCR
- 3.54
- GRM
- 3.2
CMA / ARV
- ARV (on-the-fly)
- $190,400
- Comps found
- 12
Show comp detail 12 sales within ~0.75 mi
| Address | Dist | Beds/Ba | Sqft | Sold | Price | $/sf | Match |
|---|---|---|---|---|---|---|---|
| 304 E 1st Ave | 0.00mi | 3/1.0 | 1,400 (0%) | 1mo | $75,000 | $54 | 99 |
| 507 N Beaton St | 0.14mi | 3/1.0 | 1,456 (+4%) | 7mo | $103,000 | $71 | 81 |
| 710 E 3rd Ave | 0.29mi | 3/2.0 | 1,288 (-8%) | 10mo | $189,500 | $147 | 61 |
| 815 E Collin St | 0.51mi | 3/2.0 | 1,350 (-4%) | 10mo | $229,000 | $170 | 58 |
| 609 Martin Luther King Jr Blvd | 0.55mi | 3/1.5 | 1,320 (-6%) | 11mo | $179,900 | $136 | 54 |
| 1304 E 4th Ave | 0.64mi | 3/1.0 | 1,480 (+6%) | 11mo | $135,000 | $91 | 51 |
| 317 E 14th Ave | 0.49mi | 3/2.5 | 1,567 (+12%) | 2mo | $277,000 | $177 | 50 |
| 906 N Commerce St | 0.60mi | 3/2.0 | 1,260 (-10%) | 3mo | $82,500 | $65 | 49 |
| 511 S 3rd St | 0.75mi | 2/1.0 (-1) | 1,410 (+1%) | 15mo | $99,000 | $70 | 46 |
| 1320 E 3rd Ave | 0.67mi | 4/2.5 (+1) | 1,510 (+8%) | 8mo | $229,900 | $152 | 38 |
| 150 E Rob Ave | 0.65mi | 4/1.0 (+1) | 1,286 (-8%) | 16mo | $147,000 | $114 | 38 |
| 1314 E 3rd Ave | 0.64mi | 3/2.0 | 1,565 (+12%) | 10mo | $249,000 | $159 | 38 |
Match score weights: distance 35% · size 25% · config 20% · recency 20%. Top-matched comps best support the ARV.
Projected returns pro-forma
-3.0% appreciation · 0.0% rent growth · sell at horizon
- IRR
- 52.2%
- Equity multiple
- 3.19×
- Total profit
- $45,934
- Equity at exit
- $11,183
- IRR
- 56.3%
- Equity multiple
- 5.77×
- Total profit
- $100,207
- Equity at exit
- $6,485
Cash invested: $21,000 (down + closing). Projections, not guarantees.
Landlord ↔ Tenant lean methodology
- Overall (STATE)
- 87 Strongly Landlord-Friendly
- State Texas
- 87 Strongly Landlord-Friendly · R+5
- County
- — inherits STATE
- City
- — inherits STATE
ZIP-level market 75110
- Rents YoY
- -1.5%
- Active inventory
- 268
- Price-to-rent
- 3.2×
Monthly cashflow live
- Estimated rent
- $1,947 high interval (Pro) →
- Mortgage (P&I)
- −$393
- Tax from tax record
- −$112 /mo · $1,348/yr
- Insurance
- −$31
- HOA
- −$0
- Vacancy / Maint / Mgmt
- −$409
- Net cashflow
- $1,001
Break-even live
UW: 25.0% down · 7.5% · 30yr · 1.5% tax · 5.0% vac · 8.0% maint · 8.0% mgmt
Financing live
Cash to close
- Down payment
- $18,750
- Closing costs
- $2,250
- Reserves months
- —
- Total cash needed
- —
Loan-product check · same deal, 3 products live
Conventional
25% down · 7.5% · 30yr
- Down + closing
- —
- Monthly P&I
- —
- Monthly cashflow
- —
- DSCR
- —
- Eligible?
- —
Personal DTI + credit; lowest rate.
DSCR
20% down · 8.5% · 30yr
- Down + closing
- —
- Monthly P&I
- —
- Monthly cashflow
- —
- DSCR
- —
- Eligible?
- —
No personal income docs; deal must DSCR.
Hard money
10% down · 12.0% · 12mo
- Down + closing
- —
- Monthly P&I
- —
- Monthly cashflow
- —
- DSCR
- —
- Eligible?
- —
Short-term bridge; refi at stabilization.
Rent comps 6 comps
| Address | Beds | Baths | Sqft | Rent | $/sqft | DOM | Units | Dist |
|---|---|---|---|---|---|---|---|---|
| 421 N 5th St Corsicana, TX | 4.0 | 2.0 | 1664 | $2,400 | $1.44 | 44d | 1 | 0.27mi |
| 1624 E Collin St Corsicana, TX | 3.0 | 2.0 | 1339 | $2,000 | $1.49 | 44d | 1 | 0.92mi |
| 1306 Liveoak Ave Corsicana, TX | 3.0 | 1.0 | 1080 | $1,300 | $1.20 | 5d | 1 | 1.00mi |
| 1505 Woodlawn Ave Corsicana, TX | 3.0 | 2.0 | 1220 | $1,900 | $1.56 | 44d | 1 | 1.20mi |
| 1509 W Collin St Corsicana, TX | 3.0 | 2.0 | 1290 | $1,850 | $1.43 | 44d | 1 | 1.26mi |
| 421 Forrest Ln Corsicana, TX | 3.0 | 2.0 | 1528 | $2,000 | $1.31 | 44d | 1 | 1.48mi |
Listing history 5 events
-
2026-05-09status Pending
-
2026-05-01historical Active Option Contract
-
2026-04-15price $75,000
-
2026-02-09$79,900 Active
-
1990-02-14soldstatus
ⓘ Source: listings_history table (triggers on properties + properties_extension) + one-shot
backfill from property_details.listing_events for pre-trigger history.
Tax reassessment forecast TX · Resets to sale price
- Current annual tax
- $1,348 · $112/mo
- Projected year-2 tax
- $1,372 · $114/mo
- Expected delta
- +$25/yr (+$2/mo · 1.8%)
ⓘ Screening estimate from a state-policy table — verify with the county assessor before closing.
Climate risk First Street
- Flood 1/10 Low FEMA zone X (unshaded) · 0% chance over 30 yrs
- Wildfire 5/10 Major
- Heat 7/10 Severe 7 d/yr ≥109°F today · 26 d/yr by 30 yrs out
- Wind 6/10 Major 58% chance of damaging wind over 30 yrs
- Air quality 2/10 Low 0 unhealthy d/yr today · 1 by 30 yrs out
Nearby sold comps map
Loading sold comps map…
Walkable amenities ~0.75 mi
Loading nearby amenities…
Taxation est. · year 1
- Rental income
- $23,360
- − Mortgage interest
- −$4,201
- − Property taxes
- −$1,348
- − Insurance
- −$375
- − Repairs & maintenance
- −$1,869
- − Management
- −$1,869
- − Depreciation
- −$2,182
- Taxable income
- $11,516
- Est. tax owed @ 24.0%
- −$2,764
- After-tax cash flow
- $9,248/yr
For passive investors: Depreciation is non-cash, so a rental often shows a tax loss while cash-flowing — sheltering income. Rental losses are passive: they offset passive income freely, and up to $25,000/yr can offset ordinary (W-2) income if you actively participate and your MAGI is under $100k (phasing out to $0 by $150k); unused losses carry forward. On sale, claimed depreciation is recaptured at up to 25%, and gains may owe capital-gains tax (a 1031 exchange can defer both). Figures are a year-1 estimate at your 24.0% rate — not tax advice; consult a CPA.
Schools (NCES district)
- District
- Corsicana ISD
- NCES district ID
- 4815330
- Math proficiency
- 39% ▼ -9.00%
- Reading proficiency
- 37% ▬ 0.00%
- Median HH income
- $39,948
- Composite
- 31.89/100
- National rank
- #5862
- State rank
- #471 of 826 in TX
Livability — Corsicana
- Score
- 71/100
- State rank
- #283
- US rank
- #6570
Category grades
Schools grade is shown separately in the Schools card above.
Census & demographics
- Census place
- Corsicana, TX
- County
- Navarro County · 31,552 people
- City population
- 31,552
- Metro
- Corsicana, TX
- Population (ZIP)
- 31,552
- Household income
- $57,370
- Rent vs Own
- Severe rent burden
- 663.0
Population outlook (Navarro County) Hauer SSP2
- Today (2025)
- 48,397 people
- By 2030
- 48,096 · -0.6%
- By 2040
- 47,394 · -2.1%
- By 2050
- 46,541 · -3.8%
- By 2075
- 44,940 · -7.1%
- By 2100
- 42,288 · -12.6%
Race, ethnicity, and origin ACS 2023
- Neighborhood character
- Diverse neighborhood (Simpson 0.68)
- Race & ethnicity
- White 41% Hispanic / Latino 37% Two or more races 16% Black 13% Pacific Islander 2% Asian 1%
- Hispanic origin (detail)
- Mexican 34%
- Common ancestry
- Lithuanian 2% Slovak 1% Romanian 1%
- Foreign-born
- 17% · Canada
- Languages at home
- 68% English-only · Spanish 29% Other Asian/Pacific 2%
Political lean MEDSL · Navarro
- 2024 margin
- Solid R (+51.8) · D 23.7% · R 75.6%
- 2008→2024 swing
- -18.7pp toward R · 2008: -33.1pp · 2024: -51.8pp
- All cycles
- 2024: R+51.8 2020: R+45.5 2016: R+48.8 2012: R+42.4 2008: R+33.1
Not yet ingested
- Civics
- —
Market trends
- HPI YoY
- ▼ -248.01%
- Current HPI
- 224.5566
- Rent YoY
- ▼ -1.47%
- Metro
- Corsicana, TX
- State GDP YoY
- ▲ 3.95%
- F500 in state
- 110
Industry mix (Fortune 500 HQ in TX)
| Industry | F500 HQs | Revenue |
|---|---|---|
| Energy | 16 | $1,198B |
|
||
| Technology | 5 | $198B |
|
||
| Engineering / Construction | 4 | $72B |
|
||
| Energy Services | 3 | $60B |
|
||
| Utilities | 3 | $41B |
|
||
| Healthcare | 2 | $330B |
|
||
Price history
-6.1% since first listed5 events — show timeline
- 2026-05-09 Pending — NTREIS
- 2026-05-01 Contingent — NTREIS
- 2026-04-15 Price Changed $75,000 NTREIS
- 2026-02-09 Listed $79,900 NTREIS
- 1990-02-14 Sold (Public Records) — Public Records
Property tax history
+5.9%/yrLatest (2025): $1,348 · -26.5% YoY. Source: county tax records.
Cash-flow waterfall
monthlySold comps — $/sqft
last 12 mo · ≤1 miLoading sold comps…