11658 Beaver Dr · Garrison, MN
Flood risk 1/10 · Minimal
- FEMA flood zone
- X (unshaded)
- Chance of flooding over 30 yrs
- 0.0%
- Est. flood insurance / yr
- $507 – $1,088
Fire risk 3/10 · Minor
- Est. fire insurance / yr
- $888 – $1,650
Heat risk 1/10 · Minimal
- Hot days now (above 93°F)
- 7 days/yr
- Hot days in 30 yrs
- 13 days/yr
Wind risk 1/10 · Minimal
- Chance of severe wind over 30 yrs
- —
Air-quality risk 2/10 · Minimal
- Unhealthy air days now
- 0 days/yr
- Unhealthy air days in 30 yrs
- 1 days/yr
Risk factors via First Street. Map © Google.
Why this score? — see what drove the B- grade
The composite is a weighted blend of 9 inputs, each scored 0–100. Each bar is that input's sub-score; the figure is the points it added to the 100-point composite (weight × sub-score).
- Cash flow +30.0/30.0
- DSCR +10.0/10.0
- 1% rule +8.1/10.0
- ARV discount +7.5/15.0
- Schools +4.6/10.0
- Livability +3.1/5.0
- Rent growth +2.5/5.0
- Condition / age +2.5/5.0
- Appreciation +0.0/10.0
$89,000
🖨 Deal sheet 📄 Offer letter ✓ Due diligence
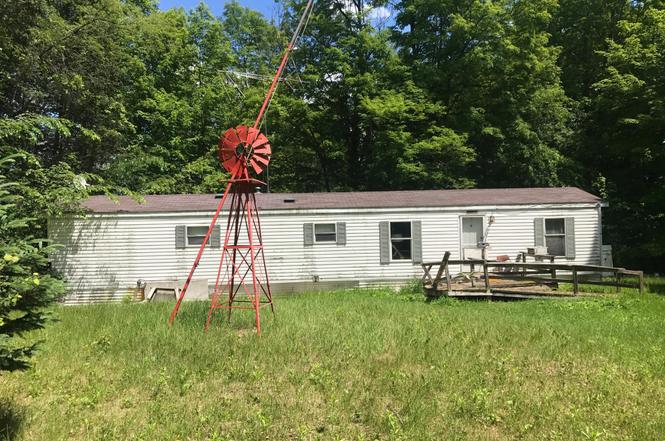
Listing remarks
Seller is selling As Is and has never occupied the home. Mobile Home needs some Elbow Grease, a good fixer upper in mind. Make it a nice residence or great retreat. Very Forestry Atmosphere. 10 min. to Garrison, Mille Lacs Lake, many surrounding lakes to enjoy. Quick hop of 25 min. to Brainerd, 25 min to Aitkin. Plus 33x22 Pole Shed Garage for Vehicles and Toys. Needs some TLC.
Key facts
- 8.57 acre lot
- 4 garage spots
- Built 1998
Property features AI
Finance
- Other: Lot approximately 8.57 acres with irregular dimensions (200 x 1,441 x irr); Road frontage: township
Exterior
- Parking: Attached or detached 4-car garage (33x22)
- Utilities: Private well with 4-inch submersible drilled well; Private sewer; Propane fuel; Electric service by Mille Lacs Energy Co-op
- Home design: Residential manufactured home; One level
- Construction: Pillar/post/pier foundation; Asphalt pitched roof (over 8 years); Built with vinyl siding
- Exterior features: Vinyl exterior; Hilly to level topography; Public maintained road access
Interior
- Kitchen: Kitchen on the main level (approximately 12x9)
- Bedrooms: Two bedrooms on the main level (approximately 11x10 and 11x10)
- Bathrooms: One full bathroom on the main level (approximately 7x7)
- Heating & cooling: Forced air heating; No central air
- Interior features: Fuel tank (rented)
- Laundry & utility: Laundry on the main level
Neighborhood map
What this means for you Summary
Snapshot
- This is a 2-bed/1.0-bath single-family listed at $89k.
Deal economics
- At list price, monthly cash flow is $357 ($4k/yr) — positive.
- The deal already cash-flows at list — no discount required.
- Meets the 1% rule at list price ($1k rent vs $89k).
- Cap rate 11.1% vs local median 1.3% in Garrison — top-decile yield for the area; either an underpriced asset or a hidden risk that comps aren't pricing in. Stress-test before assuming the spread holds.
Location & tenants
- Location reads 61/100 on livability (#738 in MN) — a middle-class / working-renter tenant base. Strengths: cost of living A+; Watch: employment C-, health & safety C-, crime D+.
- Brainerd Public School District (town): math 49% / reading 58% proficiency, ranked #85 of 301 in MN (top 28%) — acceptable for families but not a draw, mixed tenant base, ~2y average lease.
- Market conditions: 401 active listings in the ZIP; 420 units permitted in Crow Wing County in 2024 (17 in 5+ unit buildings).
Forward outlook
- Local home prices are declining (-3.0%/yr); year-one equity from $615 of loan paydown is wiped out by about $3k of value loss. Plan a longer hold.
- Crow Wing County population projected to shrink 8% by 2050 — rents likely to lag national; underwrite the cash flow, not the appreciation.
- At projected returns (-3.0% appreciation + 3.0% rent growth), your $25k cash investment doubles in ~7 years — after that, you're playing with house money.
Negotiation context
- Only 3 days on market — expect competitive offers; lowballing is unlikely to land.
- Current owner paid $54k; list at $89k implies a 65% gain — meaningful room to come down on a strong offer.
Questions for the listing agent
- Is there a deadline driving the sale (1031 exchange, divorce, estate, relocation)? That informs how much negotiation room exists.
- Schools are F-rated, which usually means shorter tenancies and higher turnover. Who's the typical renter profile here, and what's been the actual vacancy rate?
- Crime grade is D in this area — have there been break-ins, vandalism, or insurance claims at this property in the last 3 years? What carrier currently insures it and at what premium?
- What's the average days-on-market for RENTAL listings here right now (not sales)? A rising rental-DOM trend means longer vacancies and softer asking-rent achievability than the comps imply.
- What's the recent tenant-quality profile in this submarket — average credit score on applications, eviction rate, late-payment / NSF rate, and stable-employment percentage? A property-management company in the area should have these aggregated.
- How much new for-sale + rental construction is in the pipeline within 1–3 miles? Heavy new supply typically softens prices + rents 12–24 months out; constrained supply supports both.
Investment metrics
- 1% rule
- 1.31% ✓
- Cap rate
- 11.11%
- Cash-on-cash
- 17.21%
- DSCR
- 1.77
- GRM
- 6.4
CMA / ARV
No comps found within radius.
Projected returns pro-forma
-3.0% appreciation · 3.0% rent growth · sell at horizon
- IRR
- 8.5%
- Equity multiple
- 1.33×
- Total profit
- $8,327
- Equity at exit
- $13,270
- IRR
- 17.7%
- Equity multiple
- 2.46×
- Total profit
- $36,504
- Equity at exit
- $7,695
Cash invested: $24,920 (down + closing). Projections, not guarantees.
Landlord ↔ Tenant lean methodology
- Overall (STATE)
- 46 Balanced
- State Minnesota
- 46 Balanced · D+2
- County
- — inherits STATE
- City
- — inherits STATE
ZIP-level market 56401
- Active inventory
- 401
- Price-to-rent
- 6.4×
Monthly cashflow live
- Estimated rent
- $1,165 medium interval (Pro) →
- Mortgage (P&I)
- −$467
- Tax from tax record
- −$59 /mo · $710/yr
- Insurance
- −$37
- HOA
- −$0
- Vacancy / Maint / Mgmt
- −$245
- Net cashflow
- $357
Break-even live
UW: 25.0% down · 7.5% · 30yr · 1.5% tax · 5.0% vac · 8.0% maint · 8.0% mgmt
Financing live
Cash to close
- Down payment
- $22,250
- Closing costs
- $2,670
- Reserves months
- —
- Total cash needed
- —
Loan-product check · same deal, 3 products live
Conventional
25% down · 7.5% · 30yr
- Down + closing
- —
- Monthly P&I
- —
- Monthly cashflow
- —
- DSCR
- —
- Eligible?
- —
Personal DTI + credit; lowest rate.
DSCR
20% down · 8.5% · 30yr
- Down + closing
- —
- Monthly P&I
- —
- Monthly cashflow
- —
- DSCR
- —
- Eligible?
- —
No personal income docs; deal must DSCR.
Hard money
10% down · 12.0% · 12mo
- Down + closing
- —
- Monthly P&I
- —
- Monthly cashflow
- —
- DSCR
- —
- Eligible?
- —
Short-term bridge; refi at stabilization.
Listing history 4 events
-
2026-06-19days on market $89,000 Active 3 DOM
-
2026-06-18days on market $89,000 Active 2 DOM
-
2026-06-17remarks 381-char remark
-
2026-06-17$89,000 Active 1 DOM
ⓘ Source: listings_history table (triggers on properties + properties_extension) + one-shot
backfill from property_details.listing_events for pre-trigger history.
Tax reassessment forecast MN · Partial reset (capped growth)
- Current annual tax
- $710 · $59/mo
- Projected year-2 tax
- $853 · $71/mo
- Expected delta
- +$143/yr (+$12/mo · 20.2%)
ⓘ Screening estimate from a state-policy table — verify with the county assessor before closing.
Climate risk First Street
- Flood 1/10 Low FEMA zone X (unshaded) · 0% chance over 30 yrs
- Wildfire 3/10 Moderate
- Heat 1/10 Low 7 d/yr ≥93°F today · 13 d/yr by 30 yrs out
- Wind 1/10 Low
- Air quality 2/10 Low 0 unhealthy d/yr today · 1 by 30 yrs out
Nearby sold comps map
Loading sold comps map…
Walkable amenities ~0.75 mi
Loading nearby amenities…
Taxation est. · year 1
- Rental income
- $13,980
- − Mortgage interest
- −$4,985
- − Property taxes
- −$710
- − Insurance
- −$445
- − Repairs & maintenance
- −$1,118
- − Management
- −$1,118
- − Depreciation
- −$2,589
- Taxable income
- $3,014
- Est. tax owed @ 24.0%
- −$723
- After-tax cash flow
- $3,565/yr
For passive investors: Depreciation is non-cash, so a rental often shows a tax loss while cash-flowing — sheltering income. Rental losses are passive: they offset passive income freely, and up to $25,000/yr can offset ordinary (W-2) income if you actively participate and your MAGI is under $100k (phasing out to $0 by $150k); unused losses carry forward. On sale, claimed depreciation is recaptured at up to 25%, and gains may owe capital-gains tax (a 1031 exchange can defer both). Figures are a year-1 estimate at your 24.0% rate — not tax advice; consult a CPA.
Schools (NCES district)
- District
- Brainerd Public School District
- NCES district ID
- 2706090
- Math proficiency
- 49% ▼ -13.00%
- Reading proficiency
- 58% ▼ -9.00%
- Median HH income
- $49,059
- Composite
- 45.57/100
- National rank
- #2596
- State rank
- #85 of 301 in MN
Livability — Garrison
- Score
- 61/100
- State rank
- #738
- US rank
- #17967
Category grades
Schools grade is shown separately in the Schools card above.
Census & demographics
- County
- Crow Wing County · 40,773 people
- Metro
- Brainerd, MN
- Population (ZIP)
- 31,841
- Household income
- $73,128
- Rent vs Own
- Severe rent burden
- 454.0
Population outlook (Crow Wing County) Hauer SSP2
- Today (2025)
- 64,187 people
- By 2030
- 64,057 · -0.2%
- By 2040
- 62,470 · -2.7%
- By 2050
- 59,064 · -8.0%
- By 2075
- 48,738 · -24.1%
- By 2100
- 36,112 · -43.7%
Race, ethnicity, and origin ACS 2023
- Neighborhood character
- Predominantly White (93%)
- Race & ethnicity
- White 93% Two or more races 2% Hispanic / Latino 2% Native American 1%
- Common ancestry
- Portuguese 12% Romanian 6% Lithuanian 5%
- Foreign-born
- 1% · Canada
- Languages at home
- 98% English-only · Spanish 1%
Political lean MEDSL · Crow Wing
- 2024 margin
- Solid R (+31.4) · D 33.6% · R 65.0% · Other 1.5%
- 2008→2024 swing
- -23.7pp toward R · 2008: -7.7pp · 2024: -31.4pp
- All cycles
- 2024: R+31.4 2020: R+29.7 2016: R+31.8 2012: R+13.4 2008: R+7.7
Not yet ingested
- Civics
- —
Market trends
- HPI YoY
- ▼ -226.09%
- Current HPI
- 220.3299
- Rent YoY
- —
- Metro
- Brainerd, MN
- State GDP YoY
- ▲ 2.41%
- F500 in state
- 34
Industry mix (Fortune 500 HQ in MN)
| Industry | F500 HQs | Revenue |
|---|---|---|
| Healthcare | 2 | $407B |
|
||
| Retail | 2 | $150B |
|
||
| Consumer Goods | 2 | $32B |
|
||
| Industrial Machinery | 2 | $6B |
|
||
| Agriculture | 1 | $40B |
|
||
| Healthcare / Medical Devices | 1 | $32B |
|
||
Price history
+64.8% since first listed3 events — show timeline
- 2026-06-16 Listed $89,000 NORTHSTARMLS as Distributed by MLS Grid
- 2020-04-13 Sold (Public Records) $54,000 Public Records
- 2014-12-15 Sold (Public Records) $54,000 Public Records
Property tax history
+7.5%/yrLatest (2026): $710 · +74.9% YoY. Source: county tax records.
Cash-flow waterfall
monthlySold comps — $/sqft
last 12 mo · ≤1 miLoading sold comps…