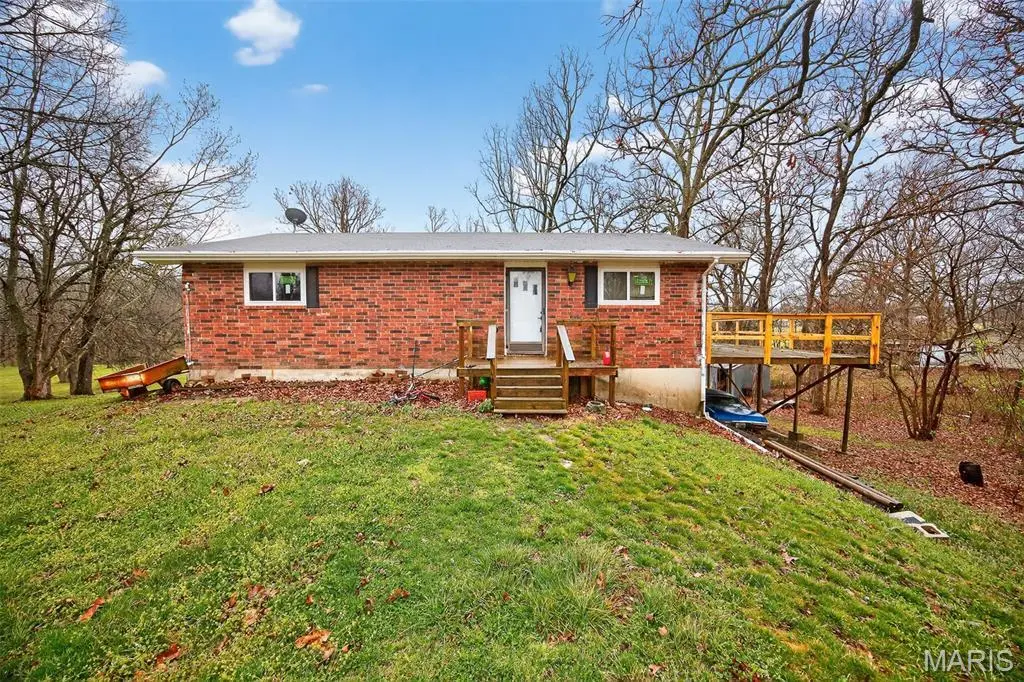
19536 Echo Rd · Phillipsburg, MO
Flood risk 1/10 · Minimal
- FEMA flood zone
- X (unshaded)
- Chance of flooding over 30 yrs
- 0.0%
- Est. flood insurance / yr
- $507 – $1,088
Fire risk 6/10 · Moderate
- Est. fire insurance / yr
- $1,054 – $1,958
Heat risk 4/10 · Minor
- Hot days now (above 106°F)
- 7 days/yr
- Hot days in 30 yrs
- 19 days/yr
Wind risk 2/10 · Minimal
- Chance of severe wind over 30 yrs
- 1.0%
Air-quality risk 1/10 · Minimal
- Unhealthy air days now
- 0 days/yr
- Unhealthy air days in 30 yrs
- 0 days/yr
Risk factors via First Street. Map © Google.
Why this score? — see what drove the D- grade
The composite is a weighted blend of 9 inputs, each scored 0–100. Each bar is that input's sub-score; the figure is the points it added to the 100-point composite (weight × sub-score).
- Cash flow +9.2/30.0
- ARV discount +7.5/15.0
- Appreciation +6.6/10.0
- Schools +2.7/10.0
- DSCR +2.6/10.0
- Livability +2.6/5.0
- Rent growth +2.5/5.0
- Condition / age +2.5/5.0
- 1% rule +1.8/10.0
$159,900
🖨 Deal sheet 📄 Offer letter ✓ Due diligence
Listing remarks
Welcome to your Next Home! Offering the perfect blend of major updates and opportunity to make it your own. The interior is ready for your personal touch and cosmetic updates BUT the heavy lifting has already been completed with most of the big ticket improvements. Enjoy peace of mind with a new roof, facia, soffit, siding and gutters with gutter guards, along with new windows, a new exterior door and a new deck off the primary bedroom perfect for relaxing! Additional updates include a new HVAC system, water heater and attic fan providing comfort and efficiency year-round. The home features brick on two sides for added curb appeal and sits on a spacious lot of over 1 acre with beautiful v
Key facts
- 1.16 acre lot
- Built 1974
- Listed 29 days
Neighborhood map
What this means for you Summary
Snapshot
- This is a 4-bed/3.0-bath other listed at $160k.
Deal economics
- At list price, monthly cash flow is $-119 ($-1k/yr) — negative.
- To cash-flow at today's rent, offer at most $139k (13.2% below list).
- To meet the 1% rule (rent ≥ 1% of price), the offer needs to be $110k (31.5% below list).
- Recommended offer: $110k (31.5% below list) — sets the bar for 1% rule.
Location & tenants
- Location reads 52/100 on livability (#845 in MO) — a working-class tenant base; expect higher turnover. Strengths: cost of living A+, housing A+; Watch: crime F, amenities F, commute F.
- Lebanon R-III (town): math 29% / reading 35% proficiency, ranked #256 of 324 in MO (top 79%) — families likely to look elsewhere, expect single-tenant / working-renter base with shorter leases.
- Zoned schools: Lebanon Sr. High (math 16% / reading 34%, grade F, #435 of 521 statewide, top 83%, 1,474 students, 50% FRL) — zoned schools at 50% FRL track the district average.
- Market conditions: 12 active listings in the ZIP; 61 units permitted in Laclede County in 2024 (0 in 5+ unit buildings).
Forward outlook
- In year one you build about $6k of equity ($1k loan paydown + $5k appreciation (3.2% local appreciation)).
- Laclede County population projected at -13% by 2050 — secular population decline; favor cash flow + early exit over multi-decade hold.
- By year 6, paydown + projected appreciation supports a ~$33k cash-out refi (75% LTV) — recoverable capital for the next deal without selling this one.
Negotiation context
- It's been on market 29 days — a 2% lower offer ($158k) is reasonable based on typical stale-listing flexibility.
Risks & watch-outs
- Climate carrying-cost: major wildfire risk — expect insurance premiums to compound above CPI over the hold.
Questions for the listing agent
- What do current leases actually rent for vs. the listed asking? Can we see a recent rent roll and the last 12 months of T-12 income?
- Built in 1974 — when were the roof, HVAC, electrical panel, plumbing, and water heater last replaced?
- Is there a deadline driving the sale (1031 exchange, divorce, estate, relocation)? That informs how much negotiation room exists.
- Schools are F-rated, which usually means shorter tenancies and higher turnover. Who's the typical renter profile here, and what's been the actual vacancy rate?
- Crime grade is F in this area — have there been break-ins, vandalism, or insurance claims at this property in the last 3 years? What carrier currently insures it and at what premium?
- The area grade is low — what's the realistic commute time and amenity access for the typical tenant pool here? Any planned neighborhood developments (good or bad) we should know about?
- What's the average days-on-market for RENTAL listings here right now (not sales)? A rising rental-DOM trend means longer vacancies and softer asking-rent achievability than the comps imply.
- What's the recent tenant-quality profile in this submarket — average credit score on applications, eviction rate, late-payment / NSF rate, and stable-employment percentage? A property-management company in the area should have these aggregated.
- How much new for-sale + rental construction is in the pipeline within 1–3 miles? Heavy new supply typically softens prices + rents 12–24 months out; constrained supply supports both.
Investment metrics
- 1% rule
- 0.68% ✗
- Cap rate
- 5.40%
- Cash-on-cash
- -3.20%
- DSCR
- 0.86
- GRM
- 12.2
CMA / ARV
No comps found within radius.
Projected returns pro-forma
3.25% appreciation · 3.0% rent growth · sell at horizon
- IRR
- 5.3%
- Equity multiple
- 1.31×
- Total profit
- $13,716
- Equity at exit
- $74,143
- IRR
- 8.2%
- Equity multiple
- 2.27×
- Total profit
- $56,834
- Equity at exit
- $116,040
Cash invested: $44,772 (down + closing). Projections, not guarantees.
Landlord ↔ Tenant lean methodology
- Overall (STATE)
- 81 Strongly Landlord-Friendly
- State Missouri
- 81 Strongly Landlord-Friendly · R+10
- County
- — inherits STATE
- City
- — inherits STATE
ZIP-level market 65722
- Home prices YoY
- 1.5%
- Active inventory
- 12
- Price-to-rent
- 12.2×
Monthly cashflow live
- Estimated rent
- $1,095 medium interval (Pro) →
- Mortgage (P&I)
- −$839
- Tax from tax record
- −$79 /mo · $953/yr
- Insurance
- −$67
- HOA
- −$0
- Vacancy / Maint / Mgmt
- −$230
- Net cashflow
- $-119
Break-even live
UW: 25.0% down · 7.5% · 30yr · 1.5% tax · 5.0% vac · 8.0% maint · 8.0% mgmt
Financing live
Cash to close
- Down payment
- $39,975
- Closing costs
- $4,797
- Reserves months
- —
- Total cash needed
- —
Loan-product check · same deal, 3 products live
Conventional
25% down · 7.5% · 30yr
- Down + closing
- —
- Monthly P&I
- —
- Monthly cashflow
- —
- DSCR
- —
- Eligible?
- —
Personal DTI + credit; lowest rate.
DSCR
20% down · 8.5% · 30yr
- Down + closing
- —
- Monthly P&I
- —
- Monthly cashflow
- —
- DSCR
- —
- Eligible?
- —
No personal income docs; deal must DSCR.
Hard money
10% down · 12.0% · 12mo
- Down + closing
- —
- Monthly P&I
- —
- Monthly cashflow
- —
- DSCR
- —
- Eligible?
- —
Short-term bridge; refi at stabilization.
Listing history 3 events
-
2026-04-25status Pending
-
2026-03-27$159,900 Active
-
2026-03-27historical $159,900
ⓘ Source: listings_history table (triggers on properties + properties_extension) + one-shot
backfill from property_details.listing_events for pre-trigger history.
Tax reassessment forecast MO · Resets to sale price
- Current annual tax
- $953 · $79/mo
- Projected year-2 tax
- $1,551 · $129/mo
- Expected delta
- +$598/yr (+$50/mo · 62.8%)
ⓘ Screening estimate from a state-policy table — verify with the county assessor before closing.
Climate risk First Street
- Flood 1/10 Low FEMA zone X (unshaded) · 0% chance over 30 yrs
- Wildfire 6/10 Major
- Heat 4/10 Moderate 7 d/yr ≥106°F today · 19 d/yr by 30 yrs out
- Wind 2/10 Low 100% chance of damaging wind over 30 yrs
- Air quality 1/10 Low 0 unhealthy d/yr today · 0 by 30 yrs out
Nearby sold comps map
Loading sold comps map…
Walkable amenities ~0.75 mi
Loading nearby amenities…
Taxation est. · year 1
- Rental income
- $13,143
- − Mortgage interest
- −$8,957
- − Property taxes
- −$953
- − Insurance
- −$800
- − Repairs & maintenance
- −$1,051
- − Management
- −$1,051
- − Depreciation
- −$4,652
- Taxable loss
- −$4,321
- Est. tax savings @ 24.0%
- +$1,037
- After-tax cash flow
- $-395/yr
For passive investors: Depreciation is non-cash, so a rental often shows a tax loss while cash-flowing — sheltering income. Rental losses are passive: they offset passive income freely, and up to $25,000/yr can offset ordinary (W-2) income if you actively participate and your MAGI is under $100k (phasing out to $0 by $150k); unused losses carry forward. On sale, claimed depreciation is recaptured at up to 25%, and gains may owe capital-gains tax (a 1031 exchange can defer both). Figures are a year-1 estimate at your 24.0% rate — not tax advice; consult a CPA.
Schools (NCES district)
- District
- Lebanon R-III
- NCES district ID
- 2918270
- Math proficiency
- 29% ▼ -10.00%
- Reading proficiency
- 35% ▼ -8.00%
- Median HH income
- $38,352
- Composite
- 26.73/100
- National rank
- #7145
- State rank
- #256 of 324 in MO
Livability — Phillipsburg
- Score
- 52/100
- State rank
- #845
- US rank
- #24713
Category grades
Schools grade is shown separately in the Schools card above.
Census & demographics
- Population (ZIP)
- 1,404
Population outlook (Laclede County) Hauer SSP2
- Today (2025)
- 34,730 people
- By 2030
- 33,985 · -2.1%
- By 2040
- 32,213 · -7.2%
- By 2050
- 30,189 · -13.1%
- By 2075
- 24,782 · -28.6%
- By 2100
- 18,554 · -46.6%
Race, ethnicity, and origin ACS 2023
- Neighborhood character
- Predominantly White (92%)
- Race & ethnicity
- White 92% Hispanic / Latino 3% Two or more races 3%
- Common ancestry
- Iranian 5% American 3% Italian 1%
- Foreign-born
- 4%
- Languages at home
- 96% English-only · Other Indo-European 3% Russian/Polish/Slavic 1%
Political lean MEDSL · Laclede
- 2024 margin
- Solid R (+66.8) · D 16.1% · R 82.9%
- 2008→2024 swing
- +212.7pp toward D · 2008: -279.5pp · 2024: -66.8pp
- All cycles
- 2024: R+66.8 2020: R+65.4 2016: R+64.5 2012: R+44.5 2008: R+279.5
Not yet ingested
- Civics
- —
Market trends
- HPI YoY
- ▲ 3.25%
- Current HPI
- 224.0849
- Rent YoY
- —
- Metro
- —
- State GDP YoY
- ▲ 1.84%
- F500 in state
- 20
Industry mix (Fortune 500 HQ in MO)
| Industry | F500 HQs | Revenue |
|---|---|---|
| Healthcare | 1 | $163B |
|
||
| Insurance | 1 | $21B |
|
||
| Industrial Technology | 1 | $17B |
|
||
| Retail | 1 | $16B |
|
||
| Industrial Distribution | 1 | $10B |
|
||
| Utilities | 1 | $9B |
|
||
Price history
+0.0% since first listed3 events — show timeline
- 2026-04-25 Pending — MARIS as Distributed by MLS Grid
- 2026-03-27 Listed $159,900 MARIS as Distributed by MLS Grid
- 2026-03-27 Coming Soon $159,900 MARIS as Distributed by MLS Grid
Property tax history
+4.5%/yrLatest (2025): $953 · +8.3% YoY. Source: county tax records.
Cash-flow waterfall
monthlySold comps — $/sqft
last 12 mo · ≤1 miLoading sold comps…