92-1401 Donola Dr · Hawaiian Ocean View, HI
Flood risk 1/10 · Minimal
- FEMA flood zone
- X (unshaded)
- Chance of flooding over 30 yrs
- 0.0%
- Est. flood insurance / yr
- $507 – $1,088
Fire risk No data
- Est. fire insurance / yr
- —
Heat risk No data
- Hot days now (above threshold)
- —
- Hot days in 30 yrs
- —
Wind risk No data
- Chance of severe wind over 30 yrs
- —
Air-quality risk 1/10 · Minimal
- Unhealthy air days now
- —
- Unhealthy air days in 30 yrs
- —
Risk factors via First Street. Map © Google.
Why this score? — see what drove the D grade
The composite is a weighted blend of 9 inputs, each scored 0–100. Each bar is that input's sub-score; the figure is the points it added to the 100-point composite (weight × sub-score).
- Cash flow +11.8/30.0
- ARV discount +7.5/15.0
- Appreciation +5.0/10.0
- Schools +3.7/10.0
- DSCR +3.5/10.0
- 1% rule +3.4/10.0
- Rent growth +2.5/5.0
- Livability +2.4/5.0
- Condition / age +1.0/5.0
$250,000
🖨 Deal sheet (PDF) 📄 Offer letter ✓ Due diligence
Listing remarks MLS
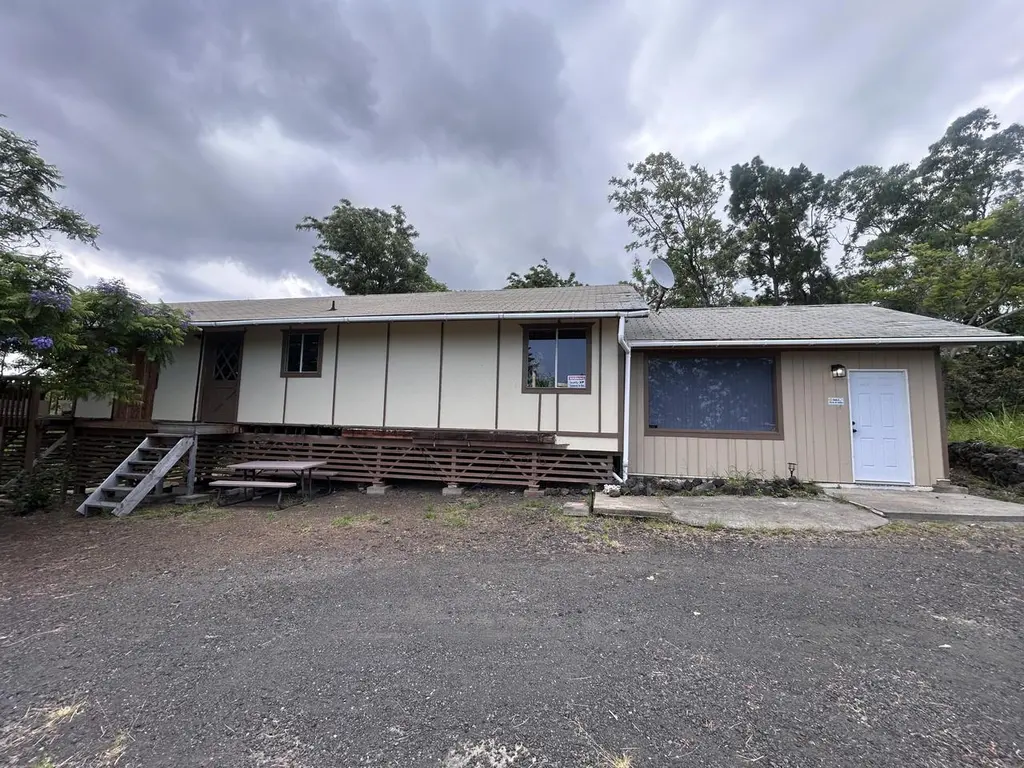
This 3 Bedroom, 2 bath home is on a nice corner lot in HOVE. . This home is permitted as a 2 Bedroom, 2 Bath. The carport has been enclosed to be the 3rd Bedroom. There is some beautiful trees, including a couple of large Jacarandas that when they bloom are beautiful. The driveway is a horse shoe, making it easy for in and out. The interior is in need of some TLC and therefore the price of this home reflects this.
Key facts
- 1 acre lot
- Built 1981
- Listed 27 days
Property features AI
Exterior
- Utilities: Fiber-optic internet available; Electricity available; Catchment water source; Cesspool sewer; No solid waste disposal service
- Home design: Fee simple ownership
- Construction: Lava Zone 2
- Exterior features: Corner lot; Grassy areas; Wooded areas; Gentle slope topography; Road/Street frontage; Paved private road access
Interior
- Kitchen: Refrigerator
- Flooring: Carpet; Ceramic tile
- Bathrooms: 3 full bathrooms
- Heating & cooling: Tankless water heater
- Interior features: Blinds on windows
Neighborhood map
What this means for you Summary
Snapshot
- This is a 2-bed/3.0-bath single-family listed at $250k. Condition is rated poor.
Deal economics
- At list price, monthly cash flow is $-69 ($-824/yr) — negative.
- To cash-flow at today's rent, offer at most $240k (4.0% below list).
- To meet the 1% rule (rent ≥ 1% of price), the offer needs to be $210k (16.0% below list).
- Recommended offer: $210k (16.0% below list) — sets the bar for 1% rule.
- Cap rate 6.0% vs local median 4.3% in Hawaiian Ocean View — top-decile yield for the area; either an underpriced asset or a hidden risk that comps aren't pricing in. Stress-test before assuming the spread holds.
Location & tenants
- Location reads 48/100 on livability (#151 in HI) — a working-class tenant base; expect higher turnover. Watch: housing C-, health & safety C-, amenities F.
- Hawaii Department Of Education (suburban): math 32% / reading 50% proficiency, ranked #1 of 1 in HI (top 100%) — families likely to look elsewhere, expect single-tenant / working-renter base with shorter leases.
- Zoned schools: Naalehu Elementary School (math 8% / reading 22%, grade F, #171 of 183 statewide, top 94%, 422 students, 70% FRL) — zoned schools average 70% FRL vs 39% district-wide (31 pts higher); higher-poverty schools than district average — tighter screening recommended.
- Zoned-school proficiency averages 15% at this address vs 41% district-wide (-26 pts) — the specific schools serving this property underperform the Hawaii Department Of Education average; the district grade overstates school quality for this exact location.
- Market conditions: 248 active listings in the ZIP; 1 comparable units currently listed for rent nearby; 982 units permitted in Hawaii County in 2024 (0 in 5+ unit buildings).
Forward outlook
- In year one you build about $9k of equity ($2k loan paydown + $8k appreciation (3.0% local appreciation)).
- Hawaii County population projected at +24% by 2050 — long-run rental-demand tailwind backs the buy-and-hold thesis.
- At projected returns (3.0% appreciation + 3.0% rent growth), your $70k cash investment doubles in ~7 years — after that, you're playing with house money.
- By year 4, paydown + projected appreciation supports a ~$31k cash-out refi (75% LTV) — recoverable capital for the next deal without selling this one.
Negotiation context
- It's been on market 27 days — a 2% lower offer ($246k) is reasonable based on typical stale-listing flexibility.
- 2 sale attempts since 3y ago with the ask held roughly flat each time — persistent listings suggest the price (not the market) is what's stuck; bring a comps-based counter.
Questions for the listing agent
- What do current leases actually rent for vs. the listed asking? Can we see a recent rent roll and the last 12 months of T-12 income?
- Have any recent inspections been done? Can we get a copy of the seller's disclosures and any deferred-maintenance estimates?
- Is there a deadline driving the sale (1031 exchange, divorce, estate, relocation)? That informs how much negotiation room exists.
- Schools are D-rated, which usually means shorter tenancies and higher turnover. Who's the typical renter profile here, and what's been the actual vacancy rate?
- The area grade is low — what's the realistic commute time and amenity access for the typical tenant pool here? Any planned neighborhood developments (good or bad) we should know about?
- What's the average days-on-market for RENTAL listings here right now (not sales)? A rising rental-DOM trend means longer vacancies and softer asking-rent achievability than the comps imply.
- What's the recent tenant-quality profile in this submarket — average credit score on applications, eviction rate, late-payment / NSF rate, and stable-employment percentage? A property-management company in the area should have these aggregated.
- How much new for-sale + rental construction is in the pipeline within 1–3 miles? Heavy new supply typically softens prices + rents 12–24 months out; constrained supply supports both.
Investment metrics
- 1% rule
- 0.84% ✗
- Cap rate
- 5.96%
- Cash-on-cash
- -1.18%
- DSCR
- 0.95
- GRM
- 9.9
CMA / ARV
No comps found within radius.
Projected returns pro-forma
3.0% appreciation · 3.0% rent growth · sell at horizon
- IRR
- 6.4%
- Equity multiple
- 1.37×
- Total profit
- $25,773
- Equity at exit
- $112,411
- IRR
- 9.3%
- Equity multiple
- 2.40×
- Total profit
- $97,962
- Equity at exit
- $173,238
Cash invested: $70,000 (down + closing). Projections, not guarantees.
Landlord ↔ Tenant lean methodology
- Overall (STATE)
- 37 Tenant-Leaning
- State Hawaii
- 37 Tenant-Leaning · D+13
- County
- — inherits STATE
- City
- — inherits STATE
ZIP-level market 96737
- Active inventory
- 248
- Price-to-rent
- 9.9×
Monthly cashflow live
- Estimated rent
- $2,100 medium interval (Pro) →
- Mortgage (P&I)
- −$1,311
- Tax est. 1.5%
- −$312 /mo · $3,750/yr
- Insurance
- −$104
- HOA
- −$0
- Vacancy / Maint / Mgmt
- −$441
- Net cashflow
- $-69
Break-even live
Sensitivity live
| Price | -10% $104 | -5% $18 | +0% $-69 | +5% $-155 | +10% $-241 |
|---|---|---|---|---|---|
| Rent | -10% $-235 | -5% $-152 | +0% $-69 | +5% $14 | +10% $97 |
| Rate | -1.0pp $57 | -0.5pp $-5 | base $-69 | +0.5pp $-133 | +1.0pp $-199 |
UW: 25.0% down · 7.5% · 30yr · 1.5% tax · 5.0% vac · 8.0% maint · 8.0% mgmt
Financing live
Cash to close
- Down payment
- $62,500
- Closing costs
- $7,500
- Reserves months
- —
- Total cash needed
- —
Loan-product check · same deal, 3 products live
Conventional
25% down · 7.5% · 30yr
- Down + closing
- —
- Monthly P&I
- —
- Monthly cashflow
- —
- DSCR
- —
- Eligible?
- —
Personal DTI + credit; lowest rate.
DSCR
20% down · 8.5% · 30yr
- Down + closing
- —
- Monthly P&I
- —
- Monthly cashflow
- —
- DSCR
- —
- Eligible?
- —
No personal income docs; deal must DSCR.
Hard money
10% down · 12.0% · 12mo
- Down + closing
- —
- Monthly P&I
- —
- Monthly cashflow
- —
- DSCR
- —
- Eligible?
- —
Short-term bridge; refi at stabilization.
Rent comps 1 comps
| Address | Beds | Baths | Sqft | Rent | $/sqft | DOM | Units | Dist |
|---|---|---|---|---|---|---|---|---|
| 92-8611 Catamaran Ln Mountain View, HI | 3.0 | 2.0 | 1320 | $2,100 | $1.59 | 45d | 1 | 1.39mi |
Listing history 20 events
-
2026-06-21days on market $250,000 Active 27 DOM
-
2026-06-18days on market $250,000 Active 24 DOM
-
2026-06-17days on market $250,000 Active 23 DOM
-
2026-06-16days on market $250,000 Active 22 DOM
-
2026-06-15days on market $250,000 Active 21 DOM
-
2026-06-13days on market $250,000 Active 19 DOM
-
2026-06-13days on market $250,000 Active 18 DOM
-
2026-06-10days on market $250,000 Active 16 DOM
-
2026-06-09days on market $250,000 Active 15 DOM
-
2026-06-08days on market $250,000 Active 14 DOM
-
2026-06-07days on market $250,000 Active 13 DOM
-
2026-06-05days on market $250,000 Active 10 DOM
-
2026-06-03days on market $250,000 Active 9 DOM
-
2026-06-02days on market $250,000 Active 8 DOM
-
2026-06-01days on market $250,000 Active 7 DOM
-
2026-05-31days on market $250,000 Active 6 DOM
-
2026-05-25$250,000 Active
-
2023-09-29soldstatus $225,000 Sold 418-char remark
Show marketing remark (418 chars)
This 3 Bedroom, 2 bath home is on a nice corner lot in HOVE. . This home is permitted as a 2 Bedroom, 2 Bath. The carport has been enclosed to be the 3rd Bedroom. There is some beautiful trees, including a couple of large Jacarandas that when they bloom are beautiful. The driveway is a horse shoe, making it easy for in and out. The interior is in need of some TLC and therefore the price of this home reflects this.
-
2023-06-07historical Contingent 418-char remark
Show marketing remark (418 chars)
This 3 Bedroom, 2 bath home is on a nice corner lot in HOVE. . This home is permitted as a 2 Bedroom, 2 Bath. The carport has been enclosed to be the 3rd Bedroom. There is some beautiful trees, including a couple of large Jacarandas that when they bloom are beautiful. The driveway is a horse shoe, making it easy for in and out. The interior is in need of some TLC and therefore the price of this home reflects this.
-
2023-06-03$225,000 Active 418-char remark
Show marketing remark (418 chars)
This 3 Bedroom, 2 bath home is on a nice corner lot in HOVE. . This home is permitted as a 2 Bedroom, 2 Bath. The carport has been enclosed to be the 3rd Bedroom. There is some beautiful trees, including a couple of large Jacarandas that when they bloom are beautiful. The driveway is a horse shoe, making it easy for in and out. The interior is in need of some TLC and therefore the price of this home reflects this.
ⓘ Source: listings_history table (triggers on properties + properties_extension) + one-shot
backfill from property_details.listing_events for pre-trigger history.
Climate risk First Street
- Flood 1/10 Low FEMA zone X (unshaded) · 0% chance over 30 yrs
- Air quality 1/10 Low
Nearby sold comps map
Loading sold comps map…
Walkable amenities ~0.75 mi
Loading nearby amenities…
Taxation est. · year 1
- Rental income
- $25,200
- − Mortgage interest
- −$14,004
- − Property taxes
- −$3,750
- − Insurance
- −$1,250
- − Repairs & maintenance
- −$2,016
- − Management
- −$2,016
- − Depreciation
- −$7,273
- Taxable loss
- −$5,109
- Est. tax savings @ 24.0%
- +$1,226
- After-tax cash flow
- $402/yr
For passive investors: Depreciation is non-cash, so a rental often shows a tax loss while cash-flowing — sheltering income. Rental losses are passive: they offset passive income freely, and up to $25,000/yr can offset ordinary (W-2) income if you actively participate and your MAGI is under $100k (phasing out to $0 by $150k); unused losses carry forward. On sale, claimed depreciation is recaptured at up to 25%, and gains may owe capital-gains tax (a 1031 exchange can defer both). Figures are a year-1 estimate at your 24.0% rate — not tax advice; consult a CPA.
Condition & rehab AI · 4 photos
This property requires extensive renovation and repair work, including exterior siding, foundation, and landscaping. Immediate attention is needed to improve its condition and increase its resale and rental value.
Repairs flagged
- Major Exterior siding — Significant wear and tear
- Major Foundation — Exposed structural issues
- Major Landscaping — Overgrown vegetation
Value-add opportunities
- Both Exterior renovation — Improves curb appeal and overall property value
- Both Landscaping — Enhances curb appeal and property value
- Both Interior renovation — Improves living conditions and property value
Renovation cost estimate screening
| Repair item | Severity | Est. cost |
|---|---|---|
| Exterior siding · Significant wear and tear | Major | $15,000–50,000 |
| Foundation · Exposed structural issues | Major | $15,000–50,000 |
| Landscaping · Overgrown vegetation | Major | $15,000–50,000 |
| Total estimated repair cost · 3 items | $45,000–150,000 |
Value-add ROI direction
- Both Exterior renovation — Improves curb appeal and overall property value ↑
- Both Landscaping — Enhances curb appeal and property value ↑
- Both Interior renovation — Improves living conditions and property value ↑
ⓘ Cost ranges are severity-bucket heuristics (US national rule-of-thumb). Get contractor quotes + a written scope before underwriting a rehab budget.
Schools (NCES district)
- District
- Hawaii Department Of Education
- NCES district ID
- 1500030
- Math proficiency
- 32% ▼ -10.00%
- Reading proficiency
- 50% ▼ -3.00%
- Median HH income
- $69,005
- Composite
- 37.07/100
- National rank
- #4504
- State rank
- #1 of 1 in HI
Livability — Hawaiian Ocean View
- Score
- 48/100
- State rank
- #151
- US rank
- #26127
Category grades
Schools grade is shown separately in the Schools card above.
Census & demographics
- Census place
- Hawaiian Ocean View, HI
- City population
- 3,781
- Population (ZIP)
- 3,781
Population outlook (Hawaii County) Hauer SSP2
- Today (2025)
- 220,733 people
- By 2030
- 232,156 · +5.2%
- By 2040
- 252,486 · +14.4%
- By 2050
- 272,703 · +23.5%
- By 2075
- 332,113 · +50.5%
- By 2100
- 398,342 · +80.5%
Race, ethnicity, and origin ACS 2023
- Neighborhood character
- Highly diverse neighborhood (Simpson 0.81)
- Race & ethnicity
- Two or more races 42% White 39% Hispanic / Latino 16% Asian 6% Pacific Islander 6% Black 1% Native American 1%
- Hispanic origin (detail)
- Mexican 6% Puerto Rican 10%
- Common ancestry
- Portuguese 5% Scotch-Irish 4% Hispanic 4%
- Foreign-born
- 6% · Canada
- Languages at home
- 75% English-only · Other Asian/Pacific 10% Spanish 3% Russian/Polish/Slavic 2%
Political lean MEDSL · Hawaii
- 2024 margin
- Strong D (+28.3) · D 63.0% · R 34.7% · Other 2.3%
- 2008→2024 swing
- -25.4pp toward R · 2008: 53.7pp · 2024: 28.3pp
- All cycles
- 2024: D+28.3 2020: D+36.2 2016: D+36.6 2012: D+51.3 2008: D+53.7
Not yet ingested
- Civics
- —
Market trends
- HPI YoY
- —
- Current HPI
- —
- Rent YoY
- —
- Metro
- —
- State GDP YoY
- —
- F500 in state
- 0
Price history
+11.1% since first listed4 events — show timeline
- 2026-05-25 Listed $250,000 HI Information Service
- 2023-09-29 Sold (MLS) $225,000 HI Information Service
- 2023-06-07 Contingent — HI Information Service
- 2023-06-03 Listed $225,000 HI Information Service
Cash-flow waterfall
monthlySold comps — $/sqft
last 12 mo · ≤1 miLoading sold comps…