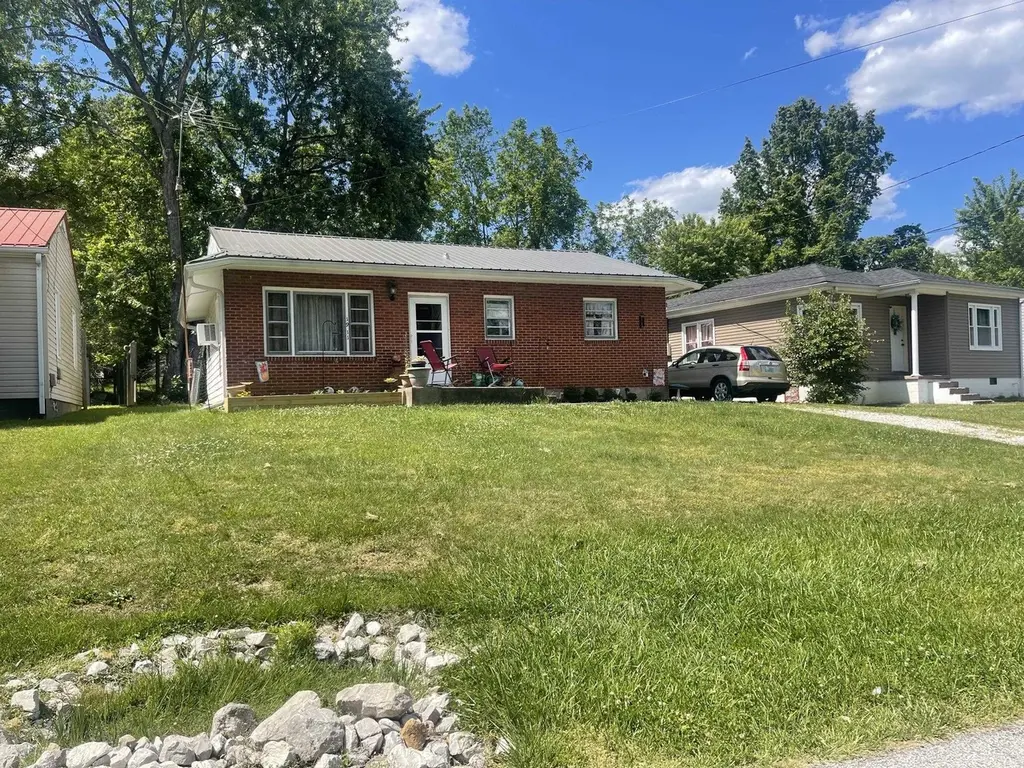
1911 Washington St · Flatwoods, KY
Flood risk 1/10 · Minimal
- FEMA flood zone
- —
- Chance of flooding over 30 yrs
- 0.0%
- Est. flood insurance / yr
- —
Fire risk 4/10 · Minor
- Est. fire insurance / yr
- $839 – $1,559
Heat risk 4/10 · Minor
- Hot days now (above 102°F)
- 7 days/yr
- Hot days in 30 yrs
- 19 days/yr
Wind risk 2/10 · Minimal
- Chance of severe wind over 30 yrs
- 2.0%
Air-quality risk 2/10 · Minimal
- Unhealthy air days now
- 0 days/yr
- Unhealthy air days in 30 yrs
- 2 days/yr
Risk factors via First Street. Map © Google.
Why this score? — see what drove the C+ grade
The composite is a weighted blend of 9 inputs, each scored 0–100. Each bar is that input's sub-score; the figure is the points it added to the 100-point composite (weight × sub-score).
- Cash flow +23.9/30.0
- ARV discount +15.0/15.0
- DSCR +7.7/10.0
- 1% rule +5.0/10.0
- Schools +3.8/10.0
- Livability +3.6/5.0
- Rent growth +2.5/5.0
- Condition / age +2.5/5.0
- Appreciation +0.0/10.0
$99,900
🖨 Deal sheet (PDF) 📄 Offer letter ✓ Due diligence
Listing remarks
Solid 3 bedroom, 1 bath in Flatwoods and Russell school district. Hardwood floors and fenced back yard.
Key facts
- Fenced back yard
- Built 1960
- Listed 7 days
Tags
Property features AI
Exterior
- Parking: No designated parking
- Utilities: Public water; Public sewer
- Home design: Single-family residential; Single-story entry (above grade finished area listed)
- Construction: Brick construction; Block foundation; Built area above grade: 936
- Exterior features: Level lot
Interior
- Kitchen: Electric range
- Bedrooms: Master bedroom on the downstairs/main level
- Bathrooms: 1 full bathroom
- Heating & cooling: Floor furnace heating
- Interior features: Master bedroom located on the main level; Total of 5 rooms
Neighborhood map
What this means for you Summary
Snapshot
- This is a 3-bed/1.0-bath single-family listed at $100k.
Deal economics
- At list price, monthly cash flow is $194 ($2k/yr) — positive.
- The deal already cash-flows at list — no discount required.
- Meets the 1% rule at list price ($1k rent vs $100k).
- Cap rate 8.6% vs local median 3.7% in Flatwoods — top-decile yield for the area; either an underpriced asset or a hidden risk that comps aren't pricing in. Stress-test before assuming the spread holds.
Location & tenants
- Location reads 72/100 on livability (#125 in KY) — a middle-class / working-renter tenant base. Strengths: crime A+, cost of living A+, housing A+; Watch: amenities F, commute F.
- Russell Independent (suburban): math 40% / reading 49% proficiency, ranked #22 of 165 in KY (top 13%) — families likely to look elsewhere, expect single-tenant / working-renter base with shorter leases.
- Zoned schools: Russell Primary School (486 students, 53% FRL); Russell Middle School (math 37% / reading 52%, grade D, #36 of 217 statewide, top 18%, 511 students, 44% FRL); Russell High School (math 42% / reading 47%, grade F, #21 of 254 statewide, top 10%, 668 students, 42% FRL).
- Market conditions: 42 active listings in the ZIP; 20 units permitted in Greenup County in 2024 (0 in 5+ unit buildings).
Forward outlook
- Local home prices are declining (-3.0%/yr); year-one equity from $691 of loan paydown is wiped out by about $3k of value loss. Plan a longer hold.
- Greenup County population projected at -19% by 2050 — secular population decline; favor cash flow + early exit over multi-decade hold.
Negotiation context
- Only 7 days on market — expect competitive offers; lowballing is unlikely to land.
- 2 sale attempts with the ask held roughly flat each time — persistent listings suggest the price (not the market) is what's stuck; bring a comps-based counter.
Questions for the listing agent
- Built in 1960 — when were the roof, HVAC, electrical panel, plumbing, and water heater last replaced?
- Is there a deadline driving the sale (1031 exchange, divorce, estate, relocation)? That informs how much negotiation room exists.
- Schools are B-rated — typically a magnet for longer-tenancy family renters. What's the average tenant stay here, and is there a school-zone premium baked into asking?
- What's the average days-on-market for RENTAL listings here right now (not sales)? A rising rental-DOM trend means longer vacancies and softer asking-rent achievability than the comps imply.
- What's the recent tenant-quality profile in this submarket — average credit score on applications, eviction rate, late-payment / NSF rate, and stable-employment percentage? A property-management company in the area should have these aggregated.
- How much new for-sale + rental construction is in the pipeline within 1–3 miles? Heavy new supply typically softens prices + rents 12–24 months out; constrained supply supports both.
Investment metrics
- 1% rule
- 1.00% ✓
- Cap rate
- 8.63%
- Cash-on-cash
- 8.34%
- DSCR
- 1.37
- GRM
- 8.3
CMA / ARV
- ARV (median comp)
- $127,500
- List price
- $99,900
- Delta
- -21.65%
- Verdict
- UNDERPRICED
- Comps
- 20 within 1.0 mi
Show comp detail 12 sales within ~0.75 mi
| Address | Dist | Beds/Ba | Sqft | Sold | Price | $/sf | Match |
|---|---|---|---|---|---|---|---|
| 2008 Washington Street St | 0.08mi | 2/1.0 (-1) | 952 (+2%) | 2mo | $60,000 | $63 | 87 |
| 1915 Washington Street St | 0.02mi | 2/1.0 (-1) | 896 (-4%) | 10mo | $70,000 | $78 | 78 |
| 1213 W Collins St | 0.47mi | 2/1.0 (-1) | 936 (0%) | 4mo | $25,000 | $27 | 70 |
| 1907 Washington St | 0.14mi | 3/1.0 | 1,065 (+14%) | 6mo | $162,400 | $152 | 65 |
| 1214 Napier St | 0.42mi | 2/1.0 (-1) | 1,000 (+7%) | 4mo | $112,200 | $112 | 61 |
| 2307 Sonya Ct | 0.55mi | 3/1.0 | 900 (-4%) | 11mo | $125,000 | $139 | 59 |
| 906 Charles St | 0.62mi | 3/1.0 | 864 (-8%) | 2mo | $149,000 | $172 | 57 |
| 2610 Roberts St | 0.64mi | 3/1.0 | 1,008 (+8%) | 1mo | $135,000 | $134 | 57 |
| 2606 Roberts St | 0.62mi | 2/1.0 (-1) | 949 (+1%) | 9mo | $130,000 | $137 | 56 |
| 1617 Callihan St | 0.36mi | 3/1.0 | 1,052 (+12%) | 11mo | $129,900 | $123 | 54 |
| 1501 Napier Street St | 0.50mi | 4/1.0 (+1) | 869 (-7%) | 14mo | $139,900 | $161 | 48 |
| 2615 Roberts St | 0.67mi | 3/1.0 | 1,071 (+14%) | 7mo | $138,000 | $129 | 39 |
Match score weights: distance 35% · size 25% · config 20% · recency 20%. Top-matched comps best support the ARV.
Projected returns pro-forma
-3.0% appreciation · 3.0% rent growth · sell at horizon
- IRR
- -3.7%
- Equity multiple
- 0.86×
- Total profit
- $-3,843
- Equity at exit
- $14,895
- IRR
- 6.0%
- Equity multiple
- 1.44×
- Total profit
- $12,432
- Equity at exit
- $8,638
Cash invested: $27,972 (down + closing). Projections, not guarantees.
Landlord ↔ Tenant lean methodology
- Overall (STATE)
- 83 Strongly Landlord-Friendly
- State Kentucky
- 83 Strongly Landlord-Friendly · R+16
- County
- — inherits STATE
- City
- — inherits STATE
ZIP-level market 41139
- Home prices YoY
- -6.4%
- Active inventory
- 42
- Price-to-rent
- 8.3×
Monthly cashflow live
- Estimated rent
- $1,002 medium interval (Pro) →
- Mortgage (P&I)
- −$524
- Tax from tax record
- −$32 /mo · $379/yr
- Insurance
- −$42
- HOA
- −$0
- Vacancy / Maint / Mgmt
- −$210
- Net cashflow
- $194
Break-even live
Sensitivity live
| Price | -10% $251 | -5% $223 | +0% $194 | +5% $166 | +10% $138 |
|---|---|---|---|---|---|
| Rent | -10% $115 | -5% $155 | +0% $194 | +5% $234 | +10% $274 |
| Rate | -1.0pp $245 | -0.5pp $220 | base $194 | +0.5pp $169 | +1.0pp $142 |
UW: 25.0% down · 7.5% · 30yr · 1.5% tax · 5.0% vac · 8.0% maint · 8.0% mgmt
Financing live
Cash to close
- Down payment
- $24,975
- Closing costs
- $2,997
- Reserves months
- —
- Total cash needed
- —
Loan-product check · same deal, 3 products live
Conventional
25% down · 7.5% · 30yr
- Down + closing
- —
- Monthly P&I
- —
- Monthly cashflow
- —
- DSCR
- —
- Eligible?
- —
Personal DTI + credit; lowest rate.
DSCR
20% down · 8.5% · 30yr
- Down + closing
- —
- Monthly P&I
- —
- Monthly cashflow
- —
- DSCR
- —
- Eligible?
- —
No personal income docs; deal must DSCR.
Hard money
10% down · 12.0% · 12mo
- Down + closing
- —
- Monthly P&I
- —
- Monthly cashflow
- —
- DSCR
- —
- Eligible?
- —
Short-term bridge; refi at stabilization.
Listing history 2 events
-
2026-05-13status Active 103-char remark
-
2026-05-11$99,900 Active 103-char remark
ⓘ Source: listings_history table (triggers on properties + properties_extension) + one-shot
backfill from property_details.listing_events for pre-trigger history.
Tax reassessment forecast KY · Resets to sale price
- Current annual tax
- $379 · $32/mo
- Projected year-2 tax
- $859 · $72/mo
- Expected delta
- +$480/yr (+$40/mo · 126.6%)
ⓘ Screening estimate from a state-policy table — verify with the county assessor before closing.
Climate risk First Street
- Flood 1/10 Low 0% chance over 30 yrs
- Wildfire 4/10 Moderate
- Heat 4/10 Moderate 7 d/yr ≥102°F today · 19 d/yr by 30 yrs out
- Wind 2/10 Low 2% chance of damaging wind over 30 yrs
- Air quality 2/10 Low 0 unhealthy d/yr today · 2 by 30 yrs out
Nearby sold comps map
Loading sold comps map…
Walkable amenities ~0.75 mi
Loading nearby amenities…
Taxation est. · year 1
- Rental income
- $12,024
- − Mortgage interest
- −$5,596
- − Property taxes
- −$379
- − Insurance
- −$500
- − Repairs & maintenance
- −$962
- − Management
- −$962
- − Depreciation
- −$2,906
- Taxable income
- $720
- Est. tax owed @ 24.0%
- −$173
- After-tax cash flow
- $2,161/yr
For passive investors: Depreciation is non-cash, so a rental often shows a tax loss while cash-flowing — sheltering income. Rental losses are passive: they offset passive income freely, and up to $25,000/yr can offset ordinary (W-2) income if you actively participate and your MAGI is under $100k (phasing out to $0 by $150k); unused losses carry forward. On sale, claimed depreciation is recaptured at up to 25%, and gains may owe capital-gains tax (a 1031 exchange can defer both). Figures are a year-1 estimate at your 24.0% rate — not tax advice; consult a CPA.
Schools (NCES district)
- District
- Russell Independent
- NCES district ID
- 2105130
- Math proficiency
- 40% ▼ -22.00%
- Reading proficiency
- 49% ▼ -18.00%
- Median HH income
- $49,382
- Composite
- 38.14/100
- National rank
- #4268
- State rank
- #22 of 165 in KY
Livability — Flatwoods
- Score
- 72/100
- State rank
- #125
- US rank
- #5872
Category grades
Schools grade is shown separately in the Schools card above.
Census & demographics
- Census place
- Flatwoods, KY
- County
- Greenup · 24,497 people
- City population
- 5,527
- Metro
- Huntington-Ashland, WV-KY-OH
- Population (ZIP)
- 8,258
- Household income
- $59,550
- Rent vs Own
- Severe rent burden
- 4.4
Population outlook (Greenup County) Hauer SSP2
- Today (2025)
- 34,374 people
- By 2030
- 33,145 · -3.6%
- By 2040
- 30,407 · -11.5%
- By 2050
- 27,702 · -19.4%
- By 2075
- 21,970 · -36.1%
- By 2100
- 16,670 · -51.5%
Race, ethnicity, and origin ACS 2023
- Neighborhood character
- Predominantly White (96%)
- Race & ethnicity
- White 96% Two or more races 3% Hispanic / Latino 1%
- Common ancestry
- Slovak 2% Serbian 1% Lithuanian 1%
- Foreign-born
- 1% · Canada
- Languages at home
- 99% English-only · Spanish 1%
Political lean MEDSL · Greenup
- 2024 margin
- Solid R (+50.5) · D 24.1% · R 74.6% · Other 1.3%
- 2008→2024 swing
- -36.4pp toward R · 2008: -14.1pp · 2024: -50.5pp
- All cycles
- 2024: R+50.5 2020: R+45.1 2016: R+45.5 2012: R+18.6 2008: R+14.1
Not yet ingested
- Civics
- —
Market trends
- HPI YoY
- ▼ -12.89%
- Current HPI
- 189.3977
- Rent YoY
- —
- Metro
- —
- State GDP YoY
- ▲ 1.81%
- F500 in state
- 4
Industry mix (Fortune 500 HQ in KY)
| Industry | F500 HQs | Revenue |
|---|---|---|
| Healthcare | 1 | $118B |
|
||
| Food / Beverage | 1 | $7B |
|
||
Price history
3 events — show timeline
- 2026-05-19 Pending — AABOR
- 2026-05-13 Relisted — AABOR
- 2026-05-11 Listed $99,900 AABOR
Property tax history
+0.5%/yrLatest (2025): $379 · +2.0% YoY. Source: county tax records.
Cash-flow waterfall
monthlySold comps — $/sqft
last 12 mo · ≤1 miLoading sold comps…