5961 Chrysler Cir · Coloma, CA
Flood risk 1/10 · Minimal
- FEMA flood zone
- X (unshaded)
- Chance of flooding over 30 yrs
- 0.0%
- Est. flood insurance / yr
- $507 – $1,088
Fire risk 10/10 · Severe
- Est. fire insurance / yr
- $659 – $1,223
Heat risk 6/10 · Moderate
- Hot days now (above 99°F)
- 7 days/yr
- Hot days in 30 yrs
- 16 days/yr
Wind risk 1/10 · Minimal
- Chance of severe wind over 30 yrs
- —
Air-quality risk 8/10 · Major
- Unhealthy air days now
- 18 days/yr
- Unhealthy air days in 30 yrs
- 23 days/yr
Risk factors via First Street. Map © Google.
Why this score? — see what drove the C+ grade
The composite is a weighted blend of 9 inputs, each scored 0–100. Each bar is that input's sub-score; the figure is the points it added to the 100-point composite (weight × sub-score).
- Cash flow +24.2/30.0
- ARV discount +15.0/15.0
- DSCR +7.8/10.0
- 1% rule +5.9/10.0
- Schools +3.0/10.0
- Livability +2.6/5.0
- Rent growth +2.5/5.0
- Condition / age +2.5/5.0
- Appreciation +0.0/10.0
$179,900
🖨 Deal sheet 📄 Offer letter ✓ Due diligence
Listing remarks
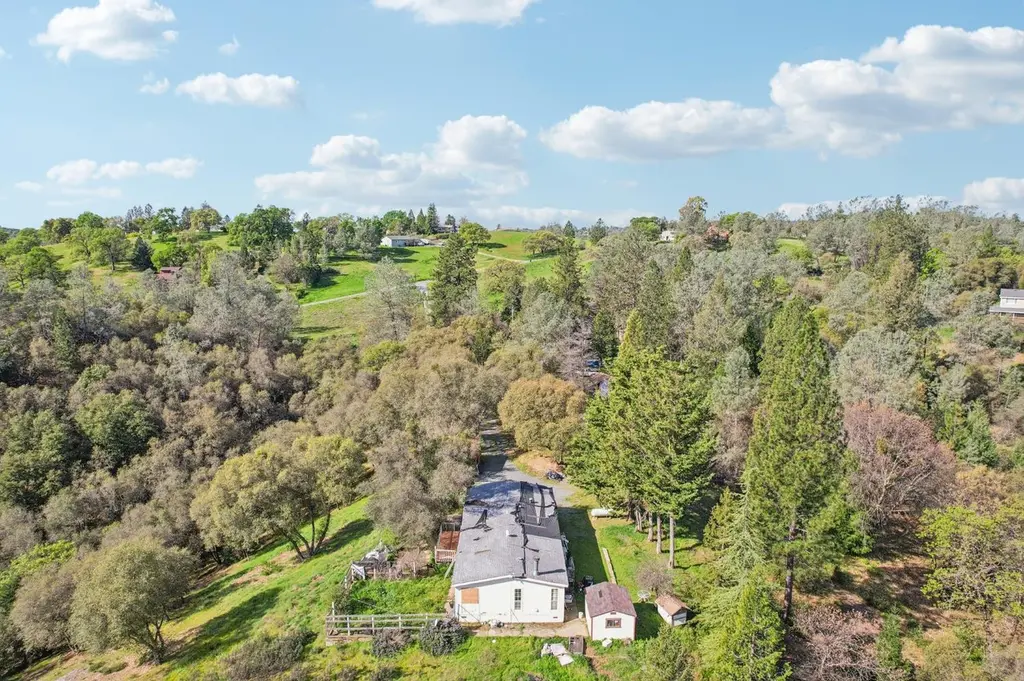
Bring your vision and unlock the potential of this scenic 4.22 acre Garden Valley property with sweeping panoramic views and a peaceful rural setting. The existing home suffered fire damage in one bedroom and some additional damage throughout. The property presents an amazing opportunity for buyers looking to remodel and restore the home or start new and build their dream home. Property is served by public water and septic. Step outside into a garden area filled with established plantings and endless potential. The property has previously supported a thriving garden with 4 hops varities, artichokes, ground cherries, tomatillos, tomatoes, thornless raspberries, thornless blackberries, and no
Key facts
- Thriving garden
- Garden area
- Panoramic views
Tags
Neighborhood map
What this means for you Summary
Snapshot
- This is a 3-bed/2.5-bath manufactured listed at $180k.
Deal economics
- At list price, monthly cash flow is $360 ($4k/yr) — positive.
- The deal already cash-flows at list — no discount required.
- Meets the 1% rule at list price ($2k rent vs $180k).
- Recommended offer: $169k (6.0% below list) — sets the bar for market timing.
Location & tenants
- Location reads 52/100 on livability (#1,003 in CA) — a working-class tenant base; expect higher turnover. Strengths: employment A+, housing A-; Watch: schools D, amenities F, commute F.
- Black Oak Mine Unified (rural): math 25% / reading 40% proficiency, ranked #278 of 517 in CA (top 54%) — families likely to look elsewhere, expect single-tenant / working-renter base with shorter leases.
- Market conditions: 33 active listings in the ZIP; 437 units permitted in El Dorado County in 2024 (0 in 5+ unit buildings).
Forward outlook
- Local home prices are declining (-3.0%/yr); year-one equity from $1k of loan paydown is wiped out by about $5k of value loss. Plan a longer hold.
- El Dorado County population projected to shrink 3% by 2050 — rents likely to lag national; underwrite the cash flow, not the appreciation.
Negotiation context
- It's been on market 81 days — a 6% lower offer ($169k) is reasonable based on typical stale-listing flexibility.
- Current owner paid $31k; list at $180k implies a 480% gain — meaningful room to come down on a strong offer.
Risks & watch-outs
- Climate carrying-cost: severe wildfire risk; extreme-heat days projected 7→16/yr by 2055 (HVAC capex compounding) — expect insurance premiums to compound above CPI over the hold.
Questions for the listing agent
- It's been on market 81 days. Have you received any prior offers? Is the seller open to a 6% concession, seller financing, or rate buy-down credit?
- Why hasn't it sold? Are there any deal-killer items the seller is aware of (foundation, flood, title, zoning, code violations)?
- Is there a deadline driving the sale (1031 exchange, divorce, estate, relocation)? That informs how much negotiation room exists.
- Schools are D-rated, which usually means shorter tenancies and higher turnover. Who's the typical renter profile here, and what's been the actual vacancy rate?
- What's the average days-on-market for RENTAL listings here right now (not sales)? A rising rental-DOM trend means longer vacancies and softer asking-rent achievability than the comps imply.
- What's the recent tenant-quality profile in this submarket — average credit score on applications, eviction rate, late-payment / NSF rate, and stable-employment percentage? A property-management company in the area should have these aggregated.
- How much new for-sale + rental construction is in the pipeline within 1–3 miles? Heavy new supply typically softens prices + rents 12–24 months out; constrained supply supports both.
Investment metrics
- 1% rule
- 1.09% ✓
- Cap rate
- 8.70%
- Cash-on-cash
- 8.58%
- DSCR
- 1.38
- GRM
- 7.6
CMA / ARV
- ARV (median comp)
- $301,000
- List price
- $179,900
- Delta
- -40.23%
- Verdict
- UNDERPRICED
- Comps
- 2 within 2.0 mi
Projected returns pro-forma
-3.0% appreciation · 3.0% rent growth · sell at horizon
- IRR
- -3.3%
- Equity multiple
- 0.88×
- Total profit
- $-6,213
- Equity at exit
- $26,824
- IRR
- 6.4%
- Equity multiple
- 1.48×
- Total profit
- $24,121
- Equity at exit
- $15,554
Cash invested: $50,372 (down + closing). Projections, not guarantees.
Landlord ↔ Tenant lean methodology
- Overall (STATE)
- 18 Strongly Tenant-Friendly
- State California
- 18 Strongly Tenant-Friendly · D+13
- County
- — inherits STATE
- City
- — inherits STATE
ZIP-level market 95633
- Home prices YoY
- -5.1%
- Active inventory
- 33
- Price-to-rent
- 7.6×
Monthly cashflow live
- Estimated rent
- $1,964 medium interval (Pro) →
- Mortgage (P&I)
- −$943
- Tax from tax record
- −$173 /mo · $2,075/yr
- Insurance
- −$75
- HOA
- −$0
- Vacancy / Maint / Mgmt
- −$412
- Net cashflow
- $360
Break-even live
UW: 25.0% down · 7.5% · 30yr · 1.5% tax · 5.0% vac · 8.0% maint · 8.0% mgmt
Financing live
Cash to close
- Down payment
- $44,975
- Closing costs
- $5,397
- Reserves months
- —
- Total cash needed
- —
Loan-product check · same deal, 3 products live
Conventional
25% down · 7.5% · 30yr
- Down + closing
- —
- Monthly P&I
- —
- Monthly cashflow
- —
- DSCR
- —
- Eligible?
- —
Personal DTI + credit; lowest rate.
DSCR
20% down · 8.5% · 30yr
- Down + closing
- —
- Monthly P&I
- —
- Monthly cashflow
- —
- DSCR
- —
- Eligible?
- —
No personal income docs; deal must DSCR.
Hard money
10% down · 12.0% · 12mo
- Down + closing
- —
- Monthly P&I
- —
- Monthly cashflow
- —
- DSCR
- —
- Eligible?
- —
Short-term bridge; refi at stabilization.
Listing history 15 events
-
2026-06-18days on market $179,900 Active 81 DOM
-
2026-06-17days on market $179,900 Active 80 DOM
-
2026-06-16days on market $179,900 Active 79 DOM
-
2026-06-15days on market $179,900 Active 78 DOM
-
2026-06-13days on market $179,900 Active 76 DOM
-
2026-06-13days on market $179,900 Active 75 DOM
-
2026-06-09days on market $179,900 Active 72 DOM
-
2026-06-08days on market $179,900 Active 71 DOM
-
2026-06-07days on market $179,900 Active 70 DOM
-
2026-06-05days on market $179,900 Active 67 DOM
-
2026-06-03days on market $179,900 Active 66 DOM
-
2026-06-02days on market $179,900 Active 65 DOM
-
2026-06-01days on market $179,900 Active 64 DOM
-
2026-05-31days on market $179,900 Active 63 DOM
-
1988-12-28soldstatus $31,000
ⓘ Source: listings_history table (triggers on properties + properties_extension) + one-shot
backfill from property_details.listing_events for pre-trigger history.
Tax reassessment forecast CA · Resets to sale price
- Current annual tax
- $2,075 · $173/mo
- Projected year-2 tax
- $2,075 · $173/mo
- Expected delta
- $0/yr ($0/mo · 0.0%)
ⓘ Screening estimate from a state-policy table — verify with the county assessor before closing.
Climate risk First Street
- Flood 1/10 Low FEMA zone X (unshaded) · 0% chance over 30 yrs
- Wildfire 10/10 Extreme
- Heat 6/10 Major 7 d/yr ≥99°F today · 16 d/yr by 30 yrs out
- Wind 1/10 Low
- Air quality 8/10 Severe 18 unhealthy d/yr today · 23 by 30 yrs out
Nearby sold comps map
Loading sold comps map…
Walkable amenities ~0.75 mi
Loading nearby amenities…
Taxation est. · year 1
- Rental income
- $23,567
- − Mortgage interest
- −$10,077
- − Property taxes
- −$2,075
- − Insurance
- −$900
- − Repairs & maintenance
- −$1,885
- − Management
- −$1,885
- − Depreciation
- −$5,233
- Taxable income
- $1,511
- Est. tax owed @ 24.0%
- −$363
- After-tax cash flow
- $3,960/yr
For passive investors: Depreciation is non-cash, so a rental often shows a tax loss while cash-flowing — sheltering income. Rental losses are passive: they offset passive income freely, and up to $25,000/yr can offset ordinary (W-2) income if you actively participate and your MAGI is under $100k (phasing out to $0 by $150k); unused losses carry forward. On sale, claimed depreciation is recaptured at up to 25%, and gains may owe capital-gains tax (a 1031 exchange can defer both). Figures are a year-1 estimate at your 24.0% rate — not tax advice; consult a CPA.
Schools (NCES district)
- District
- Black Oak Mine Unified
- NCES district ID
- 0605240
- Math proficiency
- 25% ▼ -3.00%
- Reading proficiency
- 40% ▼ -4.00%
- Median HH income
- $68,195
- Composite
- 29.96/100
- National rank
- #6371
- State rank
- #278 of 517 in CA
Livability — Coloma
- Score
- 52/100
- State rank
- #1003
- US rank
- #24847
Category grades
Schools grade is shown separately in the Schools card above.
Census & demographics
- Population (ZIP)
- 2,653
Population outlook (El Dorado County) Hauer SSP2
- Today (2025)
- 191,666 people
- By 2030
- 193,662 · +1.0%
- By 2040
- 192,583 · +0.5%
- By 2050
- 185,904 · -3.0%
- By 2075
- 169,543 · -11.5%
- By 2100
- 139,623 · -27.2%
Race, ethnicity, and origin ACS 2023
- Neighborhood character
- Predominantly White (77%)
- Race & ethnicity
- White 77% Hispanic / Latino 16% Two or more races 7% Asian 2%
- Hispanic origin (detail)
- Mexican 10%
- Common ancestry
- Lithuanian 4% Scotch-Irish 2% Italian 2%
- Foreign-born
- 7% · Vietnam
- Languages at home
- 91% English-only · Russian/Polish/Slavic 5% Spanish 3% French/Haitian/Cajun 1%
Political lean MEDSL · El Dorado
- 2024 margin
- R (+12.0) · D 42.6% · R 54.6% · Other 2.8%
- 2008→2024 swing
- -1.5pp toward R · 2008: -10.5pp · 2024: -12.0pp
- All cycles
- 2024: R+12.0 2020: R+8.8 2016: R+13.9 2012: R+18.2 2008: R+10.5
Not yet ingested
- Civics
- —
Market trends
- HPI YoY
- ▼ -13.98%
- Current HPI
- 258.0369
- Rent YoY
- —
- Metro
- —
- State GDP YoY
- ▲ 3.21%
- F500 in state
- 116
Industry mix (Fortune 500 HQ in CA)
| Industry | F500 HQs | Revenue |
|---|---|---|
| Technology | 27 | $1,492B |
|
||
| Financial Services | 3 | $174B |
|
||
| Retail | 3 | $44B |
|
||
| Insurance | 3 | $26B |
|
||
| Media / Entertainment | 2 | $115B |
|
||
| Pharmaceuticals / Biotech | 2 | $62B |
|
||
Price history
1 event — show timeline
- 1988-12-28 Sold (Public Records) $31,000 Public Records
Property tax history
+2.2%/yrLatest (2025): $2,075 · +5.7% YoY. Source: county tax records.
Cash-flow waterfall
monthlySold comps — $/sqft
last 12 mo · ≤1 miLoading sold comps…