 🔨 Auction
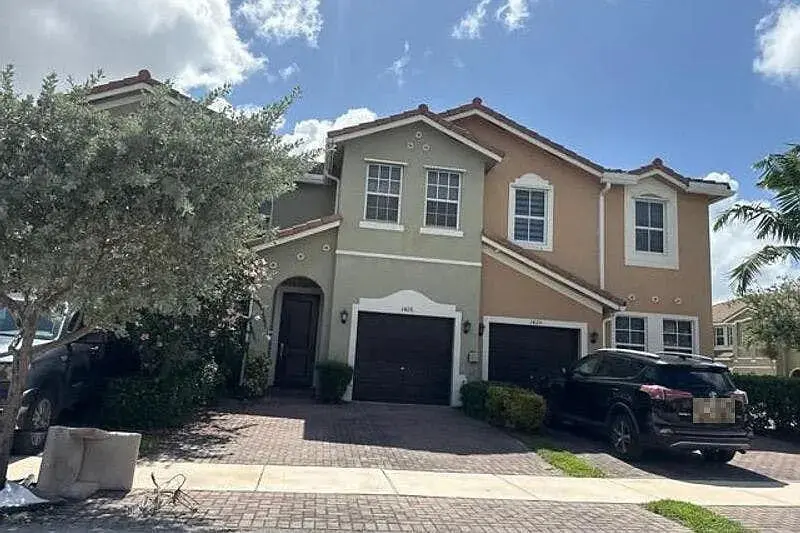
1426 SE 24th Ter · Homestead, FL
Flood risk 6/10 · Moderate
- FEMA flood zone
- AH
- Chance of flooding over 30 yrs
- 0.56%
- Est. flood insurance / yr
- $1,142 – $2,507
Fire risk 1/10 · Minimal
- Est. fire insurance / yr
- $947 – $1,759
Heat risk 10/10 · Severe
- Hot days now (above 106°F)
- 7 days/yr
- Hot days in 30 yrs
- 32 days/yr
Wind risk 10/10 · Severe
- Chance of severe wind over 30 yrs
- 99.0%
Air-quality risk 2/10 · Minimal
- Unhealthy air days now
- 1 days/yr
- Unhealthy air days in 30 yrs
- 1 days/yr
Risk factors via First Street. Map © Google.
Why this score? — see what drove the F grade
The composite is a weighted blend of 9 inputs, each scored 0–100. Each bar is that input's sub-score; the figure is the points it added to the 100-point composite (weight × sub-score).
- Cash flow +7.6/30.0
- ARV discount +7.5/15.0
- Schools +4.2/10.0
- Livability +3.9/5.0
- Condition / age +2.5/5.0
- Appreciation +2.4/10.0
- 1% rule +2.2/10.0
- DSCR +1.7/10.0
- Rent growth +1.7/5.0
$5,000
🖨 Deal sheet 📄 Offer letter ✓ Due diligence
Listing remarks
Foreclosure Auction Ends June 22, 2026 at 9:00 AM EST. Explore this charming 3-bedroom, 2.5-bath residence set in a peaceful and well-located Homestead community. The list price is the opening bid for the online auction. Sold As-is. Explore more details and submit your bid through Federa Home App.
Key facts
- Built 2020
- Listed 6 days
Property features AI
Finance
- Other: Zoning: Other
- Financial info: Property listed for auction
- HOA & community: No association fee; Association fee covers other items (see remarks); No first right of refusal
Exterior
- Utilities: Utilities: other (see remarks)
- Home design: Other property type; Built in 2020; Less than 1/4 acre lot; Facing Bay/Gulf side
- Construction: Other construction; Not above flood
- Exterior features: No waterfront or waterview; Pets allowed with conditions (see remarks); No deed restrictions
Interior
- Bedrooms: Bedroom 1; Bedroom 2; Bedroom 3
- Bathrooms: 2 full bathrooms; 1 half bathroom
- Interior features: Other appliances (see remarks)
Neighborhood map
What this means for you Summary
Snapshot
- This is a 3-bed/2.0-bath townhouse listed at $5k.
Deal economics
- At list price, monthly cash flow is $-593 ($-7k/yr) — negative.
- The deal already cash-flows at list — no discount required.
- Meets the 1% rule at list price ($3k rent vs $5k).
- Cap rate 4.9% vs local median 3.5% in Homestead — top-decile yield for the area; either an underpriced asset or a hidden risk that comps aren't pricing in. Stress-test before assuming the spread holds.
Location & tenants
- Location reads 78/100 on livability (#158 in FL, #2,408 nationally) — a middle-class / working-renter tenant base. Strengths: commute A+, housing A+, health & safety A+; Watch: employment C-.
- Miami-Dade (suburban): math 45% / reading 54% proficiency, ranked #40 of 73 in FL (top 55%) — families likely to look elsewhere, expect single-tenant / working-renter base with shorter leases; 64% free/reduced lunch — lower-income household profile, screen leases tightly.
- Market conditions: Rents falling (-3.2%/yr); 462 active listings in the ZIP; 40 comparable units currently listed for rent nearby; rentals at typical pace (median 24d on market — plan ~3-4 weeks tenant-placement turnaround); 10,051 units permitted in Miami-Dade County in 2024 (7,758 in 5+ unit buildings).
- At $2,667/mo this rent would consume 47% of the median local household income ($68k/yr) (locally 687% of renters already pay >50% of income on rent) — very limited rent-growth headroom before tenants either downsize or default.
Forward outlook
- Local home prices are declining (-3.0%/yr); year-one equity from $3k of loan paydown is wiped out by about $11k of value loss. Plan a longer hold.
- Miami-Dade County population projected at +28% by 2050 — long-run rental-demand tailwind backs the buy-and-hold thesis.
Negotiation context
- Only 6 days on market — expect competitive offers; lowballing is unlikely to land.
- 2 sale attempts with the ask held roughly flat each time — persistent listings suggest the price (not the market) is what's stuck; bring a comps-based counter.
Risks & watch-outs
- Watch-outs: property tax is 110.6% of price; flood insurance adds $152/mo.
- Climate carrying-cost: in FEMA flood zone AH (mandatory federal flood insurance); severe wind risk, 99% chance of damaging wind over 30y; extreme-heat days projected 7→32/yr by 2055 (HVAC capex compounding) — expect insurance premiums to compound above CPI over the hold.
Questions for the listing agent
- What do current leases actually rent for vs. the listed asking? Can we see a recent rent roll and the last 12 months of T-12 income?
- Property tax is high relative to price — has the assessment been appealed recently, and will the sale trigger a re-assessment?
- What's the actual annual flood-insurance premium (NFIP or private), and is the property in a SFHA with mandatory coverage?
- Is there a deadline driving the sale (1031 exchange, divorce, estate, relocation)? That informs how much negotiation room exists.
- Schools are B-rated — typically a magnet for longer-tenancy family renters. What's the average tenant stay here, and is there a school-zone premium baked into asking?
- The area grade is low — what's the realistic commute time and amenity access for the typical tenant pool here? Any planned neighborhood developments (good or bad) we should know about?
- What's the average days-on-market for RENTAL listings here right now (not sales)? A rising rental-DOM trend means longer vacancies and softer asking-rent achievability than the comps imply.
- What's the recent tenant-quality profile in this submarket — average credit score on applications, eviction rate, late-payment / NSF rate, and stable-employment percentage? A property-management company in the area should have these aggregated.
- How much new for-sale + rental construction is in the pipeline within 1–3 miles? Heavy new supply typically softens prices + rents 12–24 months out; constrained supply supports both.
Investment metrics
- 1% rule
- 0.72% ✗
- Cap rate
- 4.86%
- Cash-on-cash
- -5.12%
- DSCR
- 0.77
- GRM
- 11.5
CMA / ARV
- ARV (on-the-fly)
- $368,703
- Comps found
- 5
Show comp detail 5 sales within ~0.75 mi
| Address | Dist | Beds/Ba | Sqft | Sold | Price | $/sf | Match |
|---|---|---|---|---|---|---|---|
| 2653 SE 13th Ct | 0.33mi | 3/2.5 | 1,827 (+6%) | 4mo | $355,000 | $194 | 70 |
| 2350 SE 19th Ct | 0.18mi | 4/2.5 (+1) | 1,890 (+9%) | 10mo | $355,000 | $188 | 61 |
| 2591 SE 25th Ct | 0.63mi | 4/2.5 (+1) | 1,828 (+6%) | 2mo | $458,690 | $251 | 53 |
| 2592 SE 15th Ct #2592 | 0.28mi | 4/3.0 (+1) | 1,952 (+13%) | 24mo | $415,000 | $213 | 37 |
| 2707 SE 15th Ct Unit . | 0.44mi | 3/2.5 | 1,483 (-14%) | 21mo | $370,000 | $249 | 36 |
Match score weights: distance 35% · size 25% · config 20% · recency 20%. Top-matched comps best support the ARV.
Projected returns pro-forma
-3.0% appreciation · 0.0% rent growth · sell at horizon
- IRR
- -31.8%
- Equity multiple
- -0.02×
- Total profit
- $-105,183
- Equity at exit
- $54,975
- IRR
- -59.2%
- Equity multiple
- -0.65×
- Total profit
- $-169,874
- Equity at exit
- $31,879
Cash invested: $103,237 (down + closing). Projections, not guarantees.
Landlord ↔ Tenant lean methodology
- Overall (STATE)
- 87 Strongly Landlord-Friendly
- State Florida
- 87 Strongly Landlord-Friendly · R+3
- County
- — inherits STATE
- City
- — inherits STATE
ZIP-level market 33035
- Home prices YoY
- -1.4%
- Rents YoY
- -3.2%
- Active inventory
- 462
- Price-to-rent
- 0.2×
Monthly cashflow live
- Estimated rent
- $2,667 high interval (Pro) →
- Mortgage (P&I)
- −$1,934
- Tax est. 1.5%
- −$461 /mo · $5,531/yr
- Insurance
- −$154
- Flood insurance flood zone
- −$152 /mo · $1,824/yr
- HOA
- −$0
- Vacancy / Maint / Mgmt
- −$560
- Net cashflow
- $-593
Break-even live
UW: 25.0% down · 7.5% · 30yr · 1.5% tax · 5.0% vac · 8.0% maint · 8.0% mgmt
Financing live
Cash to close
- Down payment
- $92,176
- Closing costs
- $11,061
- Reserves months
- —
- Total cash needed
- —
Loan-product check · same deal, 3 products live
Conventional
25% down · 7.5% · 30yr
- Down + closing
- —
- Monthly P&I
- —
- Monthly cashflow
- —
- DSCR
- —
- Eligible?
- —
Personal DTI + credit; lowest rate.
DSCR
20% down · 8.5% · 30yr
- Down + closing
- —
- Monthly P&I
- —
- Monthly cashflow
- —
- DSCR
- —
- Eligible?
- —
No personal income docs; deal must DSCR.
Hard money
10% down · 12.0% · 12mo
- Down + closing
- —
- Monthly P&I
- —
- Monthly cashflow
- —
- DSCR
- —
- Eligible?
- —
Short-term bridge; refi at stabilization.
Rent comps 40 comps
| Address | Beds | Baths | Sqft | Rent | $/sqft | DOM | Units | Dist |
|---|---|---|---|---|---|---|---|---|
| 2407 SE 14th St Homestead, FL | 3.0 | 3.0 | 1704 | $2,550 | $1.50 | 15d | 1 | 0.04mi |
| 1427 SE 24th Rd Homestead, FL | 4.0 | 3.0 | 1964 | $2,955 | $1.50 | 24d | 1 | 0.09mi |
| 2746 SE 24th Ter Unit 2746 Homestead, FL | 3.0 | 2.5 | 1828 | $2,650 | $1.45 | 22d | 1 | 0.09mi |
| 2470 SE 15th Ct #2470 Homestead, FL | 4.0 | 3.0 | 1883 | $3,000 | $1.59 | 24d | 1 | 0.12mi |
| 2424 SE 19th Ct Unit 2424 Homestead, FL | 2.0 | 2.5 | 1431 | $2,200 | $1.54 | 12d | 1 | 0.16mi |
| 2764 SE 26th Ave Unit 2764 Homestead, FL | 3.0 | 2.5 | 1483 | $2,450 | $1.65 | 3d | 1 | 0.18mi |
| 2764 SE 26th Ave Unit 2764 Homestead, FL | 3.0 | 2.5 | 1483 | $2,499 | $1.69 | 24d | 1 | 0.18mi |
| 1904 SE 23rd Ave Unit 1904 Homestead, FL | 3.0 | 2.5 | 1854 | $2,750 | $1.48 | 7d | 1 | 0.18mi |
| 1904 SE 23rd Ave Unit 1904 Homestead, FL | 3.0 | 2.5 | 1854 | $2,800 | $1.51 | 24d | 1 | 0.18mi |
| 1575 SE 20th Rd Homestead, FL | 3.0 | 2.0 | 1693 | $2,850 | $1.68 | 24d | 1 | 0.19mi |
| 1575 SE 20th Rd Homestead, FL | 3.0 | 2.0 | 1693 | $2,850 | $1.68 | 7d | 1 | 0.19mi |
| 1916 SE 23rd Ave #1916 Homestead, FL | 3.0 | 2.5 | 1932 | $2,500 | $1.29 | 10d | 1 | 0.20mi |
| 1916 SE 23rd Ave #1916 Homestead, FL | 3.0 | 2.5 | 1932 | $2,500 | $1.29 | 3d | 1 | 0.20mi |
| 1645 SE 20th Rd Unit 1645 Homestead, FL | 3.0 | 2.5 | 1874 | $2,750 | $1.47 | 22d | 1 | 0.20mi |
| 2532 SE 15th Ct Unit 2532 Homestead, FL | 3.0 | 3.0 | 1704 | $2,500 | $1.47 | 14d | 1 | 0.21mi |
| 1328 SE 26th Ter Homestead, FL | 3.0 | 2.5 | 1695 | $2,800 | $1.65 | 24d | 1 | 0.21mi |
| 1158 SE 23rd Ave Unit 1158 Homestead, FL | 3.0 | 2.0 | 1302 | $2,400 | $1.84 | 16d | 1 | 0.21mi |
| 1158 SE 23rd Ave Homestead, FL | 3.0 | 2.0 | 1302 | $2,450 | $1.88 | 18d | 1 | 0.21mi |
| 2525 SE 19th Pl Unit 105B Homestead, FL | 3.0 | 2.0 | 1220 | $2,200 | $1.80 | 24d | 1 | 0.23mi |
| 2201 SE 24th Pl #2201 Homestead, FL | 2.0 | 2.5 | 1370 | $1,850 | $1.35 | 24d | 1 | 0.23mi |
| 2414 SE 21st St Homestead, FL | 2.0 | 2.5 | 1431 | $2,500 | $1.75 | 24d | 1 | 0.24mi |
| 1140 SE 24th Rd Homestead, FL | 3.0–4.0 | 2.5–3.0 | 1444 | $2,377 | $1.65 | 2d | 12 | 0.24mi |
| 2613 SE 13th Ct Homestead, FL | 3.0 | 2.5 | 1697 | $2,600 | $1.53 | 24d | 1 | 0.25mi |
| 2367 SE 11th St Unit 2367 Homestead, FL | 3.0 | 2.5 | 1302 | $2,600 | $2.00 | 24d | 1 | 0.26mi |
| 2367 SE 11th St Unit 2367 Homestead, FL | 3.0 | 2.5 | 1302 | $2,500 | $1.92 | 3d | 1 | 0.26mi |
| 2341 SE 11th St Homestead, FL | 4.0 | 3.0 | 1374 | $2,998 | $2.18 | 22d | 1 | 0.26mi |
| 2209 SE 24th Pl #2209 Homestead, FL | 4.0 | 2.5 | 1846 | $2,700 | $1.46 | 22d | 1 | 0.27mi |
| 1120 SE 26th Ter Unit 1120 Homestead, FL | 3.0 | 2.5 | 1827 | $2,800 | $1.53 | 4d | 1 | 0.27mi |
| 2615 SE 12th St Homestead, FL | 3.0 | 2.5 | 1827 | $2,700 | $1.48 | 24d | 1 | 0.27mi |
| 2732 SE 26th Ave Unit 2732 Homestead, FL | 3.0 | 2.5 | 1414 | $2,500 | $1.77 | 24d | 1 | 0.27mi |
| 1092 SE 23rd Ave #1092 Homestead, FL | 3.0 | 2.5 | 1302 | $2,400 | $1.84 | 24d | 1 | 0.27mi |
| 2430 SE 10th Ct Homestead, FL | 4.0 | 3.0 | 1374 | $3,100 | $2.26 | 24d | 1 | 0.28mi |
| 2605 SE 11th Ct Unit Labs Homestead, FL | 3.0 | 2.5 | 1827 | $2,800 | $1.53 | 24d | 1 | 0.28mi |
| 1980 SE 23rd Ave Unit 1980 Homestead, FL | 3.0 | 2.5 | 1932 | $2,400 | $1.24 | 24d | 1 | 0.28mi |
| 2448 SE 10th Ct Homestead, FL | 4.0 | 3.0 | 1374 | $2,600 | $1.89 | 5d | 1 | 0.28mi |
| 1078 SE 23rd Ter Unit 1078 Homestead, FL | 4.0 | 3.0 | 1374 | $2,750 | $2.00 | 4d | 1 | 0.28mi |
| 2615 SE 12th St #2615 Homestead, FL | 3.0 | 3.0 | 1827 | $2,800 | $1.53 | 24d | 1 | 0.29mi |
| 2205 SE 23rd Rd Homestead, FL | 3.0 | 2.5 | 1452 | $2,600 | $1.79 | 24d | 1 | 0.29mi |
| 2608 SE 11th St #2608 Homestead, FL | 3.0 | 2.5 | 1827 | $2,800 | $1.53 | 24d | 1 | 0.30mi |
| 2601 SE 19th Ct Homestead, FL | 2.0 | 2.0 | 1070 | $2,300 | $2.15 | 24d | 1 | 0.30mi |
Listing history 6 events
-
2026-06-18days on market $5,000 Active 6 DOM
-
2026-06-17days on market $5,000 Active 5 DOM
-
2026-06-16days on market $5,000 Active 4 DOM
-
2026-06-15days on market $5,000 Active 3 DOM
-
2026-06-13remarks 298-char remark
-
2026-06-13$5,000 Active 1 DOM
ⓘ Source: listings_history table (triggers on properties + properties_extension) + one-shot
backfill from property_details.listing_events for pre-trigger history.
Climate risk First Street
- Flood 6/10 Major FEMA zone AH · 56% chance over 30 yrs
- Wildfire 1/10 Low
- Heat 10/10 Extreme 7 d/yr ≥106°F today · 32 d/yr by 30 yrs out
- Wind 10/10 Extreme 99% chance of damaging wind over 30 yrs
- Air quality 2/10 Low 1 unhealthy d/yr today · 1 by 30 yrs out
Nearby sold comps map
Loading sold comps map…
Walkable amenities ~0.75 mi
Loading nearby amenities…
Taxation est. · year 1
- Rental income
- $32,010
- − Mortgage interest
- −$20,653
- − Property taxes
- −$5,531
- − Insurance
- −$3,668
- − Repairs & maintenance
- −$2,561
- − Management
- −$2,561
- − Depreciation
- −$10,726
- Taxable loss
- −$13,690
- Est. tax savings @ 24.0%
- +$3,285
- After-tax cash flow
- $-3,828/yr
For passive investors: Depreciation is non-cash, so a rental often shows a tax loss while cash-flowing — sheltering income. Rental losses are passive: they offset passive income freely, and up to $25,000/yr can offset ordinary (W-2) income if you actively participate and your MAGI is under $100k (phasing out to $0 by $150k); unused losses carry forward. On sale, claimed depreciation is recaptured at up to 25%, and gains may owe capital-gains tax (a 1031 exchange can defer both). Figures are a year-1 estimate at your 24.0% rate — not tax advice; consult a CPA.
Schools (NCES district)
- District
- Miami-Dade
- NCES district ID
- 1200390
- Math proficiency
- 45% ▼ -16.00%
- Reading proficiency
- 54% ▼ -5.00%
- Median HH income
- $43,928
- Composite
- 41.76/100
- National rank
- #3397
- State rank
- #40 of 73 in FL
Livability — Homestead
- Score
- 78/100
- State rank
- #158
- US rank
- #2408
Category grades
Schools grade is shown separately in the Schools card above.
Census & demographics
- Census place
- Homestead, FL
- County
- Miami-Dade County · 2,697,751 people
- City population
- 191,470
- Metro
- Miami-Fort Lauderdale-Pompano Beach, FL
- Population (ZIP)
- 17,202
- Household income
- $68,354
- Rent vs Own
- Severe rent burden
- 687.0
Population outlook (Miami-Dade County) Hauer SSP2
- Today (2025)
- 3,126,439 people
- By 2030
- 3,325,765 · +6.4%
- By 2040
- 3,697,561 · +18.3%
- By 2050
- 4,012,134 · +28.3%
- By 2075
- 4,605,612 · +47.3%
- By 2100
- 4,866,598 · +55.7%
Race, ethnicity, and origin ACS 2023
- Neighborhood character
- Diverse neighborhood (Simpson 0.55)
- Race & ethnicity
- Hispanic / Latino 63% Two or more races 35% Black 18% White 12%
- Hispanic origin (detail)
- Mexican 6% Puerto Rican 13% Cuban 25% Dominican 2% Salvadoran 1%
- Common ancestry
- Hispanic 6% Lithuanian 3% Estonian 1%
- Foreign-born
- 33% · Canada, Dominican Republic, Jamaica
- Languages at home
- 32% English-only · Spanish 60% French/Haitian/Cajun 7% Other Indo-European 1%
Political lean MEDSL · Miami-Dade
- 2024 margin
- R (+11.4) · D 43.9% · R 55.4%
- 2008→2024 swing
- -27.6pp toward R · 2008: 16.1pp · 2024: -11.4pp
- All cycles
- 2024: R+11.4 2020: D+7.3 2016: D+29.6 2012: D+23.7 2008: D+16.1
Not yet ingested
- Civics
- —
Market trends
- HPI YoY
- ▼ -5.24%
- Current HPI
- 369.3031
- Rent YoY
- ▼ -3.20%
- Metro
- Miami-Fort Lauderdale-Pompano Beach, FL
- State GDP YoY
- ▲ 3.28%
- F500 in state
- 36
Industry mix (Fortune 500 HQ in FL)
| Industry | F500 HQs | Revenue |
|---|---|---|
| Industrial Technology | 2 | $29B |
|
||
| Insurance | 2 | $17B |
|
||
| Retail | 1 | $60B |
|
||
| Technology Distribution | 1 | $58B |
|
||
| Homebuilding | 1 | $35B |
|
||
| Technology Manufacturing | 1 | $35B |
|
||
Price history
-99.5% since first listed9 events — show timeline
- 2026-06-12 Listed $5,000 FLKMLS
- 2025-11-05 Pending — MARMLS
- 2025-11-04 Listing Removed — MARMLS
- 2025-10-28 Price Changed $352,900 MARMLS
- 2025-10-16 Listed $359,900 MARMLS
- 2016-10-19 Sold (Public Records) $3,200,000 Public Records
- 2014-03-24 Sold (Public Records) $1,740,600 Public Records
- 2012-01-11 Sold (Public Records) $595,700 Public Records
- 2008-07-02 Sold (Public Records) $981,200 Public Records
Property tax history
+9.6%/yrLatest (2025): $6,500 · +7.4% YoY. Source: county tax records.
Cash-flow waterfall
monthlySold comps — $/sqft
last 12 mo · ≤1 miLoading sold comps…