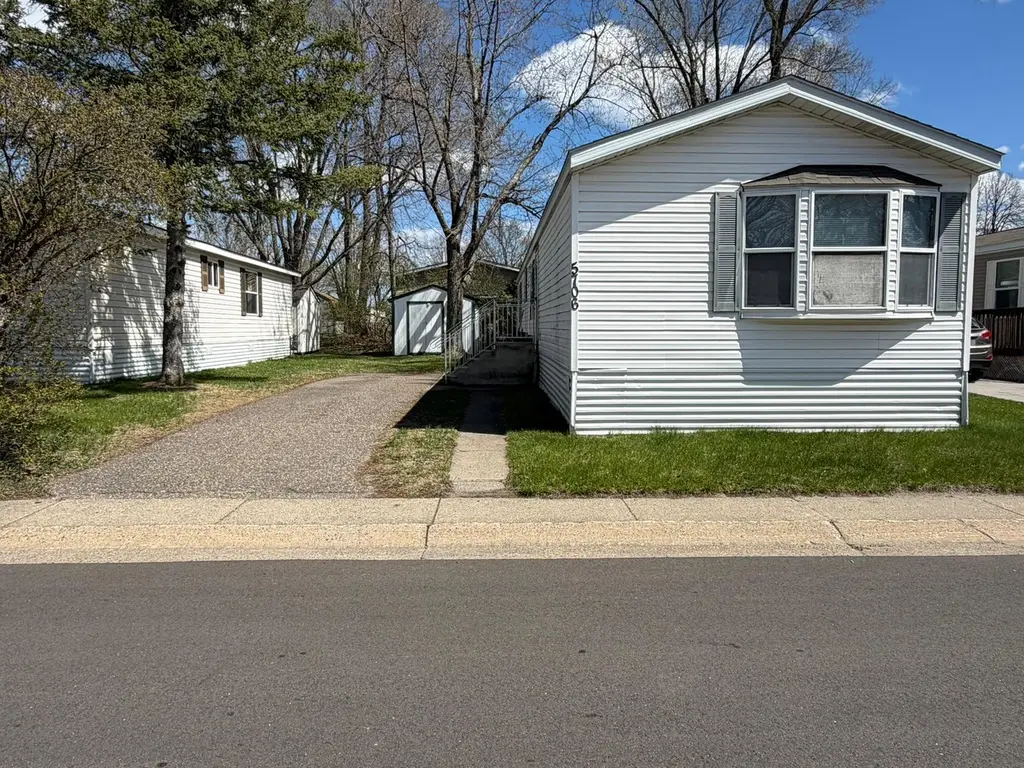
5706 Cabot Dr · Mounds View, MN
Flood risk 1/10 · Minimal
- FEMA flood zone
- X (unshaded)
- Chance of flooding over 30 yrs
- 0.0%
- Est. flood insurance / yr
- $507 – $1,088
Fire risk 1/10 · Minimal
- Est. fire insurance / yr
- $888 – $1,650
Heat risk 2/10 · Minimal
- Hot days now (above 100°F)
- 7 days/yr
- Hot days in 30 yrs
- 14 days/yr
Wind risk 2/10 · Minimal
- Chance of severe wind over 30 yrs
- —
Air-quality risk 2/10 · Minimal
- Unhealthy air days now
- 1 days/yr
- Unhealthy air days in 30 yrs
- 1 days/yr
Risk factors via First Street. Map © Google.
Why this score? — see what drove the B grade
The composite is a weighted blend of 9 inputs, each scored 0–100. Each bar is that input's sub-score; the figure is the points it added to the 100-point composite (weight × sub-score).
- Cash flow +30.0/30.0
- 1% rule +10.0/10.0
- DSCR +10.0/10.0
- ARV discount +7.5/15.0
- Schools +5.4/10.0
- Livability +4.1/5.0
- Condition / age +3.8/5.0
- Rent growth +3.5/5.0
- Appreciation +0.0/10.0
$85,000
🖨 Deal sheet (PDF) 📄 Offer letter ✓ Due diligence
Listing remarks
Welcome to this beautifully renovated, one-owner mobile home! Step inside to find a bright and inviting interior with updated finishes throughout, offering a clean and modern feel while maintaining a warm, comfortable atmosphere. With new appliances, fresh paint, and plush new carpeting, this home is truly move-in ready! Outside, you’ll appreciate the well-maintained exterior and the peace of mind that comes with recent upgrades, including the new roof. 10x10 shed included in the sell.
Key facts
- Updated finishes
- Fresh paint
- New appliances
Tags
Property features AI
Finance
- Other: Taxes apply
- Financial info: Monthly land lease amount: $1,050
- HOA & community: Land is leased (land lease payment applies)
Exterior
- Parking: Asphalt parking
- Utilities: City water connected; City sewer connected; Natural gas
- Home design: Residential manufactured home; Single-story; Entry and main living all on one level; 68x16 foundation dimensions
- Construction: Built within the last 8 years (roof age 8 years or less); Foundation area 1,088; Above-grade living area 1,088
- Exterior features: Vinyl exterior
Interior
- Kitchen: Kitchen on the main level (15x11) with range and refrigerator
- Bedrooms: Three bedrooms, all on the main level (dimensions: 15x11, 11x9, 11x10)
- Bathrooms: Two full bathrooms on the main level (7x5 and 15x6)
- Heating & cooling: Forced air heating; Central air conditioning
- Interior features: Laundry appliances included: Washer and Dryer; Range; Refrigerator; No basement
- Laundry & utility: Washer and Dryer included
Neighborhood map
What this means for you Summary
Snapshot
- This is a 3-bed/2.0-bath single-family listed at $85k. Condition is rated good.
Deal economics
- At list price, monthly cash flow is $847 ($10k/yr) — positive.
- The deal already cash-flows at list — no discount required.
- Meets the 1% rule at list price ($2k rent vs $85k).
- Recommended offer: $84k (1.5% below list) — sets the bar for market timing.
- Cap rate 18.3% vs local median 3.1% in Mounds View — top-decile yield for the area; either an underpriced asset or a hidden risk that comps aren't pricing in. Stress-test before assuming the spread holds.
Location & tenants
- Location reads 82/100 on livability (#44 in MN, #1,223 nationally) — a professional / high-income tenant draw. Strengths: commute A+, housing A+, employment A; Watch: amenities F.
- Mounds View Public School District (suburban): math 58% / reading 64% proficiency, ranked #30 of 301 in MN (top 10%) — acceptable for families but not a draw, mixed tenant base, ~2y average lease.
- Market conditions: Rents rising fast (+4.1%/yr); 168 active listings in the ZIP; 12 comparable units currently listed for rent nearby; rentals at typical pace (median 25d on market — plan ~3-4 weeks tenant-placement turnaround); 42% of comp listings sitting > 30 days — soft ceiling on asking rent; solid renter incomes; 1,202 units permitted in Ramsey County in 2024 (880 in 5+ unit buildings).
Forward outlook
- Local home prices are declining (-3.0%/yr); year-one equity from $588 of loan paydown is wiped out by about $3k of value loss. Plan a longer hold.
- Ramsey County population projected at +27% by 2050 — long-run rental-demand tailwind backs the buy-and-hold thesis.
- At projected returns (-3.0% appreciation + 4.1% rent growth), your $24k cash investment doubles in ~3 years — after that, you're playing with house money.
Negotiation context
- It's been on market 25 days — a 2% lower offer ($84k) is reasonable based on typical stale-listing flexibility.
Questions for the listing agent
- Is there a deadline driving the sale (1031 exchange, divorce, estate, relocation)? That informs how much negotiation room exists.
- Schools are B-rated — typically a magnet for longer-tenancy family renters. What's the average tenant stay here, and is there a school-zone premium baked into asking?
- What's the average days-on-market for RENTAL listings here right now (not sales)? A rising rental-DOM trend means longer vacancies and softer asking-rent achievability than the comps imply.
- What's the recent tenant-quality profile in this submarket — average credit score on applications, eviction rate, late-payment / NSF rate, and stable-employment percentage? A property-management company in the area should have these aggregated.
- How much new for-sale + rental construction is in the pipeline within 1–3 miles? Heavy new supply typically softens prices + rents 12–24 months out; constrained supply supports both.
Investment metrics
- 1% rule
- 2.14% ✓
- Cap rate
- 18.26%
- Cash-on-cash
- 42.73%
- DSCR
- 2.90
- GRM
- 3.9
CMA / ARV
- ARV (median comp)
- $274,804
- List price
- $85,000
- Delta
- -69.07%
- Verdict
- UNDERPRICED
- Comps
- 2 within 2.0 mi
Projected returns pro-forma
-3.0% appreciation · 4.07% rent growth · sell at horizon
- IRR
- 40.7%
- Equity multiple
- 2.77×
- Total profit
- $42,206
- Equity at exit
- $12,674
- IRR
- 47.5%
- Equity multiple
- 5.82×
- Total profit
- $114,655
- Equity at exit
- $7,349
Cash invested: $23,800 (down + closing). Projections, not guarantees.
Landlord ↔ Tenant lean methodology
- Overall (STATE)
- 46 Balanced
- State Minnesota
- 46 Balanced · D+2
- County
- — inherits STATE
- City
- — inherits STATE
ZIP-level market 55112
- Rents YoY
- 4.1%
- Active inventory
- 168
- Price-to-rent
- 3.9×
Monthly cashflow live
- Estimated rent
- $1,816 high interval (Pro) →
- Mortgage (P&I)
- −$446
- Tax est. 1.5%
- −$106 /mo · $1,275/yr
- Insurance
- −$35
- HOA
- −$0
- Vacancy / Maint / Mgmt
- −$381
- Net cashflow
- $847
Break-even live
Sensitivity live
| Price | -10% $906 | -5% $877 | +0% $847 | +5% $818 | +10% $789 |
|---|---|---|---|---|---|
| Rent | -10% $704 | -5% $776 | +0% $847 | +5% $919 | +10% $991 |
| Rate | -1.0pp $890 | -0.5pp $869 | base $847 | +0.5pp $825 | +1.0pp $803 |
UW: 25.0% down · 7.5% · 30yr · 1.5% tax · 5.0% vac · 8.0% maint · 8.0% mgmt
Financing live
Cash to close
- Down payment
- $21,250
- Closing costs
- $2,550
- Reserves months
- —
- Total cash needed
- —
Loan-product check · same deal, 3 products live
Conventional
25% down · 7.5% · 30yr
- Down + closing
- —
- Monthly P&I
- —
- Monthly cashflow
- —
- DSCR
- —
- Eligible?
- —
Personal DTI + credit; lowest rate.
DSCR
20% down · 8.5% · 30yr
- Down + closing
- —
- Monthly P&I
- —
- Monthly cashflow
- —
- DSCR
- —
- Eligible?
- —
No personal income docs; deal must DSCR.
Hard money
10% down · 12.0% · 12mo
- Down + closing
- —
- Monthly P&I
- —
- Monthly cashflow
- —
- DSCR
- —
- Eligible?
- —
Short-term bridge; refi at stabilization.
Rent comps 12 comps
| Address | Beds | Baths | Sqft | Rent | $/sqft | DOM | Units | Dist |
|---|---|---|---|---|---|---|---|---|
| 5711 Quincy St Unit 33 Mounds View, MN | 3.0 | 1.0 | 1500 | $2,000 | $1.33 | 0d | 1 | 0.13mi |
| 5891 Rice Creek Pkwy Shoreview, MN | 1.0–2.0 | 1.0–2.0 | 926 | $2,251 | $2.43 | 0d | 23 | 0.36mi |
| 1939 Bluestem Ln Saint Paul, MN | 2.0 | 2.0 | 1400 | $1,895 | $1.35 | 18d | 1 | 0.42mi |
| 2300 County Road I Saint Paul, MN | 1.0–2.0 | 1.0 | 950 | $1,497 | $1.58 | 10d | 15 | 0.54mi |
| 1905 Wildflower Ct Saint Paul, MN | 2.0 | 1.0 | 1216 | $1,900 | $1.56 | 0d | 1 | 0.59mi |
| 7635 Greenfield Ave St Paul, MN | 1.0–2.0 | 1.0 | 925 | $1,600 | $1.73 | 44d | 1 | 0.72mi |
| 7501 Greenfield Ave Saint Paul, MN | 2.0 | 1.0 | 900 | $1,497 | $1.66 | 25d | 1 | 0.79mi |
| 7639 Woodlawn Dr New Brighton, MN | 1.0–2.0 | 1.0 | 900 | $1,475 | $1.64 | 44d | 1 | 0.84mi |
| 7664 Woodlawn Dr Unit 5 Mounds View, MN | 2.0 | 1.0 | 900 | $1,300 | $1.44 | 44d | 1 | 0.88mi |
| 2651 Mounds View Blvd Unit 2665308 Mounds View, MN | 2.0 | 1.0 | 861 | $1,350 | $1.57 | 44d | 1 | 1.15mi |
| 1556 Hillview Rd Saint Paul, MN | 2.0 | 1.0 | 1000 | $1,800 | $1.80 | 44d | 1 | 1.17mi |
| 2659 County Road H2 Mounds View, MN | 1.0–2.0 | 1.0 | 825 | $1,489 | $1.80 | 5d | 5 | 1.33mi |
Listing history 3 events
-
2026-05-18status Pending 496-char remark
-
2026-05-11price $85,000 496-char remark
-
2026-04-23$95,000 Active 496-char remark
ⓘ Source: listings_history table (triggers on properties + properties_extension) + one-shot
backfill from property_details.listing_events for pre-trigger history.
Climate risk First Street
- Flood 1/10 Low FEMA zone X (unshaded) · 0% chance over 30 yrs
- Wildfire 1/10 Low
- Heat 2/10 Low 7 d/yr ≥100°F today · 14 d/yr by 30 yrs out
- Wind 2/10 Low
- Air quality 2/10 Low 1 unhealthy d/yr today · 1 by 30 yrs out
Nearby sold comps map
Loading sold comps map…
Walkable amenities ~0.75 mi
Loading nearby amenities…
Taxation est. · year 1
- Rental income
- $21,796
- − Mortgage interest
- −$4,761
- − Property taxes
- −$1,275
- − Insurance
- −$425
- − Repairs & maintenance
- −$1,744
- − Management
- −$1,744
- − Depreciation
- −$2,473
- Taxable income
- $9,374
- Est. tax owed @ 24.0%
- −$2,250
- After-tax cash flow
- $7,920/yr
For passive investors: Depreciation is non-cash, so a rental often shows a tax loss while cash-flowing — sheltering income. Rental losses are passive: they offset passive income freely, and up to $25,000/yr can offset ordinary (W-2) income if you actively participate and your MAGI is under $100k (phasing out to $0 by $150k); unused losses carry forward. On sale, claimed depreciation is recaptured at up to 25%, and gains may owe capital-gains tax (a 1031 exchange can defer both). Figures are a year-1 estimate at your 24.0% rate — not tax advice; consult a CPA.
Condition & rehab AI · 12 photos
This beautifully renovated mobile home is move-in ready with updated finishes and recent upgrades, including a new roof and appliances.
Value-add opportunities
- Both painting — fresh paint enhances curb appeal and interior aesthetics
- Both new flooring — new flooring improves both resale and rental value
- Both new appliances — new appliances make the home more appealing to buyers and renters
Renovation cost estimate screening
Value-add ROI direction
- Both painting — fresh paint enhances curb appeal and interior aesthetics ↑
- Both new flooring — new flooring improves both resale and rental value ↑
- Both new appliances — new appliances make the home more appealing to buyers and renters ↑
ⓘ Cost ranges are severity-bucket heuristics (US national rule-of-thumb). Get contractor quotes + a written scope before underwriting a rehab budget.
Schools (NCES district)
- District
- Mounds View Public School District
- NCES district ID
- 2722950
- Math proficiency
- 58% ▼ -9.00%
- Reading proficiency
- 64% ▼ -3.00%
- Median HH income
- $72,492
- Composite
- 54.04/100
- National rank
- #1390
- State rank
- #30 of 301 in MN
Livability — Mounds View
- Score
- 82/100
- State rank
- #44
- US rank
- #1223
Category grades
Schools grade is shown separately in the Schools card above.
Census & demographics
- Census place
- Mounds View, MN
- County
- Ramsey County · 542,837 people
- Metro
- Minneapolis-St. Paul-Bloomington, MN-WI
- Population (ZIP)
- 45,346
- Household income
- $93,838
- Rent vs Own
- Severe rent burden
- 1134.0
Population outlook (Ramsey County) Hauer SSP2
- Today (2025)
- 603,431 people
- By 2030
- 636,459 · +5.5%
- By 2040
- 700,596 · +16.1%
- By 2050
- 765,819 · +26.9%
- By 2075
- 929,297 · +54.0%
- By 2100
- 1,053,924 · +74.7%
Race, ethnicity, and origin ACS 2023
- Neighborhood character
- Predominantly White (70%)
- Race & ethnicity
- White 70% Black 9% Hispanic / Latino 9% Two or more races 8% Asian 7%
- Hispanic origin (detail)
- Mexican 5%
- Common ancestry
- Portuguese 12% Romanian 5% Scottish 3%
- Foreign-born
- 12% · Canada, China, Vietnam
- Languages at home
- 84% English-only · Spanish 6% Other Asian/Pacific 3% Other Indo-European 1%
Political lean MEDSL · Ramsey
- 2024 margin
- Solid D (+43.3) · D 70.5% · R 27.2% · Other 2.3%
- 2008→2024 swing
- +9.4pp toward D · 2008: 33.9pp · 2024: 43.3pp
- All cycles
- 2024: D+43.3 2020: D+45.4 2016: D+39.4 2012: D+35.3 2008: D+33.9
Not yet ingested
- Civics
- —
Market trends
- HPI YoY
- ▼ -312.77%
- Current HPI
- 254.5083
- Rent YoY
- ▲ 4.07%
- Metro
- Minneapolis-St. Paul-Bloomington, MN-WI
- State GDP YoY
- ▲ 2.41%
- F500 in state
- 34
Industry mix (Fortune 500 HQ in MN)
| Industry | F500 HQs | Revenue |
|---|---|---|
| Healthcare | 2 | $407B |
|
||
| Retail | 2 | $150B |
|
||
| Consumer Goods | 2 | $32B |
|
||
| Industrial Machinery | 2 | $6B |
|
||
| Agriculture | 1 | $40B |
|
||
| Healthcare / Medical Devices | 1 | $32B |
|
||
Price history
-10.5% since first listed3 events — show timeline
- 2026-05-18 Pending — NORTHSTARMLS as Distributed by MLS Grid
- 2026-05-11 Price Changed $85,000 NORTHSTARMLS as Distributed by MLS Grid
- 2026-04-23 Listed $95,000 NORTHSTARMLS as Distributed by MLS Grid
Cash-flow waterfall
monthlySold comps — $/sqft
last 12 mo · ≤1 miLoading sold comps…