 🏗️ New Construction
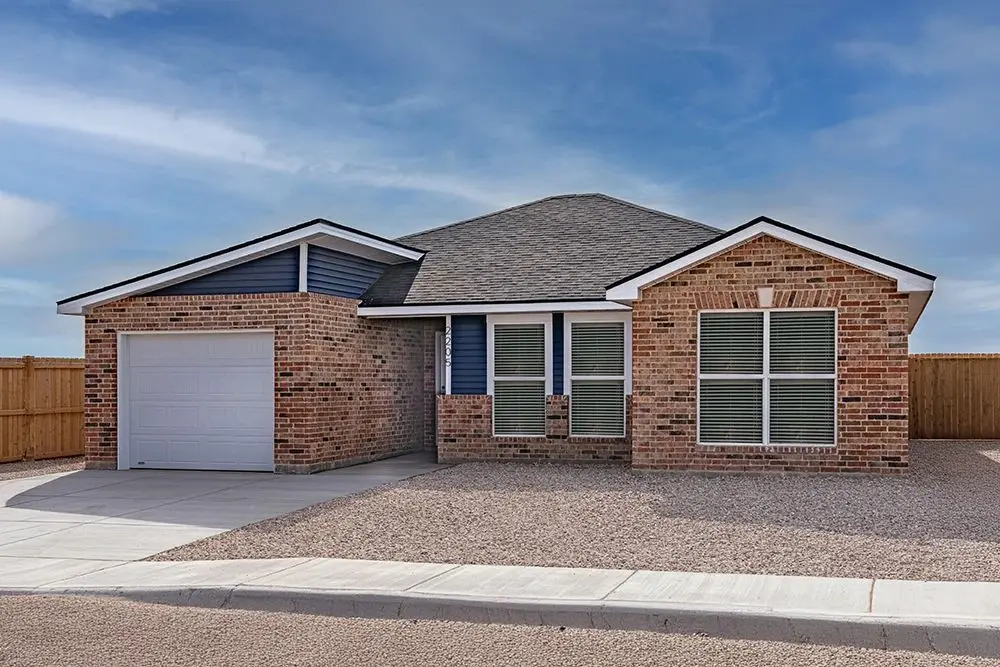
Abby Plan · Amarillo, TX
Flood risk 1/10 · Minimal
- FEMA flood zone
- X (unshaded)
- Chance of flooding over 30 yrs
- 0.0%
- Est. flood insurance / yr
- $507 – $1,088
Fire risk 2/10 · Minimal
- Est. fire insurance / yr
- $1,222 – $2,270
Heat risk 5/10 · Moderate
- Hot days now (above 97°F)
- 7 days/yr
- Hot days in 30 yrs
- 20 days/yr
Wind risk 2/10 · Minimal
- Chance of severe wind over 30 yrs
- 1.0%
Air-quality risk 2/10 · Minimal
- Unhealthy air days now
- 1 days/yr
- Unhealthy air days in 30 yrs
- 1 days/yr
Risk factors via First Street. Map © Google.
Why this score? — see what drove the D grade
The composite is a weighted blend of 9 inputs, each scored 0–100. Each bar is that input's sub-score; the figure is the points it added to the 100-point composite (weight × sub-score).
- Cash flow +12.9/30.0
- ARV discount +7.5/15.0
- Schools +5.0/10.0
- Condition / age +4.0/5.0
- DSCR +3.9/10.0
- 1% rule +3.7/10.0
- Livability +3.3/5.0
- Rent growth +2.5/5.0
- Appreciation +0.0/10.0
$240,950
🖨 Deal sheet 📄 Offer letter ✓ Due diligence
Listing remarks MLS
The 1,300 square-foot Abby floor plan is a spacious, well-connected layout with the flexibility to fit your day-to-day. Brick and vinyl exterior with covered entryLuxury vinyl plank flooring in main areasOpen-concept kitchen, living, and dining areaGranite or quartz countertopsSpacious kitchen island with bar seatingStainless steel appliancesEnclosed pantryPrivate primary suite with walk-in closet
Key facts
- Vinyl siding accents
- Open-concept kitchen
- Garage
Tags
Neighborhood map
What this means for you Summary
Snapshot
- This is a 3-bed/2.0-bath single-family listed at $241k. Condition is rated good.
Deal economics
- At list price, monthly cash flow is $-17 ($-205/yr) — negative.
- To cash-flow at today's rent, offer at most $238k (1.0% below list).
- To meet the 1% rule (rent ≥ 1% of price), the offer needs to be $209k (13.4% below list).
- Recommended offer: $209k (13.4% below list) — sets the bar for 1% rule.
Location & tenants
- Location reads 66/100 on livability (#624 in TX) — a middle-class / working-renter tenant base. Strengths: cost of living A+, housing A+; Watch: amenities C-, schools D, crime F.
- Canyon ISD (town): math 60% / reading 54% proficiency, ranked #78 of 826 in TX (top 9%) — acceptable for families but not a draw, mixed tenant base, ~2y average lease.
- Market conditions: 309 active listings in the ZIP; 6 comparable units currently listed for rent nearby; rentals lingering (median 44d on market — plan ~5-8 weeks vacancy on turnover, expect pricing pressure); 67% of comp listings sitting > 30 days — soft ceiling on asking rent; 45 units permitted in Randall County in 2024 (0 in 5+ unit buildings).
Forward outlook
- Local home prices are declining (-3.0%/yr); year-one equity from $2k of loan paydown is wiped out by about $7k of value loss. Plan a longer hold.
- Randall County population projected at +36% by 2050 — long-run rental-demand tailwind backs the buy-and-hold thesis.
Negotiation context
- It's been on market 608 days — a 12% lower offer ($212k) is reasonable based on typical stale-listing flexibility.
Risks & watch-outs
- Climate carrying-cost: extreme-heat days projected 7→20/yr by 2055 (HVAC capex compounding) — expect insurance premiums to compound above CPI over the hold.
Questions for the listing agent
- What do current leases actually rent for vs. the listed asking? Can we see a recent rent roll and the last 12 months of T-12 income?
- It's been on market 608 days. Have you received any prior offers? Is the seller open to a 13% concession, seller financing, or rate buy-down credit?
- Why hasn't it sold? Are there any deal-killer items the seller is aware of (foundation, flood, title, zoning, code violations)?
- Is there a deadline driving the sale (1031 exchange, divorce, estate, relocation)? That informs how much negotiation room exists.
- Schools are D-rated, which usually means shorter tenancies and higher turnover. Who's the typical renter profile here, and what's been the actual vacancy rate?
- Crime grade is F in this area — have there been break-ins, vandalism, or insurance claims at this property in the last 3 years? What carrier currently insures it and at what premium?
- The area grade is low — what's the realistic commute time and amenity access for the typical tenant pool here? Any planned neighborhood developments (good or bad) we should know about?
- What's the average days-on-market for RENTAL listings here right now (not sales)? A rising rental-DOM trend means longer vacancies and softer asking-rent achievability than the comps imply.
- What's the recent tenant-quality profile in this submarket — average credit score on applications, eviction rate, late-payment / NSF rate, and stable-employment percentage? A property-management company in the area should have these aggregated.
- How much new for-sale + rental construction is in the pipeline within 1–3 miles? Heavy new supply typically softens prices + rents 12–24 months out; constrained supply supports both.
Investment metrics
- 1% rule
- 0.87% ✗
- Cap rate
- 6.21%
- Cash-on-cash
- -0.30%
- DSCR
- 0.99
- GRM
- 9.6
CMA / ARV
No comps found within radius.
Projected returns pro-forma
-3.0% appreciation · 3.0% rent growth · sell at horizon
- IRR
- -16.8%
- Equity multiple
- 0.41×
- Total profit
- $-40,100
- Equity at exit
- $35,926
- IRR
- -8.6%
- Equity multiple
- 0.46×
- Total profit
- $-36,190
- Equity at exit
- $20,833
Cash invested: $67,466 (down + closing). Projections, not guarantees.
Landlord ↔ Tenant lean methodology
- Overall (STATE)
- 87 Strongly Landlord-Friendly
- State Texas
- 87 Strongly Landlord-Friendly · R+5
- County
- — inherits STATE
- City
- — inherits STATE
ZIP-level market 79124
- Home prices YoY
- -28.7%
- Active inventory
- 309
- Price-to-rent
- 9.6×
Monthly cashflow live
- Estimated rent
- $2,086 high interval (Pro) →
- Mortgage (P&I)
- −$1,264
- Tax est. 1.5%
- −$301 /mo · $3,614/yr
- Insurance
- −$100
- HOA
- −$0
- Vacancy / Maint / Mgmt
- −$438
- Net cashflow
- $-17
Break-even live
UW: 25.0% down · 7.5% · 30yr · 1.5% tax · 5.0% vac · 8.0% maint · 8.0% mgmt
Financing live
Cash to close
- Down payment
- $60,238
- Closing costs
- $7,228
- Reserves months
- —
- Total cash needed
- —
Loan-product check · same deal, 3 products live
Conventional
25% down · 7.5% · 30yr
- Down + closing
- —
- Monthly P&I
- —
- Monthly cashflow
- —
- DSCR
- —
- Eligible?
- —
Personal DTI + credit; lowest rate.
DSCR
20% down · 8.5% · 30yr
- Down + closing
- —
- Monthly P&I
- —
- Monthly cashflow
- —
- DSCR
- —
- Eligible?
- —
No personal income docs; deal must DSCR.
Hard money
10% down · 12.0% · 12mo
- Down + closing
- —
- Monthly P&I
- —
- Monthly cashflow
- —
- DSCR
- —
- Eligible?
- —
Short-term bridge; refi at stabilization.
Rent comps 6 comps
| Address | Beds | Baths | Sqft | Rent | $/sqft | DOM | Units | Dist |
|---|---|---|---|---|---|---|---|---|
| 3013 Swenson St Amarillo, TX | 4.0 | 2.0 | 1612 | $2,400 | $1.49 | 20d | 1 | 0.39mi |
| 2808 Haystack Way Amarillo, TX | 2.0 | 2.0 | 1010 | $1,850 | $1.83 | 43d | 1 | 0.40mi |
| 8910 Hockley St Amarillo, TX | 2.0 | 2.0 | 1005 | $1,850 | $1.84 | 43d | 1 | 0.44mi |
| 2801 Ranch House Rd Amarillo, TX | 3.0 | 2.0 | 1205 | $2,100 | $1.74 | 43d | 1 | 0.47mi |
| 7727 Cervin Dr Amarillo, TX | 2.0 | 2.0 | 1696 | $2,200 | $1.30 | 43d | 1 | 0.85mi |
| 7603 Canode Dr Amarillo, TX | 3.0 | 2.0 | 1739 | $2,200 | $1.27 | 13d | 1 | 1.18mi |
Listing history 19 events
-
2026-06-18days on market $240,950 Active 608 DOM
-
2026-06-17days on market $240,950 Active 607 DOM
-
2026-06-16days on market $240,950 Active 606 DOM
-
2026-06-15days on market $240,950 Active 605 DOM
-
2026-06-14days on market $240,950 Active 603 DOM
-
2026-06-13days on market $240,950 Active 602 DOM
-
2026-06-10days on market $240,950 Active 600 DOM
-
2026-06-09days on market $240,950 Active 599 DOM
-
2026-06-08days on market $240,950 Active 598 DOM
-
2026-06-07days on market $240,950 Active 597 DOM
-
2026-06-05pricedays on market $240,950 Active 594 DOM
-
2026-06-03days on market $236,950 Active 593 DOM
-
2026-06-02days on market $236,950 Active 592 DOM
-
2026-06-01days on market $236,950 Active 591 DOM
-
2026-05-31days on market $236,950 Active 590 DOM
-
2026-05-30days on market $236,950 Active 589 DOM
-
2026-04-15price $236,950 400-char remark
Show marketing remark (400 chars)
The 1,300 square-foot Abby floor plan is a spacious, well-connected layout with the flexibility to fit your day-to-day. Brick and vinyl exterior with covered entryLuxury vinyl plank flooring in main areasOpen-concept kitchen, living, and dining areaGranite or quartz countertopsSpacious kitchen island with bar seatingStainless steel appliancesEnclosed pantryPrivate primary suite with walk-in closet
-
2025-03-26price $230,950 400-char remark
Show marketing remark (400 chars)
The 1,300 square-foot Abby floor plan is a spacious, well-connected layout with the flexibility to fit your day-to-day. Brick and vinyl exterior with covered entryLuxury vinyl plank flooring in main areasOpen-concept kitchen, living, and dining areaGranite or quartz countertopsSpacious kitchen island with bar seatingStainless steel appliancesEnclosed pantryPrivate primary suite with walk-in closet
-
2024-10-19$236,950 Active 400-char remark
Show marketing remark (400 chars)
The 1,300 square-foot Abby floor plan is a spacious, well-connected layout with the flexibility to fit your day-to-day. Brick and vinyl exterior with covered entryLuxury vinyl plank flooring in main areasOpen-concept kitchen, living, and dining areaGranite or quartz countertopsSpacious kitchen island with bar seatingStainless steel appliancesEnclosed pantryPrivate primary suite with walk-in closet
ⓘ Source: listings_history table (triggers on properties + properties_extension) + one-shot
backfill from property_details.listing_events for pre-trigger history.
Climate risk First Street
- Flood 1/10 Low FEMA zone X (unshaded) · 0% chance over 30 yrs
- Wildfire 2/10 Low
- Heat 5/10 Major 7 d/yr ≥97°F today · 20 d/yr by 30 yrs out
- Wind 2/10 Low 100% chance of damaging wind over 30 yrs
- Air quality 2/10 Low 1 unhealthy d/yr today · 1 by 30 yrs out
Nearby sold comps map
Loading sold comps map…
Walkable amenities ~0.75 mi
Loading nearby amenities…
Taxation est. · year 1
- Rental income
- $25,034
- − Mortgage interest
- −$13,497
- − Property taxes
- −$3,614
- − Insurance
- −$1,205
- − Repairs & maintenance
- −$2,003
- − Management
- −$2,003
- − Depreciation
- −$7,009
- Taxable loss
- −$4,297
- Est. tax savings @ 24.0%
- +$1,031
- After-tax cash flow
- $826/yr
For passive investors: Depreciation is non-cash, so a rental often shows a tax loss while cash-flowing — sheltering income. Rental losses are passive: they offset passive income freely, and up to $25,000/yr can offset ordinary (W-2) income if you actively participate and your MAGI is under $100k (phasing out to $0 by $150k); unused losses carry forward. On sale, claimed depreciation is recaptured at up to 25%, and gains may owe capital-gains tax (a 1031 exchange can defer both). Figures are a year-1 estimate at your 24.0% rate — not tax advice; consult a CPA.
Condition & rehab AI · 6 photos
This well-maintained, spacious single-family home with a good condition score and modern finishes is ready for a new owner. It offers a good return on investment with minor updates that can significantly enhance its value.
Value-add opportunities
- Both Paint exterior trim — Enhances curb appeal and can increase both resale and rental value.
- Both Replace window blinds — Improves energy efficiency and enhances the home's aesthetic appeal.
- Both Landscaping improvements — Enhances curb appeal and can increase both resale and rental value.
- Both Add smart home features — Improves convenience and can increase both resale and rental value.
- Both Update flooring in bathrooms — Modernizes the bathrooms and can increase both resale and rental value.
Renovation cost estimate screening
Value-add ROI direction
- Both Paint exterior trim — Enhances curb appeal and can increase both resale and rental value. ↑
- Both Replace window blinds — Improves energy efficiency and enhances the home's aesthetic appeal. ↑
- Both Landscaping improvements — Enhances curb appeal and can increase both resale and rental value. ↑
- Both Add smart home features — Improves convenience and can increase both resale and rental value. ↑
- Both Update flooring in bathrooms — Modernizes the bathrooms and can increase both resale and rental value. ↑
ⓘ Cost ranges are severity-bucket heuristics (US national rule-of-thumb). Get contractor quotes + a written scope before underwriting a rehab budget.
Schools (NCES district)
- District
- Canyon ISD
- NCES district ID
- 4812810
- Math proficiency
- 60% ▼ -1.00%
- Reading proficiency
- 54% ▼ -1.00%
- Median HH income
- $65,177
- Composite
- 50.07/100
- National rank
- #1912
- State rank
- #78 of 826 in TX
Livability — Amarillo
- Score
- 66/100
- State rank
- #624
- US rank
- #11876
Category grades
Schools grade is shown separately in the Schools card above.
Census & demographics
- Census place
- Amarillo, TX
- City population
- 185,802
- Population (ZIP)
- 11,800
Population outlook (Randall County) Hauer SSP2
- Today (2025)
- 152,140 people
- By 2030
- 163,107 · +7.2%
- By 2040
- 184,999 · +21.6%
- By 2050
- 206,948 · +36.0%
- By 2075
- 260,204 · +71.0%
- By 2100
- 294,980 · +93.9%
Race, ethnicity, and origin ACS 2023
- Neighborhood character
- Predominantly White (81%)
- Race & ethnicity
- White 81% Hispanic / Latino 16% Two or more races 6%
- Hispanic origin (detail)
- Mexican 12% Cuban 1%
- Common ancestry
- Slovak 4% Italian 2% Romanian 2%
- Foreign-born
- 2% · Canada, China
- Languages at home
- 90% English-only · Spanish 8% Vietnamese 1%
Political lean MEDSL · Randall
- 2024 margin
- Solid R (+60.4) · D 19.4% · R 79.8%
- 2008→2024 swing
- +2.3pp toward D · 2008: -62.7pp · 2024: -60.4pp
- All cycles
- 2024: R+60.4 2020: R+58.8 2016: R+65.1 2012: R+68.2 2008: R+62.7
Not yet ingested
- Civics
- —
Market trends
- HPI YoY
- ▼ -66.66%
- Current HPI
- 165.6073
- Rent YoY
- —
- Metro
- —
- State GDP YoY
- ▲ 3.95%
- F500 in state
- 110
Industry mix (Fortune 500 HQ in TX)
| Industry | F500 HQs | Revenue |
|---|---|---|
| Energy | 16 | $1,198B |
|
||
| Technology | 5 | $198B |
|
||
| Engineering / Construction | 4 | $72B |
|
||
| Energy Services | 3 | $60B |
|
||
| Utilities | 3 | $41B |
|
||
| Healthcare | 2 | $330B |
|
||
Price history
+0.0% since first listed3 events — show timeline
- 2026-04-15 Price Changed $236,950 Zillow
- 2025-03-26 Price Changed $230,950 Zillow
- 2024-10-19 Listed $236,950 Zillow
Cash-flow waterfall
monthlySold comps — $/sqft
last 12 mo · ≤1 miLoading sold comps…