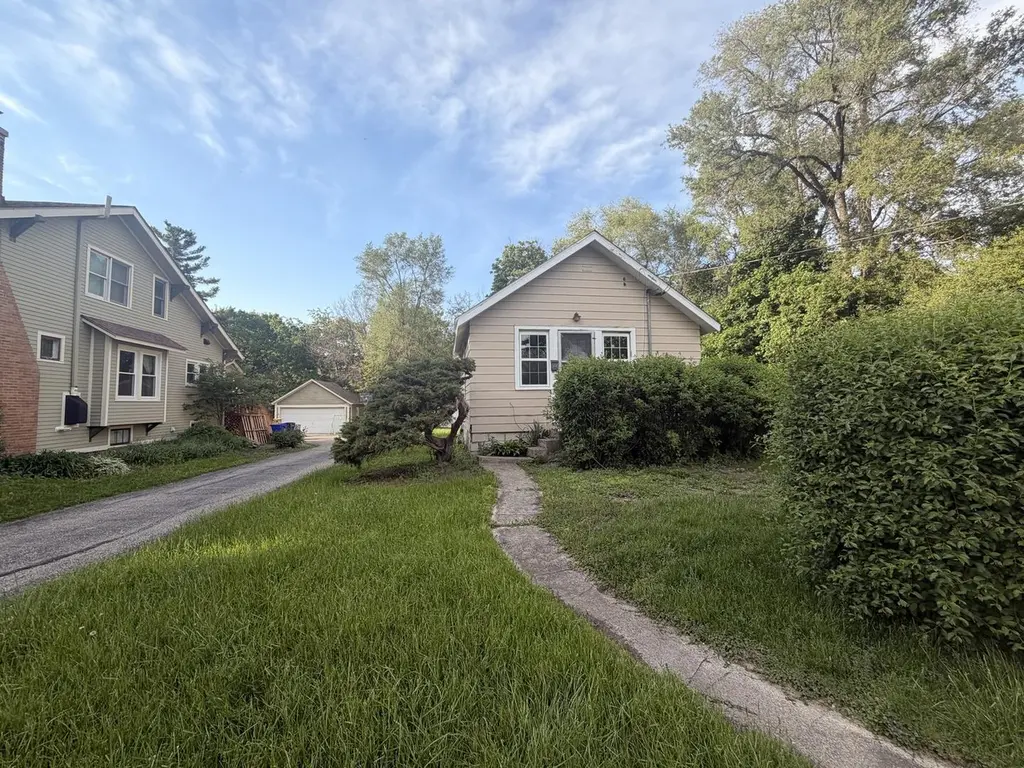
513 E Liberty Dr · Wheaton, IL
Flood risk 1/10 · Minimal
- FEMA flood zone
- X (unshaded)
- Chance of flooding over 30 yrs
- 0.0%
- Est. flood insurance / yr
- $473 – $860
Fire risk 1/10 · Minimal
- Est. fire insurance / yr
- $804 – $1,492
Heat risk 3/10 · Minor
- Hot days now (above 104°F)
- 7 days/yr
- Hot days in 30 yrs
- 14 days/yr
Wind risk 2/10 · Minimal
- Chance of severe wind over 30 yrs
- —
Air-quality risk 3/10 · Minor
- Unhealthy air days now
- 4 days/yr
- Unhealthy air days in 30 yrs
- 4 days/yr
Risk factors via First Street. Map © Google.
Why this score? — see what drove the C grade
The composite is a weighted blend of 9 inputs, each scored 0–100. Each bar is that input's sub-score; the figure is the points it added to the 100-point composite (weight × sub-score).
- Cash flow +22.3/30.0
- ARV discount +8.6/15.0
- DSCR +7.1/10.0
- 1% rule +5.5/10.0
- Livability +4.3/5.0
- Schools +4.1/10.0
- Rent growth +3.6/5.0
- Condition / age +2.5/5.0
- Appreciation +0.0/10.0
$299,000
🖨 Deal sheet (PDF) 📄 Offer letter ✓ Due diligence
Listing remarks MLS
There are no remarks available.
Key facts
- New construction
- Meets village code
- 8,580 sq ft lot
Tags
Property features AI
Finance
- HOA & community: No master association fee required
Exterior
- Parking: Detached garage (1 garage space, 1 total parking space)
- Utilities: Public water; Public sewer
- Home design: Detached single-family home; One-story; Fee simple ownership; Home is over 100 years old; Built before 1978
- Construction: Vinyl siding construction
- Exterior features: Vinyl siding; Lot dimensions roughly 65 x 132
Interior
- Kitchen: Main-level kitchen (approximately 9 x 10)
- Bedrooms: Master bedroom on main level (approximately 10 x 12); Second bedroom on main level (approximately 10 x 10)
- Bathrooms: One full bathroom
- Heating & cooling: Natural gas heating; Central air conditioning
- Interior features: Five total rooms; Unfinished full basement
- Laundry & utility: Main-level laundry room (approximately 5 x 5)
Neighborhood map
What this means for you Summary
Snapshot
- This is a 2-bed/1.0-bath single-family listed at $299k.
Deal economics
- At list price, monthly cash flow is $492 ($6k/yr) — positive.
- The deal already cash-flows at list — no discount required.
- Meets the 1% rule at list price ($3k rent vs $299k).
- Recommended offer: $295k (1.5% below list) — sets the bar for market timing.
- Cap rate 8.3% vs local median 3.7% in Wheaton — top-decile yield for the area; either an underpriced asset or a hidden risk that comps aren't pricing in. Stress-test before assuming the spread holds.
Location & tenants
- Location reads 86/100 on livability (#17 in IL, #374 nationally) — a professional / high-income tenant draw. Strengths: crime A+, commute A+, employment A+; Watch: amenities D+, health & safety D+, cost of living F.
- CUSD 200 (suburban): math 43% / reading 44% proficiency, ranked #78 of 620 in IL (top 13%) — families likely to look elsewhere, expect single-tenant / working-renter base with shorter leases.
- Zoned schools: Lowell Elem School (math 47% / reading 47%, grade D-, #219 of 2,056 statewide, top 12%, 257 students, 0% FRL); Franklin Middle School (math 38% / reading 49%, grade D, #101 of 665 statewide, top 16%, 575 students, 0% FRL) — zoned schools average 0% FRL vs 23% district-wide (23 pts lower); this property's tenant base skews higher-income than the district average.
- Market conditions: Rents rising fast (+4.6%/yr); 45 active listings in the ZIP; 3 comparable units currently listed for rent nearby; rentals leasing fast (median 0d on market — plan ~1-2 weeks tenant-placement turnaround); high-income renter base; 1,378 units permitted in DuPage County in 2024 (594 in 5+ unit buildings).
- This rent runs 32% of the median local income ($120k/yr) — at the standard rent-burdened threshold; future hikes will face affordability resistance.
Forward outlook
- Local home prices are declining (-3.0%/yr); year-one equity from $2k of loan paydown is wiped out by about $9k of value loss. Plan a longer hold.
Negotiation context
- It's been on market 17 days — a 2% lower offer ($295k) is reasonable based on typical stale-listing flexibility.
- 3 sale attempts with the ask held roughly flat each time — persistent listings suggest the price (not the market) is what's stuck; bring a comps-based counter.
- Current owner paid $238k; 26% above their basis — modest negotiation headroom, anchor on the comps not their cost.
Risks & watch-outs
- Watch-outs: built in 1900 — expect roof / HVAC / electrical / plumbing capex.
Questions for the listing agent
- Built in 1900 — when were the roof, HVAC, electrical panel, plumbing, and water heater last replaced?
- Is there a deadline driving the sale (1031 exchange, divorce, estate, relocation)? That informs how much negotiation room exists.
- Schools are A-rated — typically a magnet for longer-tenancy family renters. What's the average tenant stay here, and is there a school-zone premium baked into asking?
- What's the average days-on-market for RENTAL listings here right now (not sales)? A rising rental-DOM trend means longer vacancies and softer asking-rent achievability than the comps imply.
- What's the recent tenant-quality profile in this submarket — average credit score on applications, eviction rate, late-payment / NSF rate, and stable-employment percentage? A property-management company in the area should have these aggregated.
- How much new for-sale + rental construction is in the pipeline within 1–3 miles? Heavy new supply typically softens prices + rents 12–24 months out; constrained supply supports both.
Investment metrics
- 1% rule
- 1.05% ✓
- Cap rate
- 8.27%
- Cash-on-cash
- 7.05%
- DSCR
- 1.31
- GRM
- 7.9
CMA / ARV
- ARV (on-the-fly)
- $306,606
- Comps found
- 3
Show comp detail 3 sales within ~0.75 mi
| Address | Dist | Beds/Ba | Sqft | Sold | Price | $/sf | Match |
|---|---|---|---|---|---|---|---|
| 409 S Hale St | 0.53mi | 2/1.0 | 750 (+0%) | 5mo | $275,000 | $367 | 70 |
| 131 N Hale St Unit A | 0.51mi | 2/1.0 | 728 (-2%) | 20mo | $500,000 | $687 | 55 |
| 131 S Blanchard St | 0.56mi | 2/1.0 | 840 (+13%) | 13mo | $345,000 | $411 | 42 |
Match score weights: distance 35% · size 25% · config 20% · recency 20%. Top-matched comps best support the ARV.
Projected returns pro-forma
-3.0% appreciation · 4.56% rent growth · sell at horizon
- IRR
- -3.8%
- Equity multiple
- 0.86×
- Total profit
- $-12,083
- Equity at exit
- $44,582
- IRR
- 7.6%
- Equity multiple
- 1.61×
- Total profit
- $51,146
- Equity at exit
- $25,852
Cash invested: $83,720 (down + closing). Projections, not guarantees.
Landlord ↔ Tenant lean methodology
- Overall (STATE)
- 43 Moderately Tenant-Leaning
- State Illinois
- 43 Moderately Tenant-Leaning · D+7
- County
- — inherits STATE
- City
- — inherits STATE
ZIP-level market 60187
- Rents YoY
- 4.6%
- Active inventory
- 45
- Price-to-rent
- 7.9×
Monthly cashflow live
- Estimated rent
- $3,153 medium interval (Pro) →
- Mortgage (P&I)
- −$1,568
- Tax from tax record
- −$307 /mo · $3,678/yr
- Insurance
- −$125
- HOA
- −$0
- Vacancy / Maint / Mgmt
- −$662
- Net cashflow
- $492
Break-even live
Sensitivity live
| Price | -10% $661 | -5% $577 | +0% $492 | +5% $407 | +10% $323 |
|---|---|---|---|---|---|
| Rent | -10% $243 | -5% $367 | +0% $492 | +5% $617 | +10% $741 |
| Rate | -1.0pp $643 | -0.5pp $568 | base $492 | +0.5pp $415 | +1.0pp $336 |
UW: 25.0% down · 7.5% · 30yr · 1.5% tax · 5.0% vac · 8.0% maint · 8.0% mgmt
Financing live
Cash to close
- Down payment
- $74,750
- Closing costs
- $8,970
- Reserves months
- —
- Total cash needed
- —
Loan-product check · same deal, 3 products live
Conventional
25% down · 7.5% · 30yr
- Down + closing
- —
- Monthly P&I
- —
- Monthly cashflow
- —
- DSCR
- —
- Eligible?
- —
Personal DTI + credit; lowest rate.
DSCR
20% down · 8.5% · 30yr
- Down + closing
- —
- Monthly P&I
- —
- Monthly cashflow
- —
- DSCR
- —
- Eligible?
- —
No personal income docs; deal must DSCR.
Hard money
10% down · 12.0% · 12mo
- Down + closing
- —
- Monthly P&I
- —
- Monthly cashflow
- —
- DSCR
- —
- Eligible?
- —
Short-term bridge; refi at stabilization.
Rent comps 3 comps
| Address | Beds | Baths | Sqft | Rent | $/sqft | DOM | Units | Dist |
|---|---|---|---|---|---|---|---|---|
| 250 S Naperville Rd Wheaton, IL | 3.0 | 1.0–2.0 | 1061 | $4,073 | $3.84 | 25d | 16 | 0.29mi |
| 250 S Naperville Rd Wheaton, IL | 3.0 | 1.0–2.0 | 1061 | $4,063 | $3.83 | 0d | 10 | 0.29mi |
| 121 N Cross St Wheaton, IL | 2.0 | 1.0–2.0 | 831 | $2,837 | $3.41 | 0d | 16 | 0.33mi |
Listing history 18 events
-
2026-06-21days on market $299,000 Active 17 DOM
-
2026-06-18days on market $299,000 Active 14 DOM
-
2026-06-17days on market $299,000 Active 13 DOM
-
2026-06-16days on market $299,000 Active 12 DOM
-
2026-06-15days on market $299,000 Active 11 DOM
-
2026-06-13days on market $299,000 Active 9 DOM
-
2026-06-13days on market $299,000 Active 8 DOM
-
2026-06-09days on market $299,000 Active 5 DOM
-
2026-06-08days on market $299,000 Active 4 DOM
-
2026-06-07pricedays on market $299,000 Active 3 DOM
-
2026-06-04days on market $349,900 Active 15 DOM
Show marketing remark (31 chars)
There are no remarks available.
-
2026-06-03days on market $349,900 Active 14 DOM
-
2026-06-02days on market $349,900 Active 13 DOM
-
2026-06-01days on market $349,900 Active 12 DOM
-
2026-05-31days on market $349,900 Active 11 DOM
-
2026-05-20$349,900 Active
-
2026-04-23soldstatus $237,500
-
1991-11-18soldstatus $70,000
ⓘ Source: listings_history table (triggers on properties + properties_extension) + one-shot
backfill from property_details.listing_events for pre-trigger history.
Tax reassessment forecast IL · Partial reset (capped growth)
- Current annual tax
- $3,678 · $307/mo
- Projected year-2 tax
- $5,233 · $436/mo
- Expected delta
- +$1,554/yr (+$130/mo · 42.3%)
ⓘ Screening estimate from a state-policy table — verify with the county assessor before closing.
Climate risk First Street
- Flood 1/10 Low FEMA zone X (unshaded) · 0% chance over 30 yrs
- Wildfire 1/10 Low
- Heat 3/10 Moderate 7 d/yr ≥104°F today · 14 d/yr by 30 yrs out
- Wind 2/10 Low
- Air quality 3/10 Moderate 4 unhealthy d/yr today · 4 by 30 yrs out
Nearby sold comps map
Loading sold comps map…
Walkable amenities ~0.75 mi
Loading nearby amenities…
Taxation est. · year 1
- Rental income
- $37,839
- − Mortgage interest
- −$16,749
- − Property taxes
- −$3,678
- − Insurance
- −$1,495
- − Repairs & maintenance
- −$3,027
- − Management
- −$3,027
- − Depreciation
- −$8,698
- Taxable income
- $1,165
- Est. tax owed @ 24.0%
- −$280
- After-tax cash flow
- $5,624/yr
For passive investors: Depreciation is non-cash, so a rental often shows a tax loss while cash-flowing — sheltering income. Rental losses are passive: they offset passive income freely, and up to $25,000/yr can offset ordinary (W-2) income if you actively participate and your MAGI is under $100k (phasing out to $0 by $150k); unused losses carry forward. On sale, claimed depreciation is recaptured at up to 25%, and gains may owe capital-gains tax (a 1031 exchange can defer both). Figures are a year-1 estimate at your 24.0% rate — not tax advice; consult a CPA.
Schools (NCES district)
- District
- CUSD 200
- NCES district ID
- 1742180
- Math proficiency
- 43% ▼ -6.00%
- Reading proficiency
- 44% ▼ -8.00%
- Median HH income
- $85,077
- Composite
- 40.75/100
- National rank
- #3653
- State rank
- #78 of 620 in IL
Livability — Wheaton
- Score
- 86/100
- State rank
- #17
- US rank
- #374
Category grades
Schools grade is shown separately in the Schools card above.
Census & demographics
- Census place
- Wheaton, IL
- County
- DuPage County · 904,569 people
- City population
- 59,857
- Metro
- Chicago-Naperville-Elgin, IL-IN-WI
- Population (ZIP)
- 28,815
- Household income
- $119,769
- Rent vs Own
- Severe rent burden
- 595.0
Population outlook (DuPage County) Hauer SSP2
- Today (2025)
- 960,187 people
- By 2030
- 965,850 · +0.6%
- By 2040
- 965,812 · +0.6%
- By 2050
- 954,890 · -0.6%
- By 2075
- 910,185 · -5.2%
- By 2100
- 816,255 · -15.0%
Race, ethnicity, and origin ACS 2023
- Neighborhood character
- Predominantly White (77%)
- Race & ethnicity
- White 77% Hispanic / Latino 8% Two or more races 8% Asian 7% Black 4%
- Hispanic origin (detail)
- Mexican 5% Puerto Rican 1%
- Common ancestry
- Romanian 7% Italian 3% Portuguese 3%
- Foreign-born
- 9% · Canada, Philippines, China
- Languages at home
- 87% English-only · Spanish 5% Other Indo-European 2% Other Asian/Pacific 2%
Political lean MEDSL · DuPage
- 2024 margin
- D (+13.3) · D 55.9% · R 42.5% · Other 1.6%
- 2008→2024 swing
- +2.5pp toward D · 2008: 10.8pp · 2024: 13.3pp
- All cycles
- 2024: D+13.3 2020: D+18.1 2016: D+14.1 2012: D+1.0 2008: D+10.8
Not yet ingested
- Civics
- —
Market trends
- HPI YoY
- ▼ -325.18%
- Current HPI
- 199.0585
- Rent YoY
- ▲ 4.56%
- Metro
- Chicago-Naperville-Elgin, IL-IN-WI
- State GDP YoY
- ▲ 1.59%
- F500 in state
- 60
Industry mix (Fortune 500 HQ in IL)
| Industry | F500 HQs | Revenue |
|---|---|---|
| Insurance | 4 | $201B |
|
||
| Consumer Goods | 4 | $87B |
|
||
| Industrial Machinery | 3 | $64B |
|
||
| Healthcare | 2 | $55B |
|
||
| Retail / Pharmacy | 1 | $148B |
|
||
| Agriculture / Food | 1 | $86B |
|
||
Price history
+327.1% since first listed6 events — show timeline
- 2026-06-04 Listed $299,000 MRED as Distributed by MLS Grid
- 2026-06-04 Listed $299,000 MRED as Distributed by MLS Grid
- 2026-06-04 Listing Removed — MRED as Distributed by MLS Grid
- 2026-05-20 Listed — MRED as Distributed by MLS Grid
- 2026-04-23 Sold (Public Records) $237,500 Public Records
- 1991-11-18 Sold (Public Records) $70,000 Public Records
Property tax history
+1.5%/yrLatest (2024): $3,678 · +6.2% YoY. Source: county tax records.
Cash-flow waterfall
monthlySold comps — $/sqft
last 12 mo · ≤1 miLoading sold comps…