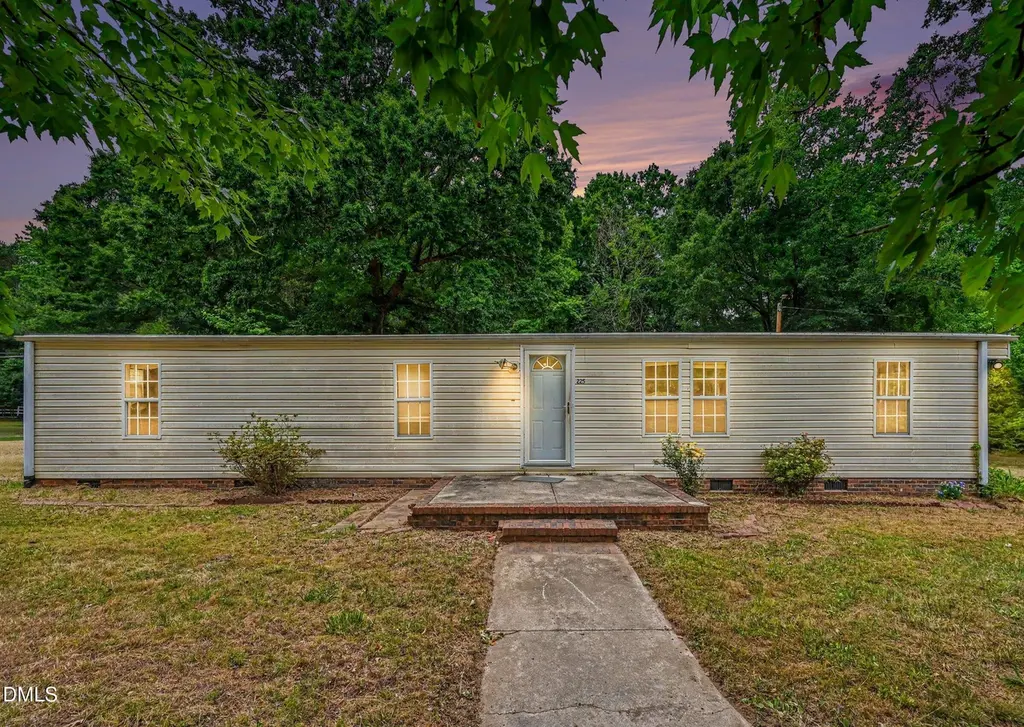
225 Greenestead Dr · Efland, NC
Flood risk 1/10 · Minimal
- FEMA flood zone
- X (unshaded)
- Chance of flooding over 30 yrs
- 0.0%
- Est. flood insurance / yr
- $507 – $1,088
Fire risk 2/10 · Minimal
- Est. fire insurance / yr
- $906 – $1,684
Heat risk 5/10 · Moderate
- Hot days now (above 104°F)
- 7 days/yr
- Hot days in 30 yrs
- 17 days/yr
Wind risk 5/10 · Moderate
- Chance of severe wind over 30 yrs
- 22.0%
Air-quality risk 2/10 · Minimal
- Unhealthy air days now
- 1 days/yr
- Unhealthy air days in 30 yrs
- 2 days/yr
Risk factors via First Street. Map © Google.
Why this score? — see what drove the B- grade
The composite is a weighted blend of 9 inputs, each scored 0–100. Each bar is that input's sub-score; the figure is the points it added to the 100-point composite (weight × sub-score).
- Cash flow +27.2/30.0
- ARV discount +11.2/15.0
- DSCR +9.4/10.0
- 1% rule +6.3/10.0
- Schools +3.5/10.0
- Livability +3.2/5.0
- Rent growth +2.5/5.0
- Condition / age +2.5/5.0
- Appreciation +0.0/10.0
$155,000
🖨 Deal sheet 📄 Offer letter ✓ Due diligence
Listing remarks
Investment opportunity in growing Orange County! This property offers strong potential for investors, renovators, or buyers seeking a value-add opportunity in a desirable location. Conveniently situated with easy access to I-40/I-85, Hillsborough, Mebane, Chapel Hill, and Durham, the property benefits from proximity to major employment centers, healthcare, shopping, and dining. The generous lot provides flexibility for future improvements, outdoor amenities, or long-term appreciation potential. Whether you're looking to expand your rental portfolio, renovate and resell, or hold as a long-term investment, this property presents an opportunity to build equity in a high-demand area. Property i
Key facts
- Outdoor amenities
- 0.26 acre lot
- Built 1971
Tags
Property features AI
Finance
- Other: Lot size approximately 0.26 acres; Living area approximately 1,302 (above-grade finished); Located in Orange County
- HOA & community: No homeowners association
Exterior
- Utilities: Well water; Septic tank
- Home design: Single-story house; Double wide mobile home body type; Shingle roof
- Construction: Vinyl siding construction; Built as a house/structure
- Exterior features: Front porch; Rear porch; Gravel private-maintained road access
Interior
- Bedrooms: Three bedrooms (all on the main level)
- Flooring: Carpet; Tile
- Bathrooms: Two full bathrooms
- Heating & cooling: No listed heating system; Central air; Ceiling fan(s)
- Interior features: Carpet and tile flooring
Neighborhood map
What this means for you Summary
Snapshot
- This is a 3-bed/2.0-bath manufactured listed at $155k.
Deal economics
- At list price, monthly cash flow is $442 ($5k/yr) — positive.
- The deal already cash-flows at list — no discount required.
- Meets the 1% rule at list price ($2k rent vs $155k).
Location & tenants
- Location reads 63/100 on livability (#380 in NC) — a middle-class / working-renter tenant base. Strengths: employment A+, cost of living A+, housing A+; Watch: crime D+, schools D-, amenities F.
- Orange County Schools (rural): math 35% / reading 44% proficiency, ranked #108 of 178 in NC (top 61%) — families likely to look elsewhere, expect single-tenant / working-renter base with shorter leases.
- Market conditions: 45 active listings in the ZIP; 1 comparable units currently listed for rent nearby; 375 units permitted in Orange County in 2024 (34 in 5+ unit buildings).
Forward outlook
- Local home prices are declining (-3.0%/yr); year-one equity from $1k of loan paydown is wiped out by about $5k of value loss. Plan a longer hold.
- Orange County population projected at +28% by 2050 — long-run rental-demand tailwind backs the buy-and-hold thesis.
- At projected returns (-3.0% appreciation + 3.0% rent growth), your $43k cash investment doubles in ~10 years — after that, you're playing with house money.
Negotiation context
- Only 6 days on market — expect competitive offers; lowballing is unlikely to land.
- Current owner paid $2k; list at $155k implies a 6639% gain — meaningful room to come down on a strong offer.
Risks & watch-outs
- Climate carrying-cost: moderate wind risk, 22% chance of damaging wind over 30y; extreme-heat days projected 7→17/yr by 2055 (HVAC capex compounding) — expect insurance premiums to compound above CPI over the hold.
Questions for the listing agent
- Built in 1971 — when were the roof, HVAC, electrical panel, plumbing, and water heater last replaced?
- Is there a deadline driving the sale (1031 exchange, divorce, estate, relocation)? That informs how much negotiation room exists.
- Schools are D-rated, which usually means shorter tenancies and higher turnover. Who's the typical renter profile here, and what's been the actual vacancy rate?
- Crime grade is D in this area — have there been break-ins, vandalism, or insurance claims at this property in the last 3 years? What carrier currently insures it and at what premium?
- What's the average days-on-market for RENTAL listings here right now (not sales)? A rising rental-DOM trend means longer vacancies and softer asking-rent achievability than the comps imply.
- What's the recent tenant-quality profile in this submarket — average credit score on applications, eviction rate, late-payment / NSF rate, and stable-employment percentage? A property-management company in the area should have these aggregated.
- How much new for-sale + rental construction is in the pipeline within 1–3 miles? Heavy new supply typically softens prices + rents 12–24 months out; constrained supply supports both.
Investment metrics
- 1% rule
- 1.13% ✓
- Cap rate
- 9.72%
- Cash-on-cash
- 12.23%
- DSCR
- 1.54
- GRM
- 7.4
CMA / ARV
- ARV (on-the-fly)
- $168,728
- Comps found
- 1
Show comp detail 1 sale within ~0.75 mi
| Address | Dist | Beds/Ba | Sqft | Sold | Price | $/sf | Match |
|---|---|---|---|---|---|---|---|
| 326 Gaines Chapel Rd | 0.31mi | 3/2.0 | 1,132 (-12%) | 6mo | $148,000 | $131 | 60 |
Match score weights: distance 35% · size 25% · config 20% · recency 20%. Top-matched comps best support the ARV.
Projected returns pro-forma
-3.0% appreciation · 3.0% rent growth · sell at horizon
- IRR
- 1.8%
- Equity multiple
- 1.07×
- Total profit
- $2,996
- Equity at exit
- $23,111
- IRR
- 11.4%
- Equity multiple
- 1.89×
- Total profit
- $38,659
- Equity at exit
- $13,402
Cash invested: $43,400 (down + closing). Projections, not guarantees.
Landlord ↔ Tenant lean methodology
- Overall (STATE)
- 85 Strongly Landlord-Friendly
- State North Carolina
- 85 Strongly Landlord-Friendly · R+3
- County
- — inherits STATE
- City
- — inherits STATE
ZIP-level market 27243
- Home prices YoY
- -27.7%
- Active inventory
- 45
- Price-to-rent
- 7.4×
Monthly cashflow live
- Estimated rent
- $1,750 medium interval (Pro) →
- Mortgage (P&I)
- −$813
- Tax from tax record
- −$63 /mo · $754/yr
- Insurance
- −$65
- HOA
- −$0
- Vacancy / Maint / Mgmt
- −$368
- Net cashflow
- $442
Break-even live
UW: 25.0% down · 7.5% · 30yr · 1.5% tax · 5.0% vac · 8.0% maint · 8.0% mgmt
Financing live
Cash to close
- Down payment
- $38,750
- Closing costs
- $4,650
- Reserves months
- —
- Total cash needed
- —
Loan-product check · same deal, 3 products live
Conventional
25% down · 7.5% · 30yr
- Down + closing
- —
- Monthly P&I
- —
- Monthly cashflow
- —
- DSCR
- —
- Eligible?
- —
Personal DTI + credit; lowest rate.
DSCR
20% down · 8.5% · 30yr
- Down + closing
- —
- Monthly P&I
- —
- Monthly cashflow
- —
- DSCR
- —
- Eligible?
- —
No personal income docs; deal must DSCR.
Hard money
10% down · 12.0% · 12mo
- Down + closing
- —
- Monthly P&I
- —
- Monthly cashflow
- —
- DSCR
- —
- Eligible?
- —
Short-term bridge; refi at stabilization.
Rent comps 1 comps
| Address | Beds | Baths | Sqft | Rent | $/sqft | DOM | Units | Dist |
|---|---|---|---|---|---|---|---|---|
| 3511 Forrest Ave Efland, NC | 4.0 | 1.5 | 1163 | $1,750 | $1.50 | 14d | 1 | 0.79mi |
Listing history 6 events
-
2026-06-18days on market $155,000 Active 6 DOM
-
2026-06-17days on market $155,000 Active 5 DOM
-
2026-06-16days on market $155,000 Active 4 DOM
-
2026-06-15days on market $155,000 Active 3 DOM
-
2026-06-13remarks 699-char remark
-
2026-06-13$155,000 Active 1 DOM
ⓘ Source: listings_history table (triggers on properties + properties_extension) + one-shot
backfill from property_details.listing_events for pre-trigger history.
Tax reassessment forecast NC · Resets to sale price
- Current annual tax
- $754 · $63/mo
- Projected year-2 tax
- $1,271 · $106/mo
- Expected delta
- +$517/yr (+$43/mo · 68.6%)
ⓘ Screening estimate from a state-policy table — verify with the county assessor before closing.
Climate risk First Street
- Flood 1/10 Low FEMA zone X (unshaded) · 0% chance over 30 yrs
- Wildfire 2/10 Low
- Heat 5/10 Major 7 d/yr ≥104°F today · 17 d/yr by 30 yrs out
- Wind 5/10 Major 22% chance of damaging wind over 30 yrs
- Air quality 2/10 Low 1 unhealthy d/yr today · 2 by 30 yrs out
Nearby sold comps map
Loading sold comps map…
Walkable amenities ~0.75 mi
Loading nearby amenities…
Taxation est. · year 1
- Rental income
- $21,000
- − Mortgage interest
- −$8,682
- − Property taxes
- −$754
- − Insurance
- −$775
- − Repairs & maintenance
- −$1,680
- − Management
- −$1,680
- − Depreciation
- −$4,509
- Taxable income
- $2,920
- Est. tax owed @ 24.0%
- −$701
- After-tax cash flow
- $4,606/yr
For passive investors: Depreciation is non-cash, so a rental often shows a tax loss while cash-flowing — sheltering income. Rental losses are passive: they offset passive income freely, and up to $25,000/yr can offset ordinary (W-2) income if you actively participate and your MAGI is under $100k (phasing out to $0 by $150k); unused losses carry forward. On sale, claimed depreciation is recaptured at up to 25%, and gains may owe capital-gains tax (a 1031 exchange can defer both). Figures are a year-1 estimate at your 24.0% rate — not tax advice; consult a CPA.
Schools (NCES district)
- District
- Orange County Schools
- NCES district ID
- 3703480
- Math proficiency
- 35% ▼ -8.00%
- Reading proficiency
- 44% ▼ -2.00%
- Median HH income
- $57,908
- Composite
- 34.8/100
- National rank
- #5109
- State rank
- #108 of 178 in NC
Livability — Efland
- Score
- 63/100
- State rank
- #380
- US rank
- #14987
Category grades
Schools grade is shown separately in the Schools card above.
Census & demographics
- Census place
- Efland, NC
- Population (ZIP)
- 5,506
Population outlook (Orange County) Hauer SSP2
- Today (2025)
- 158,781 people
- By 2030
- 168,367 · +6.0%
- By 2040
- 186,192 · +17.3%
- By 2050
- 203,801 · +28.4%
- By 2075
- 249,160 · +56.9%
- By 2100
- 285,614 · +79.9%
Race, ethnicity, and origin ACS 2023
- Neighborhood character
- Predominantly White (85%)
- Race & ethnicity
- White 85% Black 6% Two or more races 6% Hispanic / Latino 4%
- Common ancestry
- Serbian 4% Italian 3% Iranian 3%
- Foreign-born
- 5% · Canada
- Languages at home
- 95% English-only · Arabic 3% Spanish 1%
Political lean MEDSL · Orange
- 2024 margin
- Solid D (+51.1) · D 74.9% · R 23.8% · Other 1.4%
- 2008→2024 swing
- +6.3pp toward D · 2008: 44.8pp · 2024: 51.1pp
- All cycles
- 2024: D+51.1 2020: D+51.1 2016: D+51.0 2012: D+42.2 2008: D+44.8
Not yet ingested
- Civics
- —
Market trends
- HPI YoY
- ▼ -85.02%
- Current HPI
- 222.2193
- Rent YoY
- —
- Metro
- —
- State GDP YoY
- ▲ 3.28%
- F500 in state
- 26
Industry mix (Fortune 500 HQ in NC)
| Industry | F500 HQs | Revenue |
|---|---|---|
| Financial Services | 2 | $213B |
|
||
| Retail | 2 | $95B |
|
||
| Industrial Conglomerate | 1 | $38B |
|
||
| Metals / Steel | 1 | $35B |
|
||
| Utilities | 1 | $30B |
|
||
| Industrial Machinery | 1 | $19B |
|
||
Price history
+6639.1% since first listed2 events — show timeline
- 2026-06-11 Listed $155,000 TMLS
- 1987-08-21 Sold (Public Records) $2,300 Public Records
Property tax history
+2.4%/yrLatest (2025): $754 · +47.9% YoY. Source: county tax records.
Cash-flow waterfall
monthlySold comps — $/sqft
last 12 mo · ≤1 miLoading sold comps…