167 Collier Rd · London, KY
Flood risk 1/10 · Minimal
- FEMA flood zone
- X (unshaded)
- Chance of flooding over 30 yrs
- 0.0%
- Est. flood insurance / yr
- $507 – $1,088
Fire risk 8/10 · Major
- Est. fire insurance / yr
- $839 – $1,559
Heat risk 3/10 · Minor
- Hot days now (above 99°F)
- 7 days/yr
- Hot days in 30 yrs
- 20 days/yr
Wind risk 2/10 · Minimal
- Chance of severe wind over 30 yrs
- 3.0%
Air-quality risk 1/10 · Minimal
- Unhealthy air days now
- 0 days/yr
- Unhealthy air days in 30 yrs
- 0 days/yr
Risk factors via First Street. Map © Google.
Why this score? — see what drove the F grade
The composite is a weighted blend of 9 inputs, each scored 0–100. Each bar is that input's sub-score; the figure is the points it added to the 100-point composite (weight × sub-score).
- Cash flow +9.2/30.0
- ARV discount +7.5/15.0
- Schools +4.4/10.0
- Livability +3.4/5.0
- DSCR +2.6/10.0
- Rent growth +2.5/5.0
- Condition / age +2.5/5.0
- 1% rule +1.9/10.0
- Appreciation +0.0/10.0
$150,000
🖨 Deal sheet (PDF) 📄 Offer letter ✓ Due diligence
Listing remarks MLS
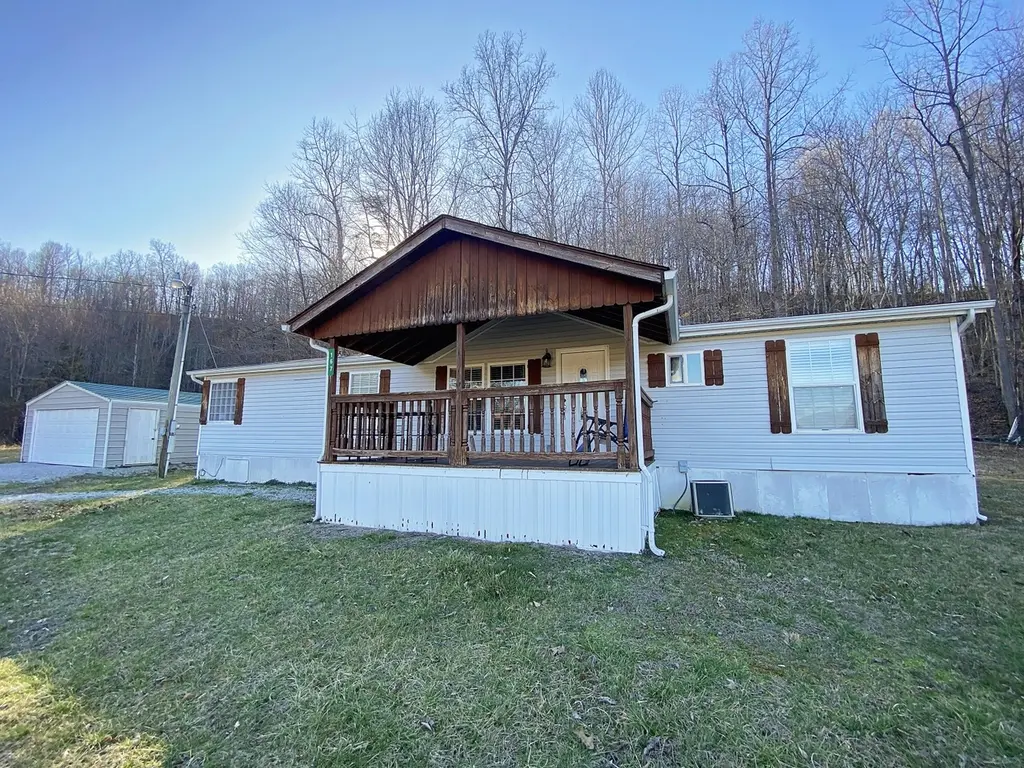
This cozy Oakwood doublewide sits on approximately 1.137 acres with a peaceful wooded backdrop that offers both privacy and room to breathe. Inside, you'll find 3 bedrooms and 2 full bathrooms, along with a separate dining room featuring doors that is currently being used as a 4th bedroom - perfect for guests, a home office, playroom, or flex space to fit your needs. The layout offers comfortable living with defined spaces while still feeling open and functional. Step outside and enjoy the natural setting, with woods bordering the back of the property for added privacy and a quiet country feel - all while remaining convenient to town. The detached 20' x 24' one-car garage provides ample space for parking, storage, or a workshop setup. The home does need some TLC, but it offers a great opportunity for buyers looking to add their own updates and build equity on over an acre in a desirable rural setting. If you've been looking for space, privacy, and potential just outside the city limits, this property is worth a look.
Key facts
- Separate dining room
- Flex space
- Detached garage
Tags
Neighborhood map
What this means for you Summary
Snapshot
- This is a 3-bed/2.0-bath other listed at $150k.
Deal economics
- At list price, monthly cash flow is $-113 ($-1k/yr) — negative.
- To cash-flow at today's rent, offer at most $130k (13.3% below list).
- To meet the 1% rule (rent ≥ 1% of price), the offer needs to be $103k (31.3% below list).
- Recommended offer: $103k (31.3% below list) — sets the bar for 1% rule.
- Cap rate 5.4% vs local median 2.2% in London — top-decile yield for the area; either an underpriced asset or a hidden risk that comps aren't pricing in. Stress-test before assuming the spread holds.
Location & tenants
- Location reads 68/100 on livability (#202 in KY) — a middle-class / working-renter tenant base. Strengths: cost of living A+, housing A+, health & safety B+; Watch: schools D+, employment D+, amenities F.
- Laurel County (town): math 51% / reading 56% proficiency, ranked #8 of 165 in KY (top 5%) — acceptable for families but not a draw, mixed tenant base, ~2y average lease.
- Market conditions: 248 active listings in the ZIP; 16 units permitted in Laurel County in 2024 (0 in 5+ unit buildings).
Forward outlook
- Local home prices are declining (-3.0%/yr); year-one equity from $1k of loan paydown is wiped out by about $4k of value loss. Plan a longer hold.
Negotiation context
- It's been on market 90 days — a 6% lower offer ($141k) is reasonable based on typical stale-listing flexibility.
- 4 sale attempts since 15y ago with the ask held roughly flat each time — persistent listings suggest the price (not the market) is what's stuck; bring a comps-based counter.
- Current owner paid $120k; 25% above their basis — modest negotiation headroom, anchor on the comps not their cost.
Risks & watch-outs
- Climate carrying-cost: severe wildfire risk — expect insurance premiums to compound above CPI over the hold.
Questions for the listing agent
- What do current leases actually rent for vs. the listed asking? Can we see a recent rent roll and the last 12 months of T-12 income?
- It's been on market 90 days. Have you received any prior offers? Is the seller open to a 31% concession, seller financing, or rate buy-down credit?
- Why hasn't it sold? Are there any deal-killer items the seller is aware of (foundation, flood, title, zoning, code violations)?
- Is there a deadline driving the sale (1031 exchange, divorce, estate, relocation)? That informs how much negotiation room exists.
- Schools are D-rated, which usually means shorter tenancies and higher turnover. Who's the typical renter profile here, and what's been the actual vacancy rate?
- The area grade is low — what's the realistic commute time and amenity access for the typical tenant pool here? Any planned neighborhood developments (good or bad) we should know about?
- What's the average days-on-market for RENTAL listings here right now (not sales)? A rising rental-DOM trend means longer vacancies and softer asking-rent achievability than the comps imply.
- What's the recent tenant-quality profile in this submarket — average credit score on applications, eviction rate, late-payment / NSF rate, and stable-employment percentage? A property-management company in the area should have these aggregated.
- How much new for-sale + rental construction is in the pipeline within 1–3 miles? Heavy new supply typically softens prices + rents 12–24 months out; constrained supply supports both.
Investment metrics
- 1% rule
- 0.69% ✗
- Cap rate
- 5.39%
- Cash-on-cash
- -3.22%
- DSCR
- 0.86
- GRM
- 12.1
CMA / ARV
No comps found within radius.
Projected returns pro-forma
-3.0% appreciation · 3.0% rent growth · sell at horizon
- IRR
- -21.7%
- Equity multiple
- 0.25×
- Total profit
- $-31,538
- Equity at exit
- $22,365
- IRR
- -15.6%
- Equity multiple
- 0.12×
- Total profit
- $-36,919
- Equity at exit
- $12,969
Cash invested: $42,000 (down + closing). Projections, not guarantees.
Landlord ↔ Tenant lean methodology
- Overall (STATE)
- 83 Strongly Landlord-Friendly
- State Kentucky
- 83 Strongly Landlord-Friendly · R+16
- County
- — inherits STATE
- City
- — inherits STATE
ZIP-level market 40741
- Home prices YoY
- -9.0%
- Active inventory
- 248
- Price-to-rent
- 12.1×
Monthly cashflow live
- Estimated rent
- $1,031 medium interval (Pro) →
- Mortgage (P&I)
- −$787
- Tax from tax record
- −$78 /mo · $934/yr
- Insurance
- −$62
- HOA
- −$0
- Vacancy / Maint / Mgmt
- −$216
- Net cashflow
- $-113
Break-even live
Sensitivity live
| Price | -10% $-28 | -5% $-70 | +0% $-113 | +5% $-155 | +10% $-198 |
|---|---|---|---|---|---|
| Rent | -10% $-194 | -5% $-153 | +0% $-113 | +5% $-72 | +10% $-31 |
| Rate | -1.0pp $-37 | -0.5pp $-75 | base $-113 | +0.5pp $-152 | +1.0pp $-191 |
UW: 25.0% down · 7.5% · 30yr · 1.5% tax · 5.0% vac · 8.0% maint · 8.0% mgmt
Financing live
Cash to close
- Down payment
- $37,500
- Closing costs
- $4,500
- Reserves months
- —
- Total cash needed
- —
Loan-product check · same deal, 3 products live
Conventional
25% down · 7.5% · 30yr
- Down + closing
- —
- Monthly P&I
- —
- Monthly cashflow
- —
- DSCR
- —
- Eligible?
- —
Personal DTI + credit; lowest rate.
DSCR
20% down · 8.5% · 30yr
- Down + closing
- —
- Monthly P&I
- —
- Monthly cashflow
- —
- DSCR
- —
- Eligible?
- —
No personal income docs; deal must DSCR.
Hard money
10% down · 12.0% · 12mo
- Down + closing
- —
- Monthly P&I
- —
- Monthly cashflow
- —
- DSCR
- —
- Eligible?
- —
Short-term bridge; refi at stabilization.
Listing history 17 events
-
2026-05-31days on market $150,000 Active 90 DOM
-
2026-05-31days on market $150,000 Active 89 DOM
-
2026-02-28$150,000 Active 1037-char remark
Show marketing remark (1037 chars)
This cozy Oakwood doublewide sits on approximately 1.137 acres with a peaceful wooded backdrop that offers both privacy and room to breathe. Inside, you'll find 3 bedrooms and 2 full bathrooms, along with a separate dining room featuring doors that is currently being used as a 4th bedroom - perfect for guests, a home office, playroom, or flex space to fit your needs. The layout offers comfortable living with defined spaces while still feeling open and functional. Step outside and enjoy the natural setting, with woods bordering the back of the property for added privacy and a quiet country feel - all while remaining convenient to town. The detached 20' x 24' one-car garage provides ample space for parking, storage, or a workshop setup. The home does need some TLC, but it offers a great opportunity for buyers looking to add their own updates and build equity on over an acre in a desirable rural setting. If you've been looking for space, privacy, and potential just outside the city limits, this property is worth a look.
-
2024-10-04historical
-
2024-09-27$145,000 Active
-
2023-01-26historical
-
2023-01-26soldstatus $120,000 Closed
-
2023-01-26soldstatus $120,000
-
2022-12-27status Pending
-
2022-12-17historical Contingent
-
2022-12-05$129,900 Active
-
2017-10-23soldstatus $5,000
-
2011-12-12soldstatus $17,500
-
2011-12-01historical
-
2011-10-11$27,900
-
2004-06-10soldstatus $15,000
-
2002-04-01soldstatus $15,000
ⓘ Source: listings_history table (triggers on properties + properties_extension) + one-shot
backfill from property_details.listing_events for pre-trigger history.
Tax reassessment forecast KY · Resets to sale price
- Current annual tax
- $934 · $78/mo
- Projected year-2 tax
- $1,290 · $108/mo
- Expected delta
- +$356/yr (+$30/mo · 38.2%)
ⓘ Screening estimate from a state-policy table — verify with the county assessor before closing.
Climate risk First Street
- Flood 1/10 Low FEMA zone X (unshaded) · 0% chance over 30 yrs
- Wildfire 8/10 Severe
- Heat 3/10 Moderate 7 d/yr ≥99°F today · 20 d/yr by 30 yrs out
- Wind 2/10 Low 3% chance of damaging wind over 30 yrs
- Air quality 1/10 Low 0 unhealthy d/yr today · 0 by 30 yrs out
Nearby sold comps map
Loading sold comps map…
Walkable amenities ~0.75 mi
Loading nearby amenities…
Taxation est. · year 1
- Rental income
- $12,367
- − Mortgage interest
- −$8,402
- − Property taxes
- −$934
- − Insurance
- −$750
- − Repairs & maintenance
- −$989
- − Management
- −$989
- − Depreciation
- −$4,364
- Taxable loss
- −$4,061
- Est. tax savings @ 24.0%
- +$975
- After-tax cash flow
- $-378/yr
For passive investors: Depreciation is non-cash, so a rental often shows a tax loss while cash-flowing — sheltering income. Rental losses are passive: they offset passive income freely, and up to $25,000/yr can offset ordinary (W-2) income if you actively participate and your MAGI is under $100k (phasing out to $0 by $150k); unused losses carry forward. On sale, claimed depreciation is recaptured at up to 25%, and gains may owe capital-gains tax (a 1031 exchange can defer both). Figures are a year-1 estimate at your 24.0% rate — not tax advice; consult a CPA.
Schools (NCES district)
- District
- Laurel County
- NCES district ID
- 2103210
- Math proficiency
- 51% ▼ -9.00%
- Reading proficiency
- 56% ▼ -11.00%
- Median HH income
- $36,577
- Composite
- 44.39/100
- National rank
- #2814
- State rank
- #8 of 165 in KY
Livability — London
- Score
- 68/100
- State rank
- #202
- US rank
- #10028
Category grades
Schools grade is shown separately in the Schools card above.
Census & demographics
- Population (ZIP)
- 23,303
Population outlook (Laurel County) Hauer SSP2
- Today (2025)
- 62,602 people
- By 2030
- 63,310 · +1.1%
- By 2040
- 63,706 · +1.8%
- By 2050
- 62,705 · +0.2%
- By 2075
- 58,574 · -6.4%
- By 2100
- 50,888 · -18.7%
Race, ethnicity, and origin ACS 2023
- Neighborhood character
- Predominantly White (96%)
- Race & ethnicity
- White 96% Two or more races 2% Hispanic / Latino 2%
- Common ancestry
- Italian 1% Slovak 1% Serbian 1%
- Foreign-born
- 1% · Canada
- Languages at home
- 98% English-only · Spanish 1%
Political lean MEDSL · Laurel
- 2024 margin
- Solid R (+69.9) · D 14.5% · R 84.3% · Other 1.2%
- 2008→2024 swing
- -11.9pp toward R · 2008: -58.0pp · 2024: -69.9pp
- All cycles
- 2024: R+69.9 2020: R+66.7 2016: R+69.1 2012: R+63.6 2008: R+58.0
Not yet ingested
- Civics
- —
Market trends
- HPI YoY
- ▼ -24.45%
- Current HPI
- 247.1396
- Rent YoY
- —
- Metro
- —
- State GDP YoY
- ▲ 1.81%
- F500 in state
- 4
Industry mix (Fortune 500 HQ in KY)
| Industry | F500 HQs | Revenue |
|---|---|---|
| Healthcare | 1 | $118B |
|
||
| Food / Beverage | 1 | $7B |
|
||
Price history
+900.0% since first listed15 events — show timeline
- 2026-02-28 Listed $150,000 ImagineMLS
- 2024-10-04 Listing Removed — ImagineMLS
- 2024-09-27 Listed $145,000 ImagineMLS
- 2023-01-26 Listing Removed — ImagineMLS
- 2023-01-26 Sold (Public Records) $120,000 Public Records
- 2023-01-26 Sold (MLS) $120,000 ImagineMLS
- 2022-12-27 Pending — ImagineMLS
- 2022-12-17 Contingent — ImagineMLS
- 2022-12-05 Listed $129,900 ImagineMLS
- 2017-10-23 Sold (Public Records) $5,000 Public Records
- 2011-12-12 Sold (MLS) $17,500 ImagineMLS
- 2011-12-01 Listing Removed — ImagineMLS
- 2011-10-11 Listed $27,900 ImagineMLS
- 2004-06-10 Sold (Public Records) $15,000 Public Records
- 2002-04-01 Sold (Public Records) $15,000 Public Records
Property tax history
+19.1%/yrLatest (2025): $934 · +0.9% YoY. Source: county tax records.
Cash-flow waterfall
monthlySold comps — $/sqft
last 12 mo · ≤1 miLoading sold comps…