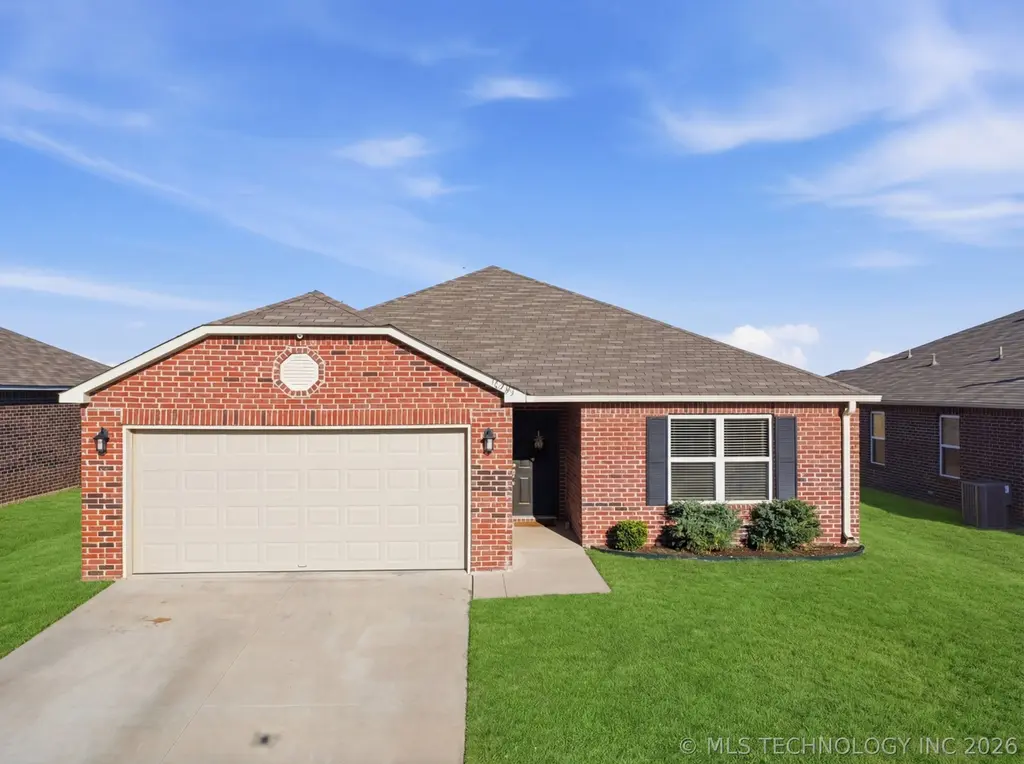
16205 S 86th EastAvenue · Bixby, OK
Flood risk 4/10 · Minor
- FEMA flood zone
- X (shaded)
- Chance of flooding over 30 yrs
- 0.22%
- Est. flood insurance / yr
- $507 – $1,088
Fire risk 3/10 · Minor
- Est. fire insurance / yr
- $2,463 – $4,575
Heat risk 7/10 · Major
- Hot days now (above 111°F)
- 7 days/yr
- Hot days in 30 yrs
- 18 days/yr
Wind risk 3/10 · Minor
- Chance of severe wind over 30 yrs
- 6.0%
Air-quality risk 2/10 · Minimal
- Unhealthy air days now
- 0 days/yr
- Unhealthy air days in 30 yrs
- 1 days/yr
Risk factors via First Street. Map © Google.
Why this score? — see what drove the D grade
The composite is a weighted blend of 9 inputs, each scored 0–100. Each bar is that input's sub-score; the figure is the points it added to the 100-point composite (weight × sub-score).
- Cash flow +12.0/30.0
- ARV discount +8.4/15.0
- Condition / age +4.0/5.0
- Livability +3.6/5.0
- 1% rule +3.5/10.0
- DSCR +3.5/10.0
- Schools +3.5/10.0
- Rent growth +3.3/5.0
- Appreciation +0.0/10.0
$255,000
🖨 Deal sheet (PDF) 📄 Offer letter ✓ Due diligence
Listing remarks MLS
NEW CONSTRUCTION!! Our newest plan. .. the Fenway! 3 bed 2 bath. This unique floorplan has a large living room, oversized breakfast nook. Won't last long. Under construction estimated completion March 2022. Bixby Schools.
Key facts
- Large living area
- Oversized kitchen
- Spacious floorpan
Tags
Neighborhood map
What this means for you Summary
Snapshot
- This is a 3-bed/2.0-bath single-family listed at $255k. Condition is rated good.
Deal economics
- At list price, monthly cash flow is $-62 ($-748/yr) — negative.
- To cash-flow at today's rent, offer at most $244k (4.3% below list).
- To meet the 1% rule (rent ≥ 1% of price), the offer needs to be $216k (15.3% below list).
- Recommended offer: $216k (15.3% below list) — sets the bar for 1% rule.
- Cap rate 6.0% vs local median 3.7% in Bixby — top-decile yield for the area; either an underpriced asset or a hidden risk that comps aren't pricing in. Stress-test before assuming the spread holds.
Location & tenants
- Location reads 72/100 on livability (#24 in OK) — a middle-class / working-renter tenant base. Strengths: crime A+, employment A+, housing A+; Watch: amenities F, commute F, health & safety F.
- Bixby (suburban): math 39% / reading 36% proficiency, ranked #15 of 270 in OK (top 6%) — families likely to look elsewhere, expect single-tenant / working-renter base with shorter leases; only 19% free/reduced lunch — higher-income household profile.
- Zoned schools: Central Es (math 32% / reading 32%, grade F, #213 of 845 statewide, top 28%, 646 students, 0% FRL); Bixby Ms (math 37% / reading 30%, grade F, #33 of 345 statewide, top 10%, 1,216 students, 0% FRL); Bixby Hs (math 42% / reading 48%, grade D-, #13 of 447 statewide, top 3%, 2,102 students, 0% FRL) — zoned schools average 0% FRL vs 19% district-wide (19 pts lower); this property's tenant base skews higher-income than the district average.
- Market conditions: Rents rising (+3.3%/yr); 795 active listings in the ZIP; 4 comparable units currently listed for rent nearby; rentals leasing fast (median 4d on market — plan ~1-2 weeks tenant-placement turnaround); solid renter incomes; 2,818 units permitted in Tulsa County in 2024 (518 in 5+ unit buildings).
Forward outlook
- Local home prices are declining (-3.0%/yr); year-one equity from $2k of loan paydown is wiped out by about $8k of value loss. Plan a longer hold.
- Tulsa County population projected at +30% by 2050 — long-run rental-demand tailwind backs the buy-and-hold thesis.
Negotiation context
- Only 5 days on market — expect competitive offers; lowballing is unlikely to land.
- 2 sale attempts since 4y ago with the ask held roughly flat each time — persistent listings suggest the price (not the market) is what's stuck; bring a comps-based counter.
Risks & watch-outs
- Climate carrying-cost: extreme-heat days projected 7→18/yr by 2055 (HVAC capex compounding) — expect insurance premiums to compound above CPI over the hold.
Questions for the listing agent
- What do current leases actually rent for vs. the listed asking? Can we see a recent rent roll and the last 12 months of T-12 income?
- What does the HOA fee cover, when was the last increase, and are there any pending special assessments or reserve-fund shortfalls?
- Is there a deadline driving the sale (1031 exchange, divorce, estate, relocation)? That informs how much negotiation room exists.
- Schools are B-rated — typically a magnet for longer-tenancy family renters. What's the average tenant stay here, and is there a school-zone premium baked into asking?
- The area grade is low — what's the realistic commute time and amenity access for the typical tenant pool here? Any planned neighborhood developments (good or bad) we should know about?
- What's the average days-on-market for RENTAL listings here right now (not sales)? A rising rental-DOM trend means longer vacancies and softer asking-rent achievability than the comps imply.
- What's the recent tenant-quality profile in this submarket — average credit score on applications, eviction rate, late-payment / NSF rate, and stable-employment percentage? A property-management company in the area should have these aggregated.
- How much new for-sale + rental construction is in the pipeline within 1–3 miles? Heavy new supply typically softens prices + rents 12–24 months out; constrained supply supports both.
Investment metrics
- 1% rule
- 0.85% ✗
- Cap rate
- 6.00%
- Cash-on-cash
- -1.05%
- DSCR
- 0.95
- GRM
- 9.8
CMA / ARV
- ARV (on-the-fly)
- $260,236
- Comps found
- 12
Show comp detail 12 sales within ~0.75 mi
| Address | Dist | Beds/Ba | Sqft | Sold | Price | $/sf | Match |
|---|---|---|---|---|---|---|---|
| 8617 E 164th St S | 0.37mi | 3/2.0 | 1,446 (-1%) | 1mo | $263,700 | $182 | 80 |
| 8366 E 160th Pl S | 0.24mi | 3/2.0 | 1,390 (-5%) | 2mo | $247,500 | $178 | 79 |
| 8436 E 160th Pl | 0.27mi | 3/2.0 | 1,388 (-5%) | 4mo | $225,000 | $162 | 76 |
| 8619 E 164th Ct S | 0.41mi | 3/2.0 | 1,446 (-1%) | 4mo | $263,919 | $183 | 76 |
| 8325 E 163rd St S | 0.13mi | 4/2.0 (+1) | 1,590 (+9%) | 3mo | $272,000 | $171 | 72 |
| 8653 E 160th St S | 0.42mi | 3/2.0 | 1,381 (-6%) | 1mo | $237,500 | $172 | 71 |
| 8613 E 164th St S | 0.36mi | 3/2.0 | 1,337 (-8%) | 2mo | $249,730 | $187 | 68 |
| 8734 E 160th Pl S | 0.39mi | 3/2.0 | 1,341 (-8%) | 1mo | $235,000 | $175 | 67 |
| 7540 E 158th St S | 0.56mi | 3/2.0 | 1,399 (-4%) | 1mo | $257,000 | $184 | 66 |
| 16113 S 88th East Ave | 0.45mi | 3/2.0 | 1,336 (-9%) | 3mo | $235,000 | $176 | 62 |
| 7518 E 156th Pl S | 0.71mi | 3/2.0 | 1,575 (+8%) | 2mo | $284,900 | $181 | 52 |
| 7507 E 156th Pl S | 0.75mi | 4/2.0 (+1) | 1,614 (+10%) | 4mo | $285,000 | $177 | 40 |
Match score weights: distance 35% · size 25% · config 20% · recency 20%. Top-matched comps best support the ARV.
Projected returns pro-forma
-3.0% appreciation · 3.34% rent growth · sell at horizon
- IRR
- -17.6%
- Equity multiple
- 0.38×
- Total profit
- $-44,514
- Equity at exit
- $38,021
- IRR
- -9.1%
- Equity multiple
- 0.43×
- Total profit
- $-40,667
- Equity at exit
- $22,048
Cash invested: $71,400 (down + closing). Projections, not guarantees.
Landlord ↔ Tenant lean methodology
- Overall (STATE)
- 83 Strongly Landlord-Friendly
- State Oklahoma
- 83 Strongly Landlord-Friendly · R+20
- County
- — inherits STATE
- City
- — inherits STATE
ZIP-level market 74008
- Rents YoY
- 3.3%
- Active inventory
- 795
- Price-to-rent
- 9.8×
Monthly cashflow live
- Estimated rent
- $2,159 medium interval (Pro) →
- Mortgage (P&I)
- −$1,337
- Tax from tax record
- −$303 /mo · $3,639/yr
- Insurance
- −$106
- HOA
- −$21
- Vacancy / Maint / Mgmt
- −$453
- Net cashflow
- $-62
Break-even live
Sensitivity live
| Price | -10% $82 | -5% $10 | +0% $-62 | +5% $-135 | +10% $-207 |
|---|---|---|---|---|---|
| Rent | -10% $-233 | -5% $-148 | +0% $-62 | +5% $23 | +10% $108 |
| Rate | -1.0pp $66 | -0.5pp $3 | base $-62 | +0.5pp $-128 | +1.0pp $-196 |
UW: 25.0% down · 7.5% · 30yr · 1.5% tax · 5.0% vac · 8.0% maint · 8.0% mgmt
Financing live
Cash to close
- Down payment
- $63,750
- Closing costs
- $7,650
- Reserves months
- —
- Total cash needed
- —
Loan-product check · same deal, 3 products live
Conventional
25% down · 7.5% · 30yr
- Down + closing
- —
- Monthly P&I
- —
- Monthly cashflow
- —
- DSCR
- —
- Eligible?
- —
Personal DTI + credit; lowest rate.
DSCR
20% down · 8.5% · 30yr
- Down + closing
- —
- Monthly P&I
- —
- Monthly cashflow
- —
- DSCR
- —
- Eligible?
- —
No personal income docs; deal must DSCR.
Hard money
10% down · 12.0% · 12mo
- Down + closing
- —
- Monthly P&I
- —
- Monthly cashflow
- —
- DSCR
- —
- Eligible?
- —
Short-term bridge; refi at stabilization.
Rent comps 4 comps
| Address | Beds | Baths | Sqft | Rent | $/sqft | DOM | Units | Dist |
|---|---|---|---|---|---|---|---|---|
| 7808 E 161st St S Bixby, OK | 1.0–3.0 | 1.5–2.5 | 1357 | $2,550 | $1.88 | 3d | 13 | 0.15mi |
| 16021 S 83rd East Ave Bixby, OK | 3.0 | 2.0 | 1517 | $1,650 | $1.09 | 3d | 1 | 0.28mi |
| 16423 S 86th East Ave Bixby, OK | 3.0 | 2.0 | 1546 | $1,750 | $1.13 | 16d | 1 | 0.38mi |
| 7532 E 158th St S Bixby, OK | 3.0 | 2.0 | 1486 | $1,600 | $1.08 | 3d | 1 | 0.55mi |
HOA detail
- Monthly dues
- $21 · $252/yr
Listing history 5 events
-
2026-04-02status Pending
-
2026-03-27$255,000 Active
-
2022-04-26soldstatus $236,200 Closed 221-char remark
Show marketing remark (221 chars)
NEW CONSTRUCTION!! Our newest plan. .. the Fenway! 3 bed 2 bath. This unique floorplan has a large living room, oversized breakfast nook. Won't last long. Under construction estimated completion March 2022. Bixby Schools.
-
2022-02-28historical 221-char remark
Show marketing remark (221 chars)
NEW CONSTRUCTION!! Our newest plan. .. the Fenway! 3 bed 2 bath. This unique floorplan has a large living room, oversized breakfast nook. Won't last long. Under construction estimated completion March 2022. Bixby Schools.
-
2022-02-28$236,200 221-char remark
Show marketing remark (221 chars)
NEW CONSTRUCTION!! Our newest plan. .. the Fenway! 3 bed 2 bath. This unique floorplan has a large living room, oversized breakfast nook. Won't last long. Under construction estimated completion March 2022. Bixby Schools.
ⓘ Source: listings_history table (triggers on properties + properties_extension) + one-shot
backfill from property_details.listing_events for pre-trigger history.
Tax reassessment forecast OK · Resets to sale price
- Current annual tax
- $3,639 · $303/mo
- Projected year-2 tax
- $3,639 · $303/mo
- Expected delta
- $0/yr ($0/mo · 0.0%)
ⓘ Screening estimate from a state-policy table — verify with the county assessor before closing.
Climate risk First Street
- Flood 4/10 Moderate FEMA zone X (shaded) · 22% chance over 30 yrs
- Wildfire 3/10 Moderate
- Heat 7/10 Severe 7 d/yr ≥111°F today · 18 d/yr by 30 yrs out
- Wind 3/10 Moderate 6% chance of damaging wind over 30 yrs
- Air quality 2/10 Low 0 unhealthy d/yr today · 1 by 30 yrs out
Nearby sold comps map
Loading sold comps map…
Walkable amenities ~0.75 mi
Loading nearby amenities…
Taxation est. · year 1
- Rental income
- $25,905
- − Mortgage interest
- −$14,284
- − Property taxes
- −$3,639
- − Insurance
- −$1,275
- − Repairs & maintenance
- −$2,072
- − Management
- −$2,072
- − HOA
- −$252
- − Depreciation
- −$7,418
- Taxable loss
- −$5,108
- Est. tax savings @ 24.0%
- +$1,226
- After-tax cash flow
- $478/yr
For passive investors: Depreciation is non-cash, so a rental often shows a tax loss while cash-flowing — sheltering income. Rental losses are passive: they offset passive income freely, and up to $25,000/yr can offset ordinary (W-2) income if you actively participate and your MAGI is under $100k (phasing out to $0 by $150k); unused losses carry forward. On sale, claimed depreciation is recaptured at up to 25%, and gains may owe capital-gains tax (a 1031 exchange can defer both). Figures are a year-1 estimate at your 24.0% rate — not tax advice; consult a CPA.
Condition & rehab AI · 13 photos
This single-family home in Bixby offers a good condition with modern amenities and a prime location. It is ready for a fresh coat of paint and some landscaping to enhance its curb appeal.
Value-add opportunities
- Resale paint exterior — enhances curb appeal
- Rental trim landscaping — improves curb appeal and enhances property value
Renovation cost estimate screening
Value-add ROI direction
- Resale paint exterior — enhances curb appeal ↑
- Rental trim landscaping — improves curb appeal and enhances property value ↑
ⓘ Cost ranges are severity-bucket heuristics (US national rule-of-thumb). Get contractor quotes + a written scope before underwriting a rehab budget.
Schools (NCES district)
- District
- Bixby
- NCES district ID
- 4004500
- Math proficiency
- 39% ▼ -13.00%
- Reading proficiency
- 36% ▼ -14.00%
- Median HH income
- $75,727
- Composite
- 34.9/100
- National rank
- #5081
- State rank
- #15 of 270 in OK
Livability — Bixby
- Score
- 72/100
- State rank
- #24
- US rank
- #6029
Category grades
Schools grade is shown separately in the Schools card above.
Census & demographics
- Census place
- Bixby, OK
- County
- Tulsa County · 640,811 people
- City population
- 34,006
- Metro
- Tulsa, OK
- Population (ZIP)
- 34,006
- Household income
- $104,000
- Rent vs Own
- Severe rent burden
- 525.0
Population outlook (Tulsa County) Hauer SSP2
- Today (2025)
- 723,846 people
- By 2030
- 766,033 · +5.8%
- By 2040
- 851,386 · +17.6%
- By 2050
- 938,389 · +29.6%
- By 2075
- 1,166,011 · +61.1%
- By 2100
- 1,350,277 · +86.5%
Race, ethnicity, and origin ACS 2023
- Neighborhood character
- Predominantly White (73%)
- Race & ethnicity
- White 73% Two or more races 15% Hispanic / Latino 9% Native American 5% Asian 2% Black 2%
- Hispanic origin (detail)
- Mexican 5%
- Common ancestry
- Italian 4% Slovak 2% Lithuanian 2%
- Foreign-born
- 5% · Canada
- Languages at home
- 92% English-only · Spanish 5% Other Indo-European 1%
Political lean MEDSL · Tulsa
- 2024 margin
- R (+15.2) · D 41.3% · R 56.5% · Other 2.2%
- 2008→2024 swing
- +9.2pp toward D · 2008: -24.5pp · 2024: -15.2pp
- All cycles
- 2024: R+15.2 2020: R+15.6 2016: R+22.9 2012: R+27.4 2008: R+24.5
Not yet ingested
- Civics
- —
Market trends
- HPI YoY
- ▼ -127.20%
- Current HPI
- 195.2538
- Rent YoY
- ▲ 3.34%
- Metro
- Tulsa, OK
- State GDP YoY
- ▲ 1.55%
- F500 in state
- 6
Industry mix (Fortune 500 HQ in OK)
| Industry | F500 HQs | Revenue |
|---|---|---|
| Energy | 3 | $48B |
|
||
Price history
+8.0% since first listed5 events — show timeline
- 2026-04-02 Pending — MLS Technology, Inc.
- 2026-03-27 Listed $255,000 MLS Technology, Inc.
- 2022-04-26 Sold (MLS) $236,200 MLS Technology, Inc.
- 2022-02-28 Listing Removed — MLS Technology, Inc.
- 2022-02-28 Listed $236,200 MLS Technology, Inc.
Property tax history
+684.3%/yrLatest (2023): $3,639 · +684.3% YoY. Source: county tax records.
Cash-flow waterfall
monthlySold comps — $/sqft
last 12 mo · ≤1 miLoading sold comps…