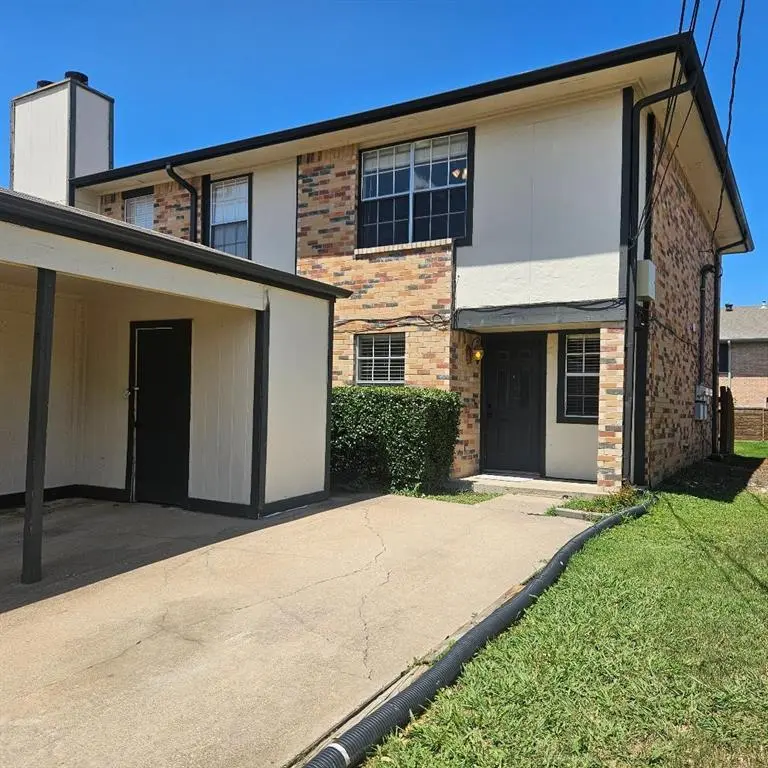
 Fourplex
12 Trails Pl Unit A-D · Wylie, TX
Flood risk 1/10 · Minimal
- FEMA flood zone
- X (unshaded)
- Chance of flooding over 30 yrs
- 0.0%
- Est. flood insurance / yr
- $507 – $1,088
Fire risk 2/10 · Minimal
- Est. fire insurance / yr
- $1,222 – $2,270
Heat risk 7/10 · Major
- Hot days now (above 109°F)
- 7 days/yr
- Hot days in 30 yrs
- 23 days/yr
Wind risk 6/10 · Moderate
- Chance of severe wind over 30 yrs
- 27.0%
Air-quality risk 3/10 · Minor
- Unhealthy air days now
- 2 days/yr
- Unhealthy air days in 30 yrs
- 3 days/yr
Risk factors via First Street. Map © Google.
Why this score? — see what drove the B- grade
The composite is a weighted blend of 9 inputs, each scored 0–100. Each bar is that input's sub-score; the figure is the points it added to the 100-point composite (weight × sub-score).
- Cash flow +26.5/30.0
- DSCR +9.0/10.0
- ARV discount +7.5/15.0
- 1% rule +7.1/10.0
- Schools +5.7/10.0
- Condition / age +3.8/5.0
- Livability +3.5/5.0
- Rent growth +2.2/5.0
- Appreciation +0.0/10.0
$650,000
🖨 Deal sheet 📄 Offer letter ✓ Due diligence
Multi-family units
County records classify this as Multi-Family (2-4 Unit). Listing-text estimate: 4 units. confirmed
Listing remarks
MULTIPLE OFFERS RECEIVED!: Final and best offers due by Friday May 1, 2026 at 6:PM. 100% Occupied Well Maintained 4 unit Apartment Condo building in a community of like buildings. Two 3 bedroom 2.1 bath units and two 2 bedroom 1.1 bath units. Each unit has an individual carport with two parking spaces and a storage unit except Unit D which has one Carport parking space. Additional parking available in community. Each unit has a private, fenced patio with porch and gate. Each unit is individually metered for water and electricity. Multiple updates and improvements have been made in all units including flooring, faucets, hardware, lighting fixtures, ceiling fands and other like features. This
Key facts
- Multiple updates
- Private fenced patio
- Well maintained
Tags
Property features AI
Finance
- Other: Tenancy restrictions: no smoking, no sublease; pets allowed with restrictions and written application required; Survey available
- Financial info: Property used as residential income with 4 units; 100% occupancy; Gross annual income reported at $74,000; Gross annual expenses reported at $34,616; Insurance expense reported at $8,400; Net operating income reported at $21,684; Operating expenses include insurance, maintenance, grounds maintenance, pest control, and professional management; Capitalization rate reported at 3.34
- HOA & community: No association; Community features include sidewalks
Exterior
- Parking: 4 covered/carport spaces; Detached carport; Additional assigned parking and parking lot on site; Driveway and concrete surfaces
- Security: Smoke detectors
- Utilities: City water; City sewer; Individual water meter; Cable available; Underground utilities; Curbs
- Home design: Residential income apartment building; Two levels; Trails Place complex, located in Trailsplace Add subdivision
- Construction: Built in 1986; Brick and siding exterior; Composition roof; Slab foundation
- Exterior features: Covered porches and patios (front and rear); Gutters; Private entrance; Private yard; Storage; Gate and wood fencing; Subdivision landscaping; Sidewalks; Community mailbox
Interior
- Kitchen: Dishwasher; Disposal; Electric range; Microwave; Refrigerator; Pantry
- Bedrooms: 10 bedrooms
- Flooring: Carpet; Ceramic tile; Laminate; Luxury vinyl plank
- Bathrooms: 6 full bathrooms; 4 half bathrooms
- Heating & cooling: Central heating; Electric heating; Fireplace heating; Central air; Electric cooling; Ceiling fans
- Interior features: Built-in features; Cable TV available; Decorative lighting; High-speed internet available; Pantry; Window coverings
- Laundry & utility: Electric water heater
Neighborhood map
What this means for you Summary
Snapshot
- This is a 4 × 2-bed/2.0-bath units multifamily listed at $650k. Condition is rated good.
Deal economics
- At list price, monthly cash flow is $2k ($21k/yr) — positive. Per door: $429/mo.
- The deal already cash-flows at list — no discount required.
- Meets the 1% rule at list price ($8k rent vs $650k).
- Recommended offer: $640k (1.5% below list) — sets the bar for market timing.
- Cap rate 9.5% vs local median 4.0% in Wylie — top-decile yield for the area; either an underpriced asset or a hidden risk that comps aren't pricing in. Stress-test before assuming the spread holds.
Location & tenants
- Location reads 69/100 on livability (#419 in TX) — a middle-class / working-renter tenant base. Strengths: crime A+, employment A+, housing A+; Watch: amenities F, commute F, health & safety F.
- Wylie ISD (suburban): math 64% / reading 63% proficiency, ranked #28 of 826 in TX (top 3%) — acceptable for families but not a draw, mixed tenant base, ~2y average lease.
- Zoned schools: P M Akin El (math 52% / reading 62%, grade C+, #505 of 4,322 statewide, top 13%, 586 students, 30% FRL) — zoned schools at 30% FRL track the district average.
- Market conditions: Rents soft (-1.4%/yr); 700 active listings in the ZIP; high-income renter base; 19,194 units permitted in Collin County in 2024 (3,988 in 5+ unit buildings).
- At $7,860/mo this rent would consume 77% of the median local household income ($122k/yr) (locally 996% of renters already pay >50% of income on rent) — very limited rent-growth headroom before tenants either downsize or default.
Forward outlook
- Local home prices are declining (-3.0%/yr); year-one equity from $4k of loan paydown is wiped out by about $20k of value loss. Plan a longer hold.
- Collin County population projected at +60% by 2050 — long-run rental-demand tailwind backs the buy-and-hold thesis.
Negotiation context
- It's been on market 16 days — a 2% lower offer ($640k) is reasonable based on typical stale-listing flexibility.
Risks & watch-outs
- Climate carrying-cost: major wind risk, 27% chance of damaging wind over 30y; extreme-heat days projected 7→23/yr by 2055 (HVAC capex compounding) — expect insurance premiums to compound above CPI over the hold.
Questions for the listing agent
- Can we see the unit-by-unit rent roll, current vacancy, and any below-market leases? What's the average tenancy length?
- What capital expenditures (roof, boiler, parking lot, exteriors) have been made in the last 5 years, and what's planned in the next 2?
- Is there a deadline driving the sale (1031 exchange, divorce, estate, relocation)? That informs how much negotiation room exists.
- Schools are B-rated — typically a magnet for longer-tenancy family renters. What's the average tenant stay here, and is there a school-zone premium baked into asking?
- What's the average days-on-market for RENTAL listings here right now (not sales)? A rising rental-DOM trend means longer vacancies and softer asking-rent achievability than the comps imply.
- What's the recent tenant-quality profile in this submarket — average credit score on applications, eviction rate, late-payment / NSF rate, and stable-employment percentage? A property-management company in the area should have these aggregated.
- How much new apartment / multifamily construction is in the pipeline within 1–3 miles? Heavy new supply (>2% of stock underway) typically softens rents 12–24 months out; light construction supports rent growth.
Investment metrics
- 1% rule
- 1.21% ✓
- Cap rate
- 9.46%
- Cash-on-cash
- 11.32%
- DSCR
- 1.50
- GRM
- 6.9
CMA / ARV
No comps found within radius.
Projected returns pro-forma
-3.0% appreciation · 0.0% rent growth · sell at horizon
- IRR
- -2.8%
- Equity multiple
- 0.90×
- Total profit
- $-18,862
- Equity at exit
- $96,917
- IRR
- 3.2%
- Equity multiple
- 1.20×
- Total profit
- $35,884
- Equity at exit
- $56,200
Cash invested: $182,000 (down + closing). Projections, not guarantees.
Landlord ↔ Tenant lean methodology
- Overall (STATE)
- 87 Strongly Landlord-Friendly
- State Texas
- 87 Strongly Landlord-Friendly · R+5
- County
- — inherits STATE
- City
- — inherits STATE
ZIP-level market 75098
- Home prices YoY
- -24.5%
- Rents YoY
- -1.4%
- Active inventory
- 700
- Price-to-rent
- 27.6×
Monthly cashflow live
- Estimated rent
- $7,860 medium interval (Pro) →
- Mortgage (P&I)
- −$3,409
- Tax est. 1.5%
- −$812 /mo · $9,750/yr
- Insurance
- −$271
- HOA
- −$0
- Vacancy / Maint / Mgmt
- −$1,651
- Net cashflow
- $1,717
Break-even live
4-unit breakdown (identical units grouped — click to expand)
| Units | Beds | Baths | Est. rent |
|---|---|---|---|
| 4× units | 2 | 2 | $7,860 |
| #1 | 2 | 2 | $1,965 |
| #2 | 2 | 2 | $1,965 |
| #3 | 2 | 2 | $1,965 |
| #4 | 2 | 2 | $1,965 |
| Total (4 units) | $7,860 | ||
UW: 25.0% down · 7.5% · 30yr · 1.5% tax · 5.0% vac · 8.0% maint · 8.0% mgmt
Financing live
Cash to close
- Down payment
- $162,500
- Closing costs
- $19,500
- Reserves months
- —
- Total cash needed
- —
Loan-product check · same deal, 3 products live
Conventional
25% down · 7.5% · 30yr
- Down + closing
- —
- Monthly P&I
- —
- Monthly cashflow
- —
- DSCR
- —
- Eligible?
- —
Personal DTI + credit; lowest rate.
DSCR
20% down · 8.5% · 30yr
- Down + closing
- —
- Monthly P&I
- —
- Monthly cashflow
- —
- DSCR
- —
- Eligible?
- —
No personal income docs; deal must DSCR.
Hard money
10% down · 12.0% · 12mo
- Down + closing
- —
- Monthly P&I
- —
- Monthly cashflow
- —
- DSCR
- —
- Eligible?
- —
Short-term bridge; refi at stabilization.
Listing history 3 events
-
2026-05-13status Pending
-
2026-05-03historical Active Option Contract
-
2026-04-26$650,000 Active
ⓘ Source: listings_history table (triggers on properties + properties_extension) + one-shot
backfill from property_details.listing_events for pre-trigger history.
Climate risk First Street
- Flood 1/10 Low FEMA zone X (unshaded) · 0% chance over 30 yrs
- Wildfire 2/10 Low
- Heat 7/10 Severe 7 d/yr ≥109°F today · 23 d/yr by 30 yrs out
- Wind 6/10 Major 27% chance of damaging wind over 30 yrs
- Air quality 3/10 Moderate 2 unhealthy d/yr today · 3 by 30 yrs out
Nearby sold comps map
Loading sold comps map…
Walkable amenities ~0.75 mi
Loading nearby amenities…
Taxation est. · year 1
- Rental income
- $94,320
- − Mortgage interest
- −$36,410
- − Property taxes
- −$9,750
- − Insurance
- −$3,250
- − Repairs & maintenance
- −$7,546
- − Management
- −$7,546
- − Depreciation
- −$18,909
- Taxable income
- $10,910
- Est. tax owed @ 24.0%
- −$2,618
- After-tax cash flow
- $17,990/yr
For passive investors: Depreciation is non-cash, so a rental often shows a tax loss while cash-flowing — sheltering income. Rental losses are passive: they offset passive income freely, and up to $25,000/yr can offset ordinary (W-2) income if you actively participate and your MAGI is under $100k (phasing out to $0 by $150k); unused losses carry forward. On sale, claimed depreciation is recaptured at up to 25%, and gains may owe capital-gains tax (a 1031 exchange can defer both). Figures are a year-1 estimate at your 24.0% rate — not tax advice; consult a CPA.
Condition & rehab AI · 14 photos
The property is in good condition with recent updates and improvements. It is move-in ready and has a good curb appeal.
Value-add opportunities
- Both Painting the exterior and interior walls — Painting can enhance the curb appeal and interior aesthetics, making the property more attractive to potential buyers and renters.
- Both Updating the flooring — Updating the flooring can improve the overall look and feel of the property, making it more appealing to potential buyers and renters.
- Both Upgrading the kitchen appliances — Upgrading the kitchen appliances can make the property more attractive to potential buyers and renters, as it can add value to the property.
Renovation cost estimate screening
Value-add ROI direction
- Both Painting the exterior and interior walls — Painting can enhance the curb appeal and interior aesthetics, making the property more attractive to potential buyers and renters. ↑
- Both Updating the flooring — Updating the flooring can improve the overall look and feel of the property, making it more appealing to potential buyers and renters. ↑
- Both Upgrading the kitchen appliances — Upgrading the kitchen appliances can make the property more attractive to potential buyers and renters, as it can add value to the property. ↑
ⓘ Cost ranges are severity-bucket heuristics (US national rule-of-thumb). Get contractor quotes + a written scope before underwriting a rehab budget.
Schools (NCES district)
- District
- Wylie ISD
- NCES district ID
- 4846530
- Math proficiency
- 64% ▼ -9.00%
- Reading proficiency
- 63% ▼ -3.00%
- Median HH income
- $84,145
- Composite
- 57.25/100
- National rank
- #1091
- State rank
- #28 of 826 in TX
Livability — Wylie
- Score
- 69/100
- State rank
- #419
- US rank
- #8623
Category grades
Schools grade is shown separately in the Schools card above.
Census & demographics
- Census place
- Wylie, TX
- County
- Collin County · 1,159,394 people
- City population
- 69,325
- Metro
- Dallas-Fort Worth-Arlington, TX
- Population (ZIP)
- 69,325
- Household income
- $122,089
- Rent vs Own
- Severe rent burden
- 996.0
Population outlook (Collin County) Hauer SSP2
- Today (2025)
- 1,210,074 people
- By 2030
- 1,358,201 · +12.2%
- By 2040
- 1,654,061 · +36.7%
- By 2050
- 1,937,359 · +60.1%
- By 2075
- 2,567,039 · +112.1%
- By 2100
- 2,952,048 · +144.0%
Race, ethnicity, and origin ACS 2023
- Neighborhood character
- Diverse neighborhood (Simpson 0.67)
- Race & ethnicity
- White 51% Hispanic / Latino 19% Two or more races 15% Black 13% Asian 11%
- Hispanic origin (detail)
- Mexican 12%
- Common ancestry
- Slovak 2% Lithuanian 2% Serbian 2%
- Foreign-born
- 21% · Canada, Vietnam, China
- Languages at home
- 70% English-only · Spanish 14% Other Indo-European 4% Vietnamese 2%
Political lean MEDSL · Collin
- 2024 margin
- R (+11.1) · D 43.1% · R 54.3% · Other 2.6%
- 2008→2024 swing
- +14.4pp toward D · 2008: -25.6pp · 2024: -11.1pp
- All cycles
- 2024: R+11.1 2020: R+4.3 2016: R+17.0 2012: R+31.6 2008: R+25.6
Not yet ingested
- Civics
- —
Market trends
- HPI YoY
- ▼ -84.91%
- Current HPI
- 261.9973
- Rent YoY
- ▼ -1.39%
- Metro
- Dallas-Fort Worth-Arlington, TX
- State GDP YoY
- ▲ 3.95%
- F500 in state
- 110
Industry mix (Fortune 500 HQ in TX)
| Industry | F500 HQs | Revenue |
|---|---|---|
| Energy | 16 | $1,198B |
|
||
| Technology | 5 | $198B |
|
||
| Engineering / Construction | 4 | $72B |
|
||
| Energy Services | 3 | $60B |
|
||
| Utilities | 3 | $41B |
|
||
| Healthcare | 2 | $330B |
|
||
Price history
3 events — show timeline
- 2026-05-13 Pending — NTREIS
- 2026-05-03 Contingent — NTREIS
- 2026-04-26 Listed $650,000 NTREIS
Cash-flow waterfall
monthlySold comps — $/sqft
last 12 mo · ≤1 miLoading sold comps…