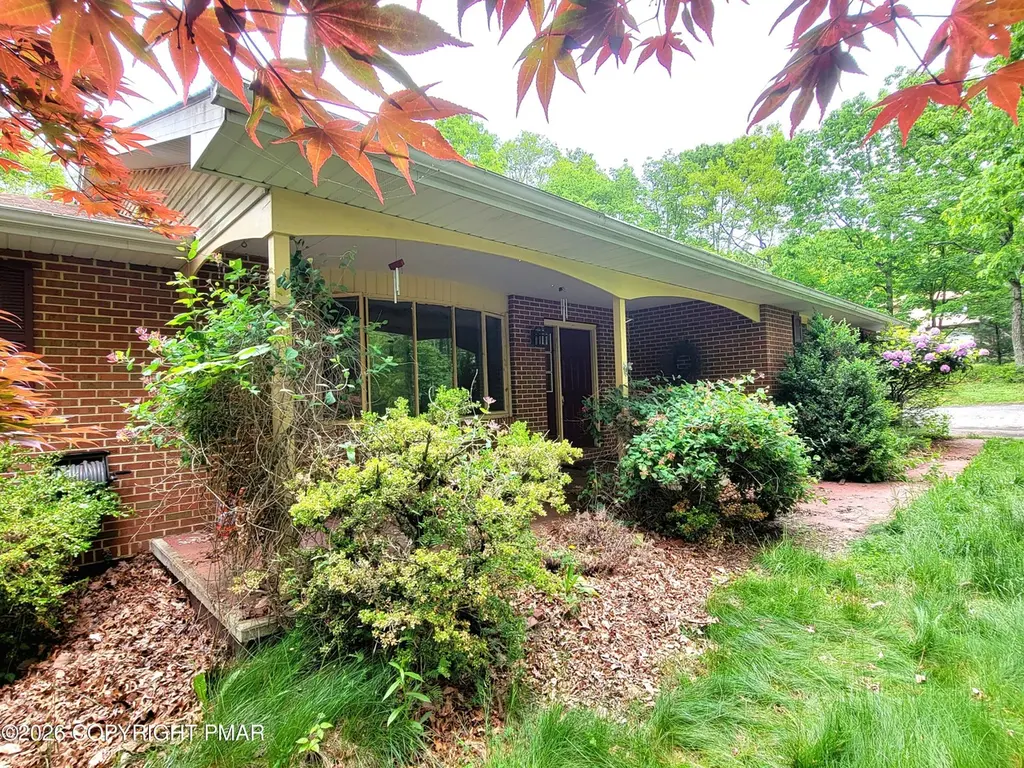
150 Twin Oak Ter · Penn Estates, PA
Flood risk 1/10 · Minimal
- FEMA flood zone
- X (unshaded)
- Chance of flooding over 30 yrs
- 0.0%
- Est. flood insurance / yr
- $473 – $860
Fire risk 4/10 · Minor
- Est. fire insurance / yr
- $511 – $949
Heat risk 2/10 · Minimal
- Hot days now (above 95°F)
- 6 days/yr
- Hot days in 30 yrs
- 13 days/yr
Wind risk 4/10 · Minor
- Chance of severe wind over 30 yrs
- 11.0%
Air-quality risk 2/10 · Minimal
- Unhealthy air days now
- 1 days/yr
- Unhealthy air days in 30 yrs
- 2 days/yr
Risk factors via First Street. Map © Google.
Why this score? — see what drove the D+ grade
The composite is a weighted blend of 9 inputs, each scored 0–100. Each bar is that input's sub-score; the figure is the points it added to the 100-point composite (weight × sub-score).
- ARV discount +15.0/15.0
- Cash flow +10.7/30.0
- Appreciation +5.0/10.0
- Schools +4.0/10.0
- 1% rule +3.6/10.0
- Livability +3.4/5.0
- DSCR +3.1/10.0
- Rent growth +2.5/5.0
- Condition / age +2.5/5.0
$275,000
🖨 Deal sheet (PDF) 📄 Offer letter ✓ Due diligence
Listing remarks MLS
LOCATION! LOCATION! LOCATION! Minutes from Crossing and Stroudsburg. 3 bed, 2 bath ranch with 2 CARS GARAGE, FULL BASEMENT on ACRE of land in GREAT AREA. PERFECT location for COMMUTERS. Close to Rt 80, shopping, Mt. Airy Casino, minutes away from water parks: Kalahari Resort, Camelbeach, Aquatopia, Camelback Skiing resort, state parks, water sports, hiking, fishing, hunting and some much more. This is an estate sale, sold as is.
Key facts
- Acre of land
- Close to rt 80
- Full basement
Tags
Property features AI
Finance
- Other: Lot size: 1.0 acre; Above-grade finished area reported
Exterior
- Parking: Attached garage; 2-car garage; Driveway
- Utilities: Well water; Septic tank
- Home design: One-story house; Brick and vinyl siding exterior; Asphalt/fiberglass roof
- Construction: Built with brick and vinyl siding
- Exterior features: Deck; Patio; Shed; Additional shed(s)
Interior
- Kitchen: No specific appliances listed
- Bedrooms: Total rooms: 7
- Bathrooms: 1 full bathroom
- Heating & cooling: Electric heating; Ceiling fans
- Interior features: Dining area; Separate/formal dining room; Full basement with sump pump
- Laundry & utility: Washer hookup; Dryer hookup; Water heater (other)
Neighborhood map
What this means for you Summary
Snapshot
- This is a 3-bed/2.0-bath single-family listed at $275k.
Deal economics
- At list price, monthly cash flow is $-130 ($-2k/yr) — negative.
- To cash-flow at today's rent, offer at most $252k (8.4% below list).
- To meet the 1% rule (rent ≥ 1% of price), the offer needs to be $238k (13.5% below list).
- Recommended offer: $238k (13.5% below list) — sets the bar for 1% rule.
- Cap rate 5.7% vs local median 4.0% in Penn Estates — top-decile yield for the area; either an underpriced asset or a hidden risk that comps aren't pricing in. Stress-test before assuming the spread holds.
Location & tenants
- Location reads 68/100 on livability (#915 in PA) — a middle-class / working-renter tenant base. Strengths: employment A+, cost of living A+, housing A+; Watch: health & safety D, schools D-, amenities F.
- Pocono Mountain SD (rural): math 37% / reading 55% proficiency, ranked #245 of 539 in PA (top 46%) — families likely to look elsewhere, expect single-tenant / working-renter base with shorter leases.
- Market conditions: 94 active listings in the ZIP; 278 units permitted in Monroe County in 2024 (52 in 5+ unit buildings).
Forward outlook
- In year one you build about $2k of equity ($2k loan paydown + $-47 appreciation (-0.0% local appreciation)).
- Monroe County population projected at -11% by 2050 — secular population decline; favor cash flow + early exit over multi-decade hold.
Negotiation context
- Only 11 days on market — expect competitive offers; lowballing is unlikely to land.
- 2 sale attempts with the ask held roughly flat each time — persistent listings suggest the price (not the market) is what's stuck; bring a comps-based counter.
- Current owner paid $148k; list at $275k implies a 85% gain — meaningful room to come down on a strong offer.
Questions for the listing agent
- What do current leases actually rent for vs. the listed asking? Can we see a recent rent roll and the last 12 months of T-12 income?
- Is there a deadline driving the sale (1031 exchange, divorce, estate, relocation)? That informs how much negotiation room exists.
- Schools are D-rated, which usually means shorter tenancies and higher turnover. Who's the typical renter profile here, and what's been the actual vacancy rate?
- The area grade is low — what's the realistic commute time and amenity access for the typical tenant pool here? Any planned neighborhood developments (good or bad) we should know about?
- What's the average days-on-market for RENTAL listings here right now (not sales)? A rising rental-DOM trend means longer vacancies and softer asking-rent achievability than the comps imply.
- What's the recent tenant-quality profile in this submarket — average credit score on applications, eviction rate, late-payment / NSF rate, and stable-employment percentage? A property-management company in the area should have these aggregated.
- How much new for-sale + rental construction is in the pipeline within 1–3 miles? Heavy new supply typically softens prices + rents 12–24 months out; constrained supply supports both.
Investment metrics
- 1% rule
- 0.86% ✗
- Cap rate
- 5.73%
- Cash-on-cash
- -2.03%
- DSCR
- 0.91
- GRM
- 9.6
CMA / ARV
- ARV (on-the-fly)
- $358,560
- Comps found
- 3
Show comp detail 3 sales within ~0.75 mi
| Address | Dist | Beds/Ba | Sqft | Sold | Price | $/sf | Match |
|---|---|---|---|---|---|---|---|
| 143 Twin Oak Ter | 0.08mi | 3/1.5 | 1,888 (+14%) | 20mo | $210,000 | $111 | 55 |
| 3099 Route 715 | 0.55mi | 3/2.0 | 1,456 (-12%) | 1mo | $320,000 | $220 | 53 |
| 1108 Sylvan Ln | 0.62mi | 3/2.0 | 1,586 (-4%) | 21mo | $343,000 | $216 | 47 |
Match score weights: distance 35% · size 25% · config 20% · recency 20%. Top-matched comps best support the ARV.
Projected returns pro-forma
-0.02% appreciation · 3.0% rent growth · sell at horizon
- IRR
- -4.6%
- Equity multiple
- 0.79×
- Total profit
- $-16,444
- Equity at exit
- $79,615
- IRR
- 1.4%
- Equity multiple
- 1.15×
- Total profit
- $11,262
- Equity at exit
- $95,513
Cash invested: $77,000 (down + closing). Projections, not guarantees.
Landlord ↔ Tenant lean methodology
- Overall (STATE)
- 62 Landlord-Friendly
- State Pennsylvania
- 62 Landlord-Friendly · EVEN
- County
- — inherits STATE
- City
- — inherits STATE
ZIP-level market 18372
- Home prices YoY
- -0.0%
- Active inventory
- 94
- Price-to-rent
- 9.6×
Monthly cashflow live
- Estimated rent
- $2,379 medium interval (Pro) →
- Mortgage (P&I)
- −$1,442
- Tax from tax record
- −$452 /mo · $5,429/yr
- Insurance
- −$115
- HOA
- −$0
- Vacancy / Maint / Mgmt
- −$500
- Net cashflow
- $-130
Break-even live
Sensitivity live
| Price | -10% $26 | -5% $-52 | +0% $-130 | +5% $-208 | +10% $-286 |
|---|---|---|---|---|---|
| Rent | -10% $-318 | -5% $-224 | +0% $-130 | +5% $-36 | +10% $58 |
| Rate | -1.0pp $8 | -0.5pp $-60 | base $-130 | +0.5pp $-201 | +1.0pp $-274 |
UW: 25.0% down · 7.5% · 30yr · 1.5% tax · 5.0% vac · 8.0% maint · 8.0% mgmt
Financing live
Cash to close
- Down payment
- $68,750
- Closing costs
- $8,250
- Reserves months
- —
- Total cash needed
- —
Loan-product check · same deal, 3 products live
Conventional
25% down · 7.5% · 30yr
- Down + closing
- —
- Monthly P&I
- —
- Monthly cashflow
- —
- DSCR
- —
- Eligible?
- —
Personal DTI + credit; lowest rate.
DSCR
20% down · 8.5% · 30yr
- Down + closing
- —
- Monthly P&I
- —
- Monthly cashflow
- —
- DSCR
- —
- Eligible?
- —
No personal income docs; deal must DSCR.
Hard money
10% down · 12.0% · 12mo
- Down + closing
- —
- Monthly P&I
- —
- Monthly cashflow
- —
- DSCR
- —
- Eligible?
- —
Short-term bridge; refi at stabilization.
Listing history 11 events
-
2026-06-10status $275,000 Pending 11 DOM
-
2026-06-09days on market $275,000 Active 11 DOM
-
2026-06-08days on market $275,000 Active 10 DOM
-
2026-06-07days on market $275,000 Active 9 DOM
-
2026-06-02days on market $275,000 Active 4 DOM
-
2026-06-01days on market $275,000 Active 3 DOM
-
2026-05-31days on market $275,000 Active 2 DOM
-
2026-05-29$275,000 Active 432-char remark
Show marketing remark (432 chars)
LOCATION! LOCATION! LOCATION! Minutes from Crossing and Stroudsburg. 3 bed, 2 bath ranch with 2 CARS GARAGE, FULL BASEMENT on ACRE of land in GREAT AREA. PERFECT location for COMMUTERS. Close to Rt 80, shopping, Mt. Airy Casino, minutes away from water parks: Kalahari Resort, Camelbeach, Aquatopia, Camelback Skiing resort, state parks, water sports, hiking, fishing, hunting and some much more. This is an estate sale, sold as is.
-
2026-05-28$275,000 Active
-
2003-12-29soldstatus $148,400
-
1980-11-14soldstatus $15,000
ⓘ Source: listings_history table (triggers on properties + properties_extension) + one-shot
backfill from property_details.listing_events for pre-trigger history.
Tax reassessment forecast PA · Partial reset (capped growth)
- Current annual tax
- $5,429 · $452/mo
- Projected year-2 tax
- $5,429 · $452/mo
- Expected delta
- $0/yr ($0/mo · 0.0%)
ⓘ Screening estimate from a state-policy table — verify with the county assessor before closing.
Climate risk First Street
- Flood 1/10 Low FEMA zone X (unshaded) · 0% chance over 30 yrs
- Wildfire 4/10 Moderate
- Heat 2/10 Low 6 d/yr ≥95°F today · 13 d/yr by 30 yrs out
- Wind 4/10 Moderate 11% chance of damaging wind over 30 yrs
- Air quality 2/10 Low 1 unhealthy d/yr today · 2 by 30 yrs out
Nearby sold comps map
Loading sold comps map…
Walkable amenities ~0.75 mi
Loading nearby amenities…
Taxation est. · year 1
- Rental income
- $28,544
- − Mortgage interest
- −$15,404
- − Property taxes
- −$5,429
- − Insurance
- −$1,375
- − Repairs & maintenance
- −$2,283
- − Management
- −$2,283
- − Depreciation
- −$8,000
- Taxable loss
- −$6,232
- Est. tax savings @ 24.0%
- +$1,496
- After-tax cash flow
- $-64/yr
For passive investors: Depreciation is non-cash, so a rental often shows a tax loss while cash-flowing — sheltering income. Rental losses are passive: they offset passive income freely, and up to $25,000/yr can offset ordinary (W-2) income if you actively participate and your MAGI is under $100k (phasing out to $0 by $150k); unused losses carry forward. On sale, claimed depreciation is recaptured at up to 25%, and gains may owe capital-gains tax (a 1031 exchange can defer both). Figures are a year-1 estimate at your 24.0% rate — not tax advice; consult a CPA.
Schools (NCES district)
- District
- Pocono Mountain SD
- NCES district ID
- 4219500
- Math proficiency
- 37% ▼ -5.00%
- Reading proficiency
- 55% ▲ 1.00%
- Median HH income
- $55,317
- Composite
- 39.91/100
- National rank
- #3856
- State rank
- #245 of 539 in PA
Livability — Penn Estates
- Score
- 68/100
- State rank
- #915
- US rank
- #9917
Category grades
Schools grade is shown separately in the Schools card above.
Census & demographics
- Population (ZIP)
- 3,397
Population outlook (Monroe County) Hauer SSP2
- Today (2025)
- 164,099 people
- By 2030
- 161,412 · -1.6%
- By 2040
- 154,616 · -5.8%
- By 2050
- 146,710 · -10.6%
- By 2075
- 140,830 · -14.2%
- By 2100
- 138,472 · -15.6%
Race, ethnicity, and origin ACS 2023
- Neighborhood character
- Diverse neighborhood (Simpson 0.61)
- Race & ethnicity
- White 60% Black 11% Hispanic / Latino 10% Two or more races 8% Asian 5%
- Hispanic origin (detail)
- Puerto Rican 9%
- Common ancestry
- Romanian 7% Russian 3% Slovak 2%
- Foreign-born
- 9% · Canada
- Languages at home
- 78% English-only · Other Indo-European 12% Chinese 7% Spanish 3%
Political lean MEDSL · Monroe
- 2024 margin
- Toss-up / Even · D 49.1% · R 49.9%
- 2008→2024 swing
- -17.1pp toward R · 2008: 16.3pp · 2024: -0.8pp
- All cycles
- 2024: R+0.8 2020: D+6.4 2016: D+0.3 2012: D+14.0 2008: D+16.3
Not yet ingested
- Civics
- —
Market trends
- HPI YoY
- ▬ -0.02%
- Current HPI
- 147.7957
- Rent YoY
- —
- Metro
- —
- State GDP YoY
- ▲ 1.68%
- F500 in state
- 34
Industry mix (Fortune 500 HQ in PA)
| Industry | F500 HQs | Revenue |
|---|---|---|
| Healthcare | 2 | $309B |
|
||
| Insurance | 2 | $27B |
|
||
| Telecommunications / Media | 1 | $124B |
|
||
| Industrial Distribution | 1 | $22B |
|
||
| Financial Services | 1 | $20B |
|
||
| Chemicals / Materials | 1 | $18B |
|
||
Price history
+1733.3% since first listed4 events — show timeline
- 2026-05-29 Listed $275,000 PMAR
- 2026-05-28 Listed $275,000 GLVRMLS
- 2003-12-29 Sold (Public Records) $148,400 Public Records
- 1980-11-14 Sold (Public Records) $15,000 Public Records
Property tax history
+1.4%/yrLatest (2026): $5,429 · +2.1% YoY. Source: county tax records.
Cash-flow waterfall
monthlySold comps — $/sqft
last 12 mo · ≤1 miLoading sold comps…