 Multi-family
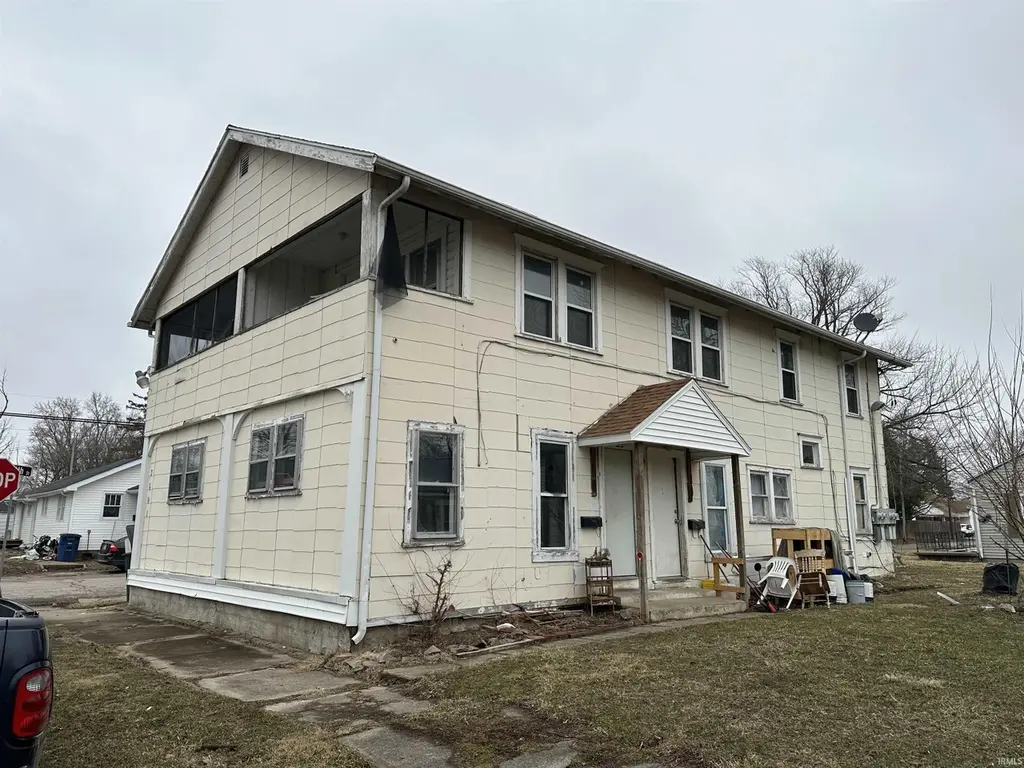
3601 S Boots St · Marion, IN
Flood risk 5/10 · Moderate
- FEMA flood zone
- X (unshaded)
- Chance of flooding over 30 yrs
- 0.54%
- Est. flood insurance / yr
- $507 – $1,088
Fire risk 1/10 · Minimal
- Est. fire insurance / yr
- $717 – $1,331
Heat risk 3/10 · Minor
- Hot days now (above 100°F)
- 7 days/yr
- Hot days in 30 yrs
- 18 days/yr
Wind risk 2/10 · Minimal
- Chance of severe wind over 30 yrs
- —
Air-quality risk 2/10 · Minimal
- Unhealthy air days now
- 1 days/yr
- Unhealthy air days in 30 yrs
- 2 days/yr
Risk factors via First Street. Map © Google.
Why this score? — see what drove the D+ grade
The composite is a weighted blend of 9 inputs, each scored 0–100. Each bar is that input's sub-score; the figure is the points it added to the 100-point composite (weight × sub-score).
- Cash flow +15.0/30.0
- ARV discount +14.3/15.0
- 1% rule +5.0/10.0
- DSCR +5.0/10.0
- Livability +3.2/5.0
- Rent growth +2.5/5.0
- Condition / age +2.5/5.0
- Schools +1.7/10.0
- Appreciation +0.0/10.0
$61,999
🖨 Deal sheet (PDF) 📄 Offer letter ✓ Due diligence
Multi-family units
County records classify this as Multi-Family (2-4 Unit). Listing-text estimate: 1 unit. estimate disagrees with records
Listing remarks MLS
Discover a rare investment gem at 3601 S Boots St, Marion, IN 46953! This charming, early-20th-century multifamily property spans approximately 2,396?sq?ft and features four income-producing units—perfectly configured for savvy investors. With strong rental income potential, this property delivers solid cash flow and long-term equity growth. Set on a corner lot in a vibrant Marion neighborhood, the building offers a mix of 5 bedrooms and 4 baths, ample parking. Whether you're expanding your portfolio or entering the rental market, this property offers immediate income, historic charm, and a strategic location. Don’t miss your chance to own a piece of Marion’s thriving real estate scene!
Key facts
- Multifamily property
- Historic charm
- Strategic location
Tags
Neighborhood map
What this means for you Summary
Snapshot
- This is a 5-bed/4.0-bath multifamily listed at $62k.
Deal economics
- At list price, monthly cash flow is $3k ($39k/yr) — positive.
- The deal already cash-flows at list — no discount required.
- Meets the 1% rule at list price ($5k rent vs $62k).
- Recommended offer: $58k (6.0% below list) — sets the bar for market timing.
- Cap rate 69.5% vs local median 8.1% in Marion — top-decile yield for the area; either an underpriced asset or a hidden risk that comps aren't pricing in. Stress-test before assuming the spread holds.
Location & tenants
- Location reads 65/100 on livability (#337 in IN) — a middle-class / working-renter tenant base. Strengths: crime A+, cost of living A+, housing A+; Watch: amenities F, commute F, employment F.
- Marion Community Schools (town): math 18% / reading 24% proficiency, ranked #277 of 301 in IN (top 92%) — low school quality limits family demand, transient renter base, plan for 1-2y turnover; 67% free/reduced lunch — lower-income household profile, screen leases tightly.
- Zoned schools: Frances Slocum Elem School (math 12% / reading 12%, grade F, #893 of 994 statewide, top 91%, 472 students, 81% FRL); John L Mcculloch Junior High Sch (math 11% / reading 22%, grade F, #287 of 330 statewide, top 88%, 524 students, 74% FRL); Marion High School (math 12% / reading 47%, grade F, #308 of 369 statewide, top 84%, 1,050 students, 66% FRL).
- Market conditions: 114 active listings in the ZIP; 52 units permitted in Grant County in 2024 (8 in 5+ unit buildings).
- At $4,677/mo this rent would consume 121% of the median local household income ($46k/yr) (locally 597% of renters already pay >50% of income on rent) — very limited rent-growth headroom before tenants either downsize or default.
Forward outlook
- Local home prices are declining (-3.0%/yr); year-one equity from $428 of loan paydown is wiped out by about $2k of value loss. Plan a longer hold.
- Grant County population projected at -18% by 2050 — secular population decline; favor cash flow + early exit over multi-decade hold.
- At projected returns (-3.0% appreciation + 3.0% rent growth), your $17k cash investment doubles in ~1 year — after that, you're playing with house money.
Negotiation context
- It's been on market 81 days — a 6% lower offer ($58k) is reasonable based on typical stale-listing flexibility.
Risks & watch-outs
- Watch-outs: built in 1900 — expect roof / HVAC / electrical / plumbing capex.
- Climate carrying-cost: moderate flood risk — expect insurance premiums to compound above CPI over the hold.
Questions for the listing agent
- It's been on market 81 days. Have you received any prior offers? Is the seller open to a 6% concession, seller financing, or rate buy-down credit?
- Built in 1900 — when were the roof, HVAC, electrical panel, plumbing, and water heater last replaced?
- Why hasn't it sold? Are there any deal-killer items the seller is aware of (foundation, flood, title, zoning, code violations)?
- Is there a deadline driving the sale (1031 exchange, divorce, estate, relocation)? That informs how much negotiation room exists.
- Schools are F-rated, which usually means shorter tenancies and higher turnover. Who's the typical renter profile here, and what's been the actual vacancy rate?
- The area grade is low — what's the realistic commute time and amenity access for the typical tenant pool here? Any planned neighborhood developments (good or bad) we should know about?
- What's the average days-on-market for RENTAL listings here right now (not sales)? A rising rental-DOM trend means longer vacancies and softer asking-rent achievability than the comps imply.
- What's the recent tenant-quality profile in this submarket — average credit score on applications, eviction rate, late-payment / NSF rate, and stable-employment percentage? A property-management company in the area should have these aggregated.
- How much new apartment / multifamily construction is in the pipeline within 1–3 miles? Heavy new supply (>2% of stock underway) typically softens rents 12–24 months out; light construction supports rent growth.
Investment metrics
- 1% rule
- 7.54% ✓
- Cap rate
- 69.54%
- Cash-on-cash
- 225.87%
- DSCR
- 11.05
- GRM
- 1.1
CMA / ARV
- ARV (median comp)
- $73,067
- List price
- $61,999
- Delta
- -15.15%
- Verdict
- UNDERPRICED
- Comps
- 6 within 1.0 mi
Show comp detail 1 sale within ~0.75 mi
| Address | Dist | Beds/Ba | Sqft | Sold | Price | $/sf | Match |
|---|---|---|---|---|---|---|---|
| 3702 S Boots St | 0.13mi | 4/3.0 (-1) | 2,400 (+0%) | 12mo | $60,000 | $25 | 75 |
Match score weights: distance 35% · size 25% · config 20% · recency 20%. Top-matched comps best support the ARV.
Projected returns pro-forma
-3.0% appreciation · 3.0% rent growth · sell at horizon
- IRR
- —
- Equity multiple
- 12.41×
- Total profit
- $198,134
- Equity at exit
- $9,244
- IRR
- —
- Equity multiple
- 26.39×
- Total profit
- $440,792
- Equity at exit
- $5,361
Cash invested: $17,360 (down + closing). Projections, not guarantees.
Landlord ↔ Tenant lean methodology
- Overall (STATE)
- 90 Strongly Landlord-Friendly
- State Indiana
- 90 Strongly Landlord-Friendly · R+11
- County
- — inherits STATE
- City
- — inherits STATE
ZIP-level market 46953
- Home prices YoY
- -23.4%
- Active inventory
- 114
- Price-to-rent
- 4.4×
Monthly cashflow live
- Estimated rent
- $4,677 medium interval (Pro) →
- Mortgage (P&I)
- −$325
- Tax from tax record
- −$76 /mo · $916/yr
- Insurance
- −$26
- HOA
- −$0
- Lot rent
- −$0
- Vacancy / Maint / Mgmt
- −$982
- Net cashflow
- $3,268
Break-even live
Sensitivity live
| Price | -10% $3,303 | -5% $3,285 | +0% $3,268 | +5% $3,250 | +10% $3,232 |
|---|---|---|---|---|---|
| Rent | -10% $2,898 | -5% $3,083 | +0% $3,268 | +5% $3,452 | +10% $3,637 |
| Rate | -1.0pp $3,299 | -0.5pp $3,283 | base $3,268 | +0.5pp $3,251 | +1.0pp $3,235 |
4-unit breakdown (identical units grouped — click to expand)
| Units | Beds | Baths | Est. rent |
|---|---|---|---|
| 4× units | 5 | 4 | $4,676 |
| #1 | 5 | 4 | $1,169 |
| #2 | 5 | 4 | $1,169 |
| #3 | 5 | 4 | $1,169 |
| #4 | 5 | 4 | $1,169 |
| Total (4 units) | $4,677 | ||
UW: 25.0% down · 7.5% · 30yr · 1.5% tax · 5.0% vac · 8.0% maint · 8.0% mgmt
Financing live
Cash to close
- Down payment
- $15,500
- Closing costs
- $1,860
- Reserves months
- —
- Total cash needed
- —
Loan-product check · same deal, 3 products live
Conventional
25% down · 7.5% · 30yr
- Down + closing
- —
- Monthly P&I
- —
- Monthly cashflow
- —
- DSCR
- —
- Eligible?
- —
Personal DTI + credit; lowest rate.
DSCR
20% down · 8.5% · 30yr
- Down + closing
- —
- Monthly P&I
- —
- Monthly cashflow
- —
- DSCR
- —
- Eligible?
- —
No personal income docs; deal must DSCR.
Hard money
10% down · 12.0% · 12mo
- Down + closing
- —
- Monthly P&I
- —
- Monthly cashflow
- —
- DSCR
- —
- Eligible?
- —
Short-term bridge; refi at stabilization.
Listing history 10 events
-
2026-06-09statusdays on market $61,999 Pending 81 DOM
-
2026-06-08days on market $61,999 Active 80 DOM
-
2026-06-07days on market $61,999 Active 79 DOM
-
2026-06-02days on market $61,999 Active 74 DOM
-
2026-06-01days on market $61,999 Active 73 DOM
-
2026-05-31days on market $61,999 Active 72 DOM
-
2026-05-30days on market $61,999 Active 71 DOM
-
2026-05-06price $61,999 713-char remark
Show marketing remark (713 chars)
Discover a rare investment gem at 3601 S Boots St, Marion, IN 46953! This charming, early-20th-century multifamily property spans approximately 2,396?sq?ft and features four income-producing units—perfectly configured for savvy investors. With strong rental income potential, this property delivers solid cash flow and long-term equity growth. Set on a corner lot in a vibrant Marion neighborhood, the building offers a mix of 5 bedrooms and 4 baths, ample parking. Whether you're expanding your portfolio or entering the rental market, this property offers immediate income, historic charm, and a strategic location. Don’t miss your chance to own a piece of Marion’s thriving real estate scene!
-
2026-04-14price $64,999 713-char remark
Show marketing remark (713 chars)
Discover a rare investment gem at 3601 S Boots St, Marion, IN 46953! This charming, early-20th-century multifamily property spans approximately 2,396?sq?ft and features four income-producing units—perfectly configured for savvy investors. With strong rental income potential, this property delivers solid cash flow and long-term equity growth. Set on a corner lot in a vibrant Marion neighborhood, the building offers a mix of 5 bedrooms and 4 baths, ample parking. Whether you're expanding your portfolio or entering the rental market, this property offers immediate income, historic charm, and a strategic location. Don’t miss your chance to own a piece of Marion’s thriving real estate scene!
-
2026-03-19$75,000 Active 713-char remark
Show marketing remark (713 chars)
Discover a rare investment gem at 3601 S Boots St, Marion, IN 46953! This charming, early-20th-century multifamily property spans approximately 2,396?sq?ft and features four income-producing units—perfectly configured for savvy investors. With strong rental income potential, this property delivers solid cash flow and long-term equity growth. Set on a corner lot in a vibrant Marion neighborhood, the building offers a mix of 5 bedrooms and 4 baths, ample parking. Whether you're expanding your portfolio or entering the rental market, this property offers immediate income, historic charm, and a strategic location. Don’t miss your chance to own a piece of Marion’s thriving real estate scene!
ⓘ Source: listings_history table (triggers on properties + properties_extension) + one-shot
backfill from property_details.listing_events for pre-trigger history.
Tax reassessment forecast IN · Partial reset (capped growth)
- Current annual tax
- $916 · $76/mo
- Projected year-2 tax
- $916 · $76/mo
- Expected delta
- $0/yr ($0/mo · 0.0%)
ⓘ Screening estimate from a state-policy table — verify with the county assessor before closing.
Climate risk First Street
- Flood 5/10 Major FEMA zone X (unshaded) · 54% chance over 30 yrs
- Wildfire 1/10 Low
- Heat 3/10 Moderate 7 d/yr ≥100°F today · 18 d/yr by 30 yrs out
- Wind 2/10 Low
- Air quality 2/10 Low 1 unhealthy d/yr today · 2 by 30 yrs out
Nearby sold comps map
Loading sold comps map…
Walkable amenities ~0.75 mi
Loading nearby amenities…
Taxation est. · year 1
- Rental income
- $56,124
- − Mortgage interest
- −$3,473
- − Property taxes
- −$916
- − Insurance
- −$310
- − Repairs & maintenance
- −$4,490
- − Management
- −$4,490
- − Depreciation
- −$1,804
- Taxable income
- $40,642
- Est. tax owed @ 24.0%
- −$9,754
- After-tax cash flow
- $29,456/yr
For passive investors: Depreciation is non-cash, so a rental often shows a tax loss while cash-flowing — sheltering income. Rental losses are passive: they offset passive income freely, and up to $25,000/yr can offset ordinary (W-2) income if you actively participate and your MAGI is under $100k (phasing out to $0 by $150k); unused losses carry forward. On sale, claimed depreciation is recaptured at up to 25%, and gains may owe capital-gains tax (a 1031 exchange can defer both). Figures are a year-1 estimate at your 24.0% rate — not tax advice; consult a CPA.
Schools (NCES district)
- District
- Marion Community Schools
- NCES district ID
- 1806390
- Math proficiency
- 18% ▼ -9.00%
- Reading proficiency
- 24% ▼ -6.00%
- Median HH income
- $33,415
- Composite
- 17.13/100
- National rank
- #9115
- State rank
- #277 of 301 in IN
Livability — Marion
- Score
- 65/100
- State rank
- #337
- US rank
- #13006
Category grades
Schools grade is shown separately in the Schools card above.
Census & demographics
- Census place
- Marion, IN
- County
- Grant County · 41,561 people
- City population
- 41,561
- Metro
- Marion, IN
- Population (ZIP)
- 23,372
- Household income
- $46,288
- Rent vs Own
- Severe rent burden
- 597.0
Population outlook (Grant County) Hauer SSP2
- Today (2025)
- 64,394 people
- By 2030
- 62,145 · -3.5%
- By 2040
- 57,252 · -11.1%
- By 2050
- 52,968 · -17.7%
- By 2075
- 45,986 · -28.6%
- By 2100
- 39,400 · -38.8%
Race, ethnicity, and origin ACS 2023
- Neighborhood character
- Predominantly White (77%)
- Race & ethnicity
- White 77% Black 10% Two or more races 9% Hispanic / Latino 6%
- Hispanic origin (detail)
- Mexican 4%
- Common ancestry
- Italian 3% Iranian 1% Slovak 1%
- Foreign-born
- 2% · Canada
- Languages at home
- 96% English-only · Spanish 3%
Political lean MEDSL · Grant
- 2024 margin
- Solid R (+41.8) · D 28.2% · R 70.0% · Other 1.9%
- 2008→2024 swing
- -28.7pp toward R · 2008: -13.1pp · 2024: -41.8pp
- All cycles
- 2024: R+41.8 2020: R+38.8 2016: R+39.5 2012: R+22.0 2008: R+13.1
Not yet ingested
- Civics
- —
Market trends
- HPI YoY
- ▼ -52.47%
- Current HPI
- 171.7246
- Rent YoY
- —
- Metro
- Marion, IN
- State GDP YoY
- ▲ 2.90%
- F500 in state
- 18
Industry mix (Fortune 500 HQ in IN)
| Industry | F500 HQs | Revenue |
|---|---|---|
| Industrial Machinery | 2 | $37B |
|
||
| Healthcare | 1 | $177B |
|
||
| Pharmaceuticals | 1 | $45B |
|
||
| Metals / Steel | 1 | $18B |
|
||
| Agriculture | 1 | $17B |
|
||
| Packaging | 1 | $12B |
|
||
Price history
-17.3% since first listed3 events — show timeline
- 2026-05-06 Price Changed $61,999 IRMLS
- 2026-04-14 Price Changed $64,999 IRMLS
- 2026-03-19 Listed $75,000 IRMLS
Property tax history
-2.3%/yrLatest (2025): $916 · -22.8% YoY. Source: county tax records.
Cash-flow waterfall
monthlySold comps — $/sqft
last 12 mo · ≤1 miLoading sold comps…