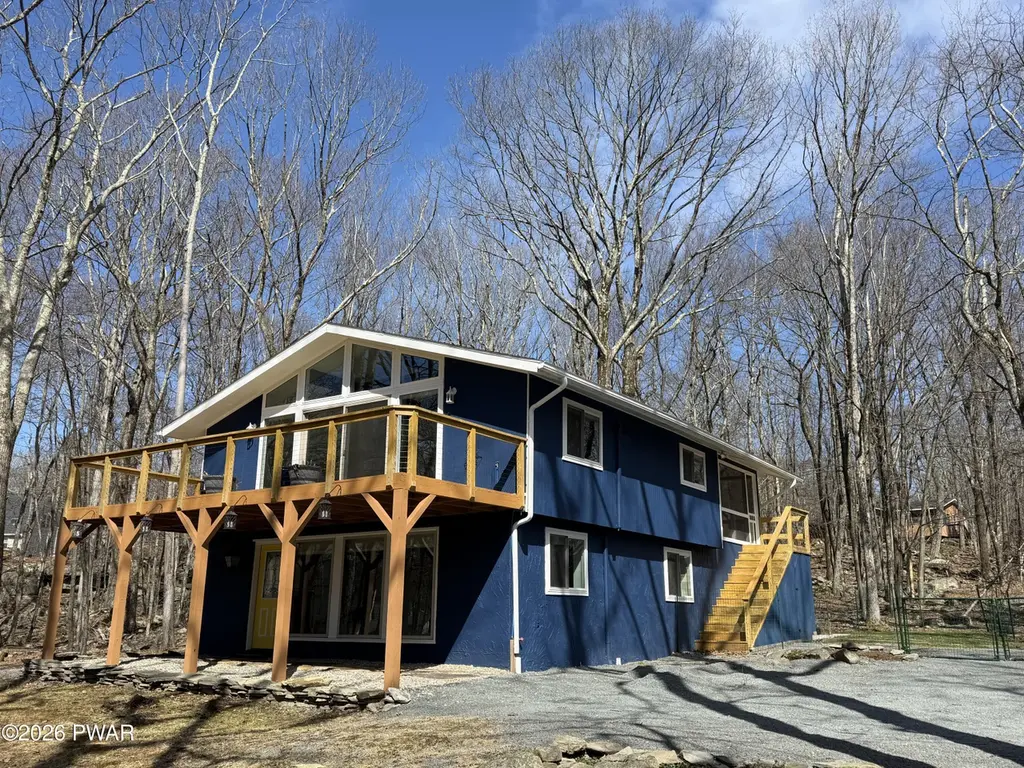
107 Village Ln · Hemlock Farms, PA
Flood risk 1/10 · Minimal
- FEMA flood zone
- X (unshaded)
- Chance of flooding over 30 yrs
- 0.0%
- Est. flood insurance / yr
- $473 – $860
Fire risk 4/10 · Minor
- Est. fire insurance / yr
- $511 – $949
Heat risk 2/10 · Minimal
- Hot days now (above 91°F)
- 7 days/yr
- Hot days in 30 yrs
- 15 days/yr
Wind risk 3/10 · Minor
- Chance of severe wind over 30 yrs
- 6.0%
Air-quality risk 2/10 · Minimal
- Unhealthy air days now
- 1 days/yr
- Unhealthy air days in 30 yrs
- 2 days/yr
Risk factors via First Street. Map © Google.
Why this score? — see what drove the B grade
The composite is a weighted blend of 9 inputs, each scored 0–100. Each bar is that input's sub-score; the figure is the points it added to the 100-point composite (weight × sub-score).
- Cash flow +26.3/30.0
- Appreciation +10.0/10.0
- DSCR +9.0/10.0
- ARV discount +8.5/15.0
- 1% rule +7.3/10.0
- Schools +4.2/10.0
- Livability +3.4/5.0
- Rent growth +2.5/5.0
- Condition / age +2.5/5.0
$310,000
🖨 Deal sheet 📄 Offer letter ✓ Due diligence
Listing remarks MLS
Move into this beautiful renovated country home in the desirable community of Hemlock Farms. Blending a central location and peaceful seclusion, directly accross the from a greenbelt area that leads to a trail that is beautifully maintained by the Hemlock Farms Conservancy. 3 Bedrooms, 2 bathrooms, Familyroom and open layout with white kitchen featuring stainless steel appliances and granite counters. Hardwood floors add warmth. Enjoy the outdoors with a fabulous screened porch or large deck.
Key facts
- Central location
- Greenbelt area
- White kitchen
Tags
Neighborhood map
What this means for you Summary
Snapshot
- This is a 3-bed/2.0-bath single-family listed at $310k.
Deal economics
- At list price, monthly cash flow is $805 ($10k/yr) — positive.
- The deal already cash-flows at list — no discount required.
- Meets the 1% rule at list price ($4k rent vs $310k).
- Recommended offer: $291k (6.0% below list) — sets the bar for market timing.
- Cap rate 9.4% vs local median 7.1% in Hemlock Farms — top-decile yield for the area; either an underpriced asset or a hidden risk that comps aren't pricing in. Stress-test before assuming the spread holds.
Location & tenants
- Location reads 68/100 on livability (#884 in PA) — a middle-class / working-renter tenant base. Strengths: crime A+, housing A+, health & safety A+; Watch: schools C-, amenities F, commute F.
- Wallenpaupack Area SD (rural): math 39% / reading 59% proficiency, ranked #192 of 539 in PA (top 36%) — families likely to look elsewhere, expect single-tenant / working-renter base with shorter leases.
- Market conditions: 371 active listings in the ZIP; 6 comparable units currently listed for rent nearby; rentals leasing fast (median 1d on market — plan ~1-2 weeks tenant-placement turnaround); 213 units permitted in Pike County in 2024 (0 in 5+ unit buildings).
Forward outlook
- In year one you build about $33k of equity ($2k loan paydown + $31k appreciation (10.0% local appreciation)).
- Pike County population projected at -25% by 2050 — secular population decline; favor cash flow + early exit over multi-decade hold.
- At projected returns (10.0% appreciation + 3.0% rent growth), your $87k cash investment doubles in ~2 years — after that, you're playing with house money.
- By year 2, paydown + projected appreciation supports a ~$53k cash-out refi (75% LTV) — recoverable capital for the next deal without selling this one.
Negotiation context
- It's been on market 87 days — a 6% lower offer ($291k) is reasonable based on typical stale-listing flexibility.
- 6 sale attempts since 8y ago with the ask held roughly flat each time — persistent listings suggest the price (not the market) is what's stuck; bring a comps-based counter.
- Current owner paid $265k; 17% above their basis — modest negotiation headroom, anchor on the comps not their cost.
Questions for the listing agent
- It's been on market 87 days. Have you received any prior offers? Is the seller open to a 6% concession, seller financing, or rate buy-down credit?
- Built in 1969 — when were the roof, HVAC, electrical panel, plumbing, and water heater last replaced?
- What does the HOA fee cover, when was the last increase, and are there any pending special assessments or reserve-fund shortfalls?
- Why hasn't it sold? Are there any deal-killer items the seller is aware of (foundation, flood, title, zoning, code violations)?
- Is there a deadline driving the sale (1031 exchange, divorce, estate, relocation)? That informs how much negotiation room exists.
- What's the average days-on-market for RENTAL listings here right now (not sales)? A rising rental-DOM trend means longer vacancies and softer asking-rent achievability than the comps imply.
- What's the recent tenant-quality profile in this submarket — average credit score on applications, eviction rate, late-payment / NSF rate, and stable-employment percentage? A property-management company in the area should have these aggregated.
- How much new for-sale + rental construction is in the pipeline within 1–3 miles? Heavy new supply typically softens prices + rents 12–24 months out; constrained supply supports both.
Investment metrics
- 1% rule
- 1.23% ✓
- Cap rate
- 9.41%
- Cash-on-cash
- 11.13%
- DSCR
- 1.50
- GRM
- 6.8
CMA / ARV
- ARV (median comp)
- $316,846
- List price
- $310,000
- Delta
- -2.16%
- Verdict
- FAIR
- Comps
- 20 within 1.0 mi
Show comp detail 12 sales within ~0.75 mi
| Address | Dist | Beds/Ba | Sqft | Sold | Price | $/sf | Match |
|---|---|---|---|---|---|---|---|
| 119 Ridgeway Dr | 0.17mi | 3/2.5 | 1,662 (+3%) | 1mo | $549,000 | $330 | 84 |
| 118 Ledgeway Ln | 0.08mi | 3/2.5 | 1,716 (+6%) | 8mo | $399,999 | $233 | 77 |
| 105 Longridge Dr | 0.47mi | 3/2.0 | 1,692 (+5%) | 3mo | $340,000 | $201 | 68 |
| 802 Rimrock Ct Unit 802 Rimrock Lane, Hawley, PA 18428 | 0.35mi | 4/2.5 (+1) | 1,728 (+7%) | 1mo | $345,000 | $200 | 64 |
| 101 Ridgeway Dr | 0.31mi | 3/2.0 | 1,420 (-12%) | 6mo | $292,500 | $206 | 61 |
| 801 Saddlebrook Spur Spur | 0.54mi | 3/2.0 | 1,728 (+7%) | 4mo | $550,500 | $319 | 59 |
| 121 Saddlebrook Ln | 0.67mi | 3/2.0 | 1,648 (+2%) | 8mo | $315,000 | $191 | 58 |
| 109 Bluestone Dr | 0.60mi | 3/2.0 | 1,500 (-7%) | 3mo | $255,000 | $170 | 58 |
| 128 Saddlebrook Ln | 0.69mi | 3/2.0 | 1,539 (-4%) | 5mo | $385,000 | $250 | 56 |
| 809 Boulder Ct | 0.74mi | 3/2.0 | 1,536 (-5%) | 3mo | $620,000 | $404 | 55 |
| 106 Fetlock Dr | 0.56mi | 3/3.0 | 1,700 (+6%) | 7mo | $255,000 | $150 | 55 |
| 803 Fetlock Ct | 0.56mi | 3/2.0 | 1,837 (+14%) | 7mo | $290,000 | $158 | 44 |
Match score weights: distance 35% · size 25% · config 20% · recency 20%. Top-matched comps best support the ARV.
Projected returns pro-forma
10.0% appreciation · 3.0% rent growth · sell at horizon
- IRR
- 32.4%
- Equity multiple
- 3.54×
- Total profit
- $220,214
- Equity at exit
- $279,273
- IRR
- 28.0%
- Equity multiple
- 8.01×
- Total profit
- $608,370
- Equity at exit
- $602,262
Cash invested: $86,800 (down + closing). Projections, not guarantees.
Landlord ↔ Tenant lean methodology
- Overall (STATE)
- 62 Landlord-Friendly
- State Pennsylvania
- 62 Landlord-Friendly · EVEN
- County
- — inherits STATE
- City
- — inherits STATE
ZIP-level market 18428
- Home prices YoY
- 9.2%
- Active inventory
- 371
- Price-to-rent
- 6.8×
Monthly cashflow live
- Estimated rent
- $3,820 high interval (Pro) →
- Mortgage (P&I)
- −$1,626
- Tax from tax record
- −$208 /mo · $2,496/yr
- Insurance
- −$129
- HOA
- −$250
- Vacancy / Maint / Mgmt
- −$802
- Net cashflow
- $805
Break-even live
UW: 25.0% down · 7.5% · 30yr · 1.5% tax · 5.0% vac · 8.0% maint · 8.0% mgmt
Financing live
Cash to close
- Down payment
- $77,500
- Closing costs
- $9,300
- Reserves months
- —
- Total cash needed
- —
Loan-product check · same deal, 3 products live
Conventional
25% down · 7.5% · 30yr
- Down + closing
- —
- Monthly P&I
- —
- Monthly cashflow
- —
- DSCR
- —
- Eligible?
- —
Personal DTI + credit; lowest rate.
DSCR
20% down · 8.5% · 30yr
- Down + closing
- —
- Monthly P&I
- —
- Monthly cashflow
- —
- DSCR
- —
- Eligible?
- —
No personal income docs; deal must DSCR.
Hard money
10% down · 12.0% · 12mo
- Down + closing
- —
- Monthly P&I
- —
- Monthly cashflow
- —
- DSCR
- —
- Eligible?
- —
Short-term bridge; refi at stabilization.
Rent comps 6 comps
| Address | Beds | Baths | Sqft | Rent | $/sqft | DOM | Units | Dist |
|---|---|---|---|---|---|---|---|---|
| 101 Pommel Dr Hawley, PA | 3.0 | 2.0 | 1691 | $4,400 | $2.60 | 1d | 1 | 0.60mi |
| 106 Corral Ln Hawley, PA | 3.0 | 2.0 | 2150 | $4,000 | $1.86 | 3d | 1 | 0.84mi |
| 811 Hickory Ct Hawley, PA | 3.0 | 2.0 | 1100 | $2,500 | $2.27 | 1d | 1 | 1.00mi |
| 313 Forest Dr Blooming Grove, PA | 3.0 | 2.0 | 1200 | $5,000 | $4.17 | 1d | 1 | 1.00mi |
| 131 Surrey Dr Hawley, PA | 4.0 | 2.0 | 1952 | $2,650 | $1.36 | 43d | 1 | 1.11mi |
| 402 Canoe Brook Dr Hawley, PA | 3.0 | 2.0 | 2055 | $3,500 | $1.70 | 1d | 1 | 1.31mi |
HOA detail
- Monthly dues
- $250 · $3,000/yr
Listing history 24 events
-
2026-06-03statusdays on market $310,000 Pending 87 DOM
-
2026-06-02days on market $310,000 Active 86 DOM
-
2026-06-01days on market $310,000 Active 85 DOM
-
2026-05-31days on market $310,000 Active 84 DOM
-
2026-05-14price $310,000 498-char remark
Show marketing remark (498 chars)
Move into this beautiful renovated country home in the desirable community of Hemlock Farms. Blending a central location and peaceful seclusion, directly accross the from a greenbelt area that leads to a trail that is beautifully maintained by the Hemlock Farms Conservancy. 3 Bedrooms, 2 bathrooms, Familyroom and open layout with white kitchen featuring stainless steel appliances and granite counters. Hardwood floors add warmth. Enjoy the outdoors with a fabulous screened porch or large deck.
-
2026-02-27$318,000 Active 498-char remark
Show marketing remark (498 chars)
Move into this beautiful renovated country home in the desirable community of Hemlock Farms. Blending a central location and peaceful seclusion, directly accross the from a greenbelt area that leads to a trail that is beautifully maintained by the Hemlock Farms Conservancy. 3 Bedrooms, 2 bathrooms, Familyroom and open layout with white kitchen featuring stainless steel appliances and granite counters. Hardwood floors add warmth. Enjoy the outdoors with a fabulous screened porch or large deck.
-
2026-01-01historical
-
2025-11-14price $349,000
-
2025-11-14price $349,000
-
2025-10-29$369,000 Active
-
2025-10-27price $369,000
-
2025-10-17price $374,999
-
2025-10-04price $379,000
-
2025-08-29$387,000 Active
-
2021-08-26soldstatus $265,000
-
2021-08-23soldstatus $265,000
-
2021-08-23soldstatus
-
2021-06-13$265,000
-
2021-06-13$265,000
-
2020-08-20soldstatus $164,900
-
2019-03-15soldstatus $67,000
-
2019-03-12soldstatus $67,000
-
2018-08-24$85,900
-
1988-09-29soldstatus $115,000
ⓘ Source: listings_history table (triggers on properties + properties_extension) + one-shot
backfill from property_details.listing_events for pre-trigger history.
Tax reassessment forecast PA · Partial reset (capped growth)
- Current annual tax
- $2,496 · $208/mo
- Projected year-2 tax
- $3,697 · $308/mo
- Expected delta
- +$1,201/yr (+$100/mo · 48.1%)
ⓘ Screening estimate from a state-policy table — verify with the county assessor before closing.
Climate risk First Street
- Flood 1/10 Low FEMA zone X (unshaded) · 0% chance over 30 yrs
- Wildfire 4/10 Moderate
- Heat 2/10 Low 7 d/yr ≥91°F today · 15 d/yr by 30 yrs out
- Wind 3/10 Moderate 6% chance of damaging wind over 30 yrs
- Air quality 2/10 Low 1 unhealthy d/yr today · 2 by 30 yrs out
Nearby sold comps map
Loading sold comps map…
Walkable amenities ~0.75 mi
Loading nearby amenities…
Taxation est. · year 1
- Rental income
- $45,843
- − Mortgage interest
- −$17,365
- − Property taxes
- −$2,496
- − Insurance
- −$1,550
- − Repairs & maintenance
- −$3,667
- − Management
- −$3,667
- − HOA
- −$3,000
- − Depreciation
- −$9,018
- Taxable income
- $5,079
- Est. tax owed @ 24.0%
- −$1,219
- After-tax cash flow
- $8,443/yr
For passive investors: Depreciation is non-cash, so a rental often shows a tax loss while cash-flowing — sheltering income. Rental losses are passive: they offset passive income freely, and up to $25,000/yr can offset ordinary (W-2) income if you actively participate and your MAGI is under $100k (phasing out to $0 by $150k); unused losses carry forward. On sale, claimed depreciation is recaptured at up to 25%, and gains may owe capital-gains tax (a 1031 exchange can defer both). Figures are a year-1 estimate at your 24.0% rate — not tax advice; consult a CPA.
Schools (NCES district)
- District
- Wallenpaupack Area SD
- NCES district ID
- 4224750
- Math proficiency
- 39% ▼ -10.00%
- Reading proficiency
- 59% ▼ -5.00%
- Median HH income
- $51,027
- Composite
- 41.97/100
- National rank
- #3345
- State rank
- #192 of 539 in PA
Livability — Hemlock Farms
- Score
- 68/100
- State rank
- #884
- US rank
- #9421
Category grades
Schools grade is shown separately in the Schools card above.
Census & demographics
- Census place
- Hemlock Farms, PA
- Population (ZIP)
- 12,446
Population outlook (Pike County) Hauer SSP2
- Today (2025)
- 53,548 people
- By 2030
- 51,622 · -3.6%
- By 2040
- 46,490 · -13.2%
- By 2050
- 40,372 · -24.6%
- By 2075
- 31,951 · -40.3%
- By 2100
- 26,821 · -49.9%
Race, ethnicity, and origin ACS 2023
- Neighborhood character
- Predominantly White (85%)
- Race & ethnicity
- White 85% Hispanic / Latino 8% Two or more races 6% Black 1% Asian 1%
- Hispanic origin (detail)
- Puerto Rican 5%
- Common ancestry
- Romanian 5% Portuguese 3% Italian 2%
- Foreign-born
- 5% · Canada
- Languages at home
- 91% English-only · Spanish 5% Russian/Polish/Slavic 1% Other Asian/Pacific 1%
Political lean MEDSL · Pike
- 2024 margin
- Strong R (+24.1) · D 37.6% · R 61.6%
- 2008→2024 swing
- -19.8pp toward R · 2008: -4.2pp · 2024: -24.1pp
- All cycles
- 2024: R+24.1 2020: R+19.0 2016: R+26.0 2012: R+11.0 2008: R+4.2
Not yet ingested
- Civics
- —
Market trends
- HPI YoY
- ▲ 28.60%
- Current HPI
- 340.8254
- Rent YoY
- —
- Metro
- —
- State GDP YoY
- ▲ 1.68%
- F500 in state
- 34
Industry mix (Fortune 500 HQ in PA)
| Industry | F500 HQs | Revenue |
|---|---|---|
| Healthcare | 2 | $309B |
|
||
| Insurance | 2 | $27B |
|
||
| Telecommunications / Media | 1 | $124B |
|
||
| Industrial Distribution | 1 | $22B |
|
||
| Financial Services | 1 | $20B |
|
||
| Chemicals / Materials | 1 | $18B |
|
||
Price history
+169.6% since first listed20 events — show timeline
- 2026-05-14 Price Changed $310,000 PWMLS
- 2026-02-27 Listed $318,000 PWMLS
- 2026-01-01 Listing Removed — GLVRMLS
- 2025-11-14 Price Changed $349,000 GLVRMLS
- 2025-11-14 Price Changed $349,000 PWMLS
- 2025-10-29 Listed $369,000 GLVRMLS
- 2025-10-27 Price Changed $369,000 PWMLS
- 2025-10-17 Price Changed $374,999 PWMLS
- 2025-10-04 Price Changed $379,000 PWMLS
- 2025-08-29 Listed $387,000 PWMLS
- 2021-08-26 Sold (Public Records) $265,000 Public Records
- 2021-08-23 Sold (MLS) — PWMLS
- 2021-08-23 Sold (MLS) $265,000 PWMLS
- 2021-06-13 Listed $265,000 PWMLS
- 2021-06-13 Listed $265,000 PWMLS
- 2020-08-20 Sold (Public Records) $164,900 Public Records
- 2019-03-15 Sold (Public Records) $67,000 Public Records
- 2019-03-12 Sold (MLS) $67,000 PWMLS
- 2018-08-24 Listed $85,900 PWMLS
- 1988-09-29 Sold (Public Records) $115,000 Public Records
Property tax history
+2.8%/yrLatest (2026): $2,496 · +3.0% YoY. Source: county tax records.
Cash-flow waterfall
monthlySold comps — $/sqft
last 12 mo · ≤1 miLoading sold comps…