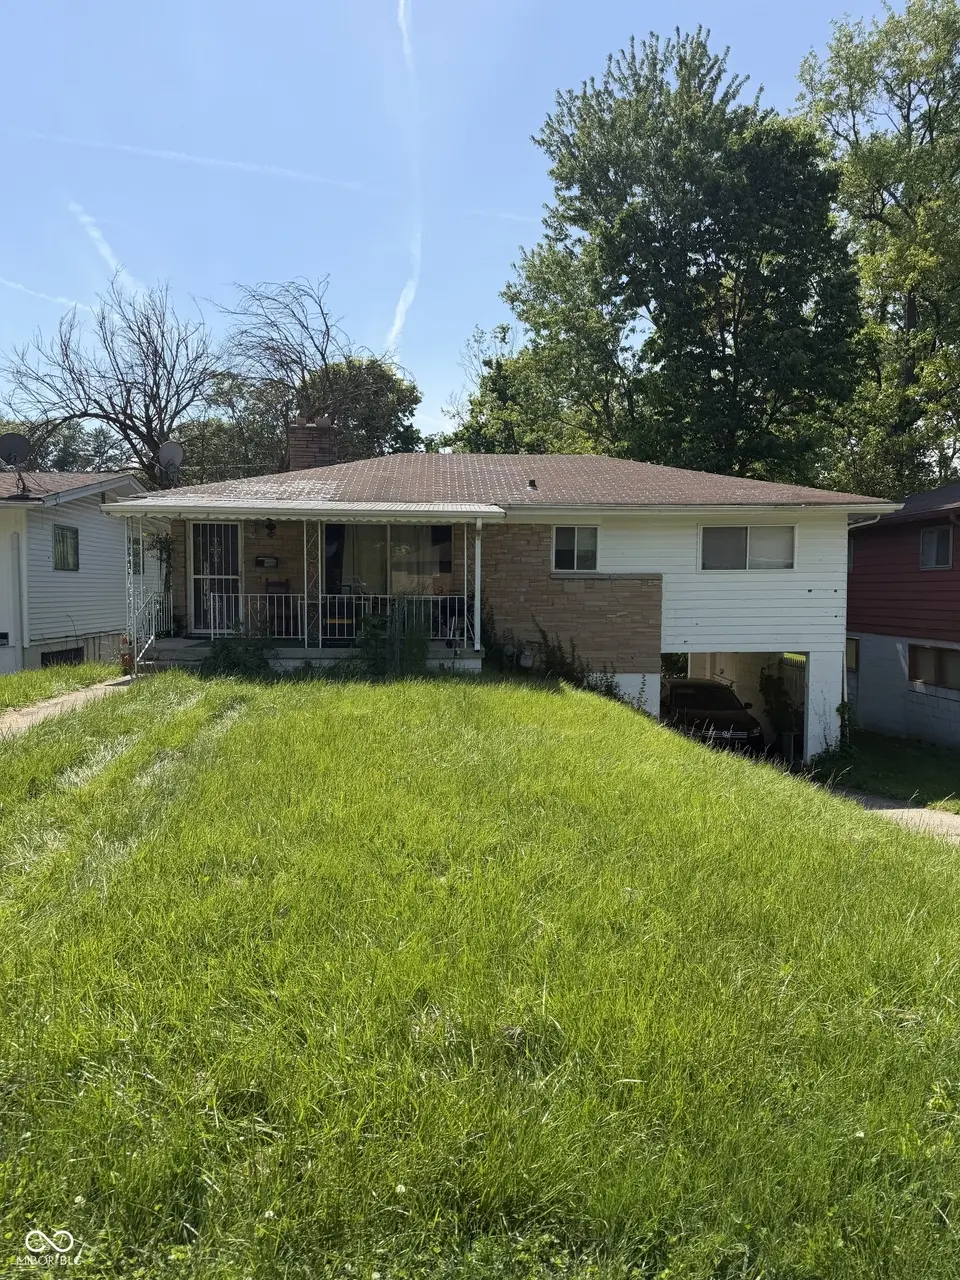
3540 Adams St · Indianapolis city (balance), IN
Flood risk 7/10 · Major
- FEMA flood zone
- X (unshaded)
- Chance of flooding over 30 yrs
- 0.78%
- Est. flood insurance / yr
- $473 – $860
Fire risk 1/10 · Minimal
- Est. fire insurance / yr
- $717 – $1,331
Heat risk 3/10 · Minor
- Hot days now (above 102°F)
- 7 days/yr
- Hot days in 30 yrs
- 18 days/yr
Wind risk 2/10 · Minimal
- Chance of severe wind over 30 yrs
- 1.0%
Air-quality risk 4/10 · Minor
- Unhealthy air days now
- 5 days/yr
- Unhealthy air days in 30 yrs
- 7 days/yr
Risk factors via First Street. Map © Google.
Why this score? — see what drove the B- grade
The composite is a weighted blend of 9 inputs, each scored 0–100. Each bar is that input's sub-score; the figure is the points it added to the 100-point composite (weight × sub-score).
- Cash flow +28.0/30.0
- ARV discount +12.8/15.0
- DSCR +9.9/10.0
- 1% rule +8.7/10.0
- Rent growth +2.7/5.0
- Livability +2.5/5.0
- Condition / age +2.5/5.0
- Schools +1.4/10.0
- Appreciation +0.0/10.0
$100,000
🖨 Deal sheet 📄 Offer letter ✓ Due diligence
Listing remarks MLS
Nicely rehabbed property with three beds and two baths. Three beds and one bath on the main level.Additional space in the finished, walk out, ground floor basement, could be a separate living quarters with great room as bedroom.
Key facts
- 9,148 sq ft lot
- Garage
- Built 1956
Property features AI
Exterior
- Parking: Attached garage (1 car); Carport
- Security: Smoke alarm
- Utilities: Public water; Municipal sewer connected; Solid waste service available; Gas water heater (natural gas)
- Home design: Single-family residence; One level (with finished lower/basement level); Residential property
- Construction: Brick construction; Block full foundation
- Exterior features: Covered patio; Mature trees on the lot
Interior
- Kitchen: Electric cooktop; Refrigerator
- Bedrooms: Three main-level bedrooms; One basement bedroom (bonus/lower-level bedroom)
- Flooring: Hardwood floors
- Bathrooms: One full bathroom on the main level; One half bath in the basement; Total: 1 full bath, 1 half bath
- Heating & cooling: Forced air heating (natural gas); Central air conditioning
- Interior features: Walk-in closets; Hardwood floors; In-law arrangement; Smoke alarm; Utility room; Daylight finished basement with finished walls and walk-out access; One fireplace in the family room
- Laundry & utility: Laundry in basement; Gas water heater
Neighborhood map
What this means for you Summary
Snapshot
- This is a 3-bed/1.5-bath single-family listed at $100k.
Deal economics
- At list price, monthly cash flow is $254 ($3k/yr) — positive.
- The deal already cash-flows at list — no discount required.
- Meets the 1% rule at list price ($1k rent vs $100k).
- Cap rate 10.0% vs local median 4.4% in Indianapolis city (balance) — top-decile yield for the area; either an underpriced asset or a hidden risk that comps aren't pricing in. Stress-test before assuming the spread holds.
Location & tenants
- Location reads: area grade B — affects rentability + tenant quality, not the cash-flow math above.
- Indianapolis Public Schools (urban): math 14% / reading 20% proficiency, ranked #286 of 301 in IN (top 95%) — low school quality limits family demand, transient renter base, plan for 1-2y turnover; 77% free/reduced lunch — lower-income household profile, screen leases tightly.
- Market conditions: Rents flat; 334 active listings in the ZIP; 40 comparable units currently listed for rent nearby; rentals at typical pace (median 22d on market — plan ~3-4 weeks tenant-placement turnaround); lower-income renter base — watch delinquency; 1,906 units permitted in Marion County in 2024 (621 in 5+ unit buildings).
- This rent runs 43% of the median local income ($38k/yr) — at the standard rent-burdened threshold; future hikes will face affordability resistance.
Forward outlook
- Local home prices are declining (-3.0%/yr); year-one equity from $691 of loan paydown is wiped out by about $3k of value loss. Plan a longer hold.
- Marion County population projected at +18% by 2050 — long-run rental-demand tailwind backs the buy-and-hold thesis.
Negotiation context
- Only 7 days on market — expect competitive offers; lowballing is unlikely to land.
- 2 sale attempts since 9y ago with the ask held roughly flat each time — persistent listings suggest the price (not the market) is what's stuck; bring a comps-based counter.
- Current owner paid $62k; list at $100k implies a 63% gain — meaningful room to come down on a strong offer.
Risks & watch-outs
- Watch-outs: property tax is 2.5% of price; flood insurance adds $56/mo; built in 1956 — expect roof / HVAC / electrical / plumbing capex.
- Climate carrying-cost: major flood risk — expect insurance premiums to compound above CPI over the hold.
Questions for the listing agent
- Built in 1956 — when were the roof, HVAC, electrical panel, plumbing, and water heater last replaced?
- Property tax is high relative to price — has the assessment been appealed recently, and will the sale trigger a re-assessment?
- What's the actual annual flood-insurance premium (NFIP or private), and is the property in a SFHA with mandatory coverage?
- Is there a deadline driving the sale (1031 exchange, divorce, estate, relocation)? That informs how much negotiation room exists.
- What's the average days-on-market for RENTAL listings here right now (not sales)? A rising rental-DOM trend means longer vacancies and softer asking-rent achievability than the comps imply.
- What's the recent tenant-quality profile in this submarket — average credit score on applications, eviction rate, late-payment / NSF rate, and stable-employment percentage? A property-management company in the area should have these aggregated.
- How much new for-sale + rental construction is in the pipeline within 1–3 miles? Heavy new supply typically softens prices + rents 12–24 months out; constrained supply supports both.
Investment metrics
- 1% rule
- 1.37% ✓
- Cap rate
- 10.01%
- Cash-on-cash
- 13.27%
- DSCR
- 1.59
- GRM
- 6.1
CMA / ARV
- ARV (on-the-fly)
- $113,360
- Comps found
- 12
Show comp detail 12 sales within ~0.75 mi
| Address | Dist | Beds/Ba | Sqft | Sold | Price | $/sf | Match |
|---|---|---|---|---|---|---|---|
| 3034 E 35th St | 0.19mi | 3/1.5 | 1,080 (+4%) | 7mo | $63,000 | $58 | 79 |
| 3148 N Gale St | 0.53mi | 3/1.0 | 1,068 (+3%) | 3mo | $116,000 | $109 | 67 |
| 3317 Adams St | 0.28mi | 3/1.0 | 988 (-5%) | 12mo | $70,000 | $71 | 66 |
| 3142 N Gale St | 0.54mi | 3/1.0 | 1,104 (+6%) | 7mo | $70,000 | $63 | 56 |
| 3624 N Parker Ave | 0.28mi | 3/2.0 | 1,179 (+13%) | 8mo | $125,000 | $106 | 56 |
| 3460 N Oxford St | 0.37mi | 3/1.0 | 1,176 (+13%) | 6mo | $50,000 | $43 | 54 |
| 3161 N Gale St | 0.51mi | 2/1.0 (-1) | 960 (-8%) | 7mo | $110,000 | $115 | 51 |
| 2324 E 36th St | 0.74mi | 3/2.5 | 1,062 (+2%) | 12mo | $190,000 | $179 | 48 |
| 3209 Forest Manor Ave | 0.74mi | 3/2.0 | 1,104 (+6%) | 14mo | $198,000 | $179 | 42 |
| 3045 N Lasalle St | 0.75mi | 3/2.0 | 952 (-8%) | 12mo | $175,000 | $184 | 39 |
| 3814 E 31st St | 0.74mi | 2/1.0 (-1) | 899 (-14%) | 1mo | $108,500 | $121 | 35 |
| 3845 E 32nd St | 0.70mi | 2/1.0 (-1) | 904 (-13%) | 13mo | $72,000 | $80 | 28 |
Match score weights: distance 35% · size 25% · config 20% · recency 20%. Top-matched comps best support the ARV.
Projected returns pro-forma
-3.0% appreciation · 0.81% rent growth · sell at horizon
- IRR
- -2.8%
- Equity multiple
- 0.90×
- Total profit
- $-2,878
- Equity at exit
- $14,910
- IRR
- 3.9%
- Equity multiple
- 1.25×
- Total profit
- $7,136
- Equity at exit
- $8,646
Cash invested: $28,000 (down + closing). Projections, not guarantees.
Landlord ↔ Tenant lean methodology
- Overall (STATE)
- 90 Strongly Landlord-Friendly
- State Indiana
- 90 Strongly Landlord-Friendly · R+11
- County
- — inherits STATE
- City
- — inherits STATE
ZIP-level market 46218
- Home prices YoY
- -17.1%
- Rents YoY
- 0.8%
- Active inventory
- 334
- Price-to-rent
- 6.1×
Monthly cashflow live
- Estimated rent
- $1,373 high interval (Pro) →
- Mortgage (P&I)
- −$524
- Tax from tax record
- −$209 /mo · $2,506/yr
- Insurance
- −$42
- Flood insurance flood zone
- −$56 /mo · $666/yr
- HOA
- −$0
- Vacancy / Maint / Mgmt
- −$288
- Net cashflow
- $254
Break-even live
UW: 25.0% down · 7.5% · 30yr · 1.5% tax · 5.0% vac · 8.0% maint · 8.0% mgmt
Financing live
Cash to close
- Down payment
- $25,000
- Closing costs
- $3,000
- Reserves months
- —
- Total cash needed
- —
Loan-product check · same deal, 3 products live
Conventional
25% down · 7.5% · 30yr
- Down + closing
- —
- Monthly P&I
- —
- Monthly cashflow
- —
- DSCR
- —
- Eligible?
- —
Personal DTI + credit; lowest rate.
DSCR
20% down · 8.5% · 30yr
- Down + closing
- —
- Monthly P&I
- —
- Monthly cashflow
- —
- DSCR
- —
- Eligible?
- —
No personal income docs; deal must DSCR.
Hard money
10% down · 12.0% · 12mo
- Down + closing
- —
- Monthly P&I
- —
- Monthly cashflow
- —
- DSCR
- —
- Eligible?
- —
Short-term bridge; refi at stabilization.
Rent comps 40 comps
| Address | Beds | Baths | Sqft | Rent | $/sqft | DOM | Units | Dist |
|---|---|---|---|---|---|---|---|---|
| 3522 N Olney St Indianapolis, IN | 3.0 | 1.0 | 768 | $1,300 | $1.69 | 43d | 1 | 0.09mi |
| 3472 N Dearborn St Indianapolis, IN | 2.0 | 1.0 | 890 | $1,099 | $1.23 | 19d | 1 | 0.19mi |
| 3421 N Olney St Indianapolis, IN | 2.0 | 1.0 | 720 | $1,195 | $1.66 | 16d | 1 | 0.19mi |
| 3535 N Oxford St Indianapolis, IN | 3.0 | 1.0 | 1015 | $1,500 | $1.48 | 21d | 1 | 0.31mi |
| 3383 Station St Indianapolis, IN | 3.0 | 1.0 | 744 | $1,250 | $1.68 | 23d | 1 | 0.36mi |
| 3725 N Sherman Dr #7 Indianapolis, IN | 2.0 | 1.0 | 729 | $845 | $1.16 | 4d | 1 | 0.42mi |
| 3615 Sherman Forest Dr Indianapolis, IN | 4.0 | 1.0–2.5 | 1057 | $1,544 | $1.46 | 4d | 1 | 0.43mi |
| 3741 N Tacoma Ave Indianapolis, IN | 3.0 | 1.0 | 913 | $2,200 | $2.41 | 17d | 1 | 0.63mi |
| 4115 Meadows Dr Indianapolis, IN | 1.0–3.0 | 1.0–2.0 | 1013 | $1,592 | $1.57 | 43d | 9 | 0.70mi |
| 2949 Adams St Indianapolis, IN | 2.0 | 1.0 | 978 | $1,150 | $1.18 | 43d | 1 | 0.76mi |
| 2920 N Lasalle St Indianapolis, IN | 3.0 | 1.0 | 875 | $1,095 | $1.25 | 17d | 1 | 0.81mi |
| 3448 Hillside Ave Indianapolis, IN | 4.0 | 1.0 | 1305 | $1,800 | $1.38 | 2d | 1 | 0.82mi |
| 3920 E 30th St Indianapolis, IN | 3.0 | 1.0 | 1071 | $1,350 | $1.26 | 4d | 1 | 0.83mi |
| 3920 E 30th St Indianapolis, IN | 3.0 | 1.0 | 1071 | $1,350 | $1.26 | 7d | 1 | 0.83mi |
| 2906 N Lasalle St Indianapolis, IN | 4.0 | 1.0 | 1032 | $950 | $0.92 | 23d | 1 | 0.84mi |
| 3149 N Gladstone Ave Indianapolis, IN | 3.0 | 1.5 | 1036 | $1,350 | $1.30 | 7d | 1 | 0.84mi |
| 3315 N Euclid Ave Indianapolis, IN | 2.0 | 1.0 | 780 | $1,300 | $1.67 | 14d | 1 | 0.87mi |
| 3532 Caroline Ave Indianapolis, IN | 4.0 | 1.0 | 1177 | $2,299 | $1.95 | 43d | 1 | 0.91mi |
| 3142 N Euclid Ave Indianapolis, IN | 3.0 | 1.0 | 1050 | $1,050 | $1.00 | 43d | 1 | 0.91mi |
| 2827 Adams St Indianapolis, IN | 3.0 | 2.0 | 1200 | $1,512 | $1.26 | 2d | 1 | 0.93mi |
| 2830 Lasalle St Unit 28 Indianapolis, IN | 2.0 | 1.0 | 1400 | $1,100 | $0.79 | 43d | 1 | 0.93mi |
| 3363 Nicholas Ave Indianapolis, IN | 2.0 | 1.0 | 720 | $1,000 | $1.39 | 4d | 1 | 0.94mi |
| 2826 Station St Indianapolis, IN | 3.0 | 2.0 | 1248 | $1,550 | $1.24 | 43d | 1 | 0.96mi |
| 3734 Manor Ct Indianapolis, IN | 3.0 | 1.0 | 1414 | $1,399 | $0.99 | 7d | 1 | 0.97mi |
| 2931 N Tacoma Ave Unit 31 Indianapolis, IN | 2.0 | 1.0 | 800 | $950 | $1.19 | 7d | 1 | 0.97mi |
| 3121 Baltimore Ave Indianapolis, IN | 3.0 | 1.0 | 1232 | $7,865 | $6.38 | 7d | 1 | 0.99mi |
| 2862 N Chester Ave Indianapolis, IN | 3.0 | 2.0 | 1076 | $1,520 | $1.41 | 43d | 1 | 1.00mi |
| 4320 E 30th St Indianapolis, IN | 3.0 | 1.5 | 1152 | $1,195 | $1.04 | 23d | 1 | 1.02mi |
| 2864 Forest Manor Ave Indianapolis, IN | 3.0 | 1.0 | 1018 | $1,500 | $1.47 | 23d | 1 | 1.04mi |
| 3332 Wallace Ave Indianapolis, IN | 3.0 | 1.0 | 936 | $1,600 | $1.71 | 23d | 1 | 1.09mi |
| 1902 E 35th St Indianapolis, IN | 3.0 | 1.0 | 1100 | $1,600 | $1.45 | 43d | 1 | 1.09mi |
| 3167 Shick Dr Indianapolis, IN | 4.0 | 1.0 | 1141 | $2,350 | $2.06 | 43d | 1 | 1.10mi |
| 4400 E Fall Creek Parkway North Dr Indianapolis, IN | 1.0–2.0 | 1.0–1.5 | 857 | $1,349 | $1.57 | 1d | 31 | 1.15mi |
| 3449 E 26th St Indianapolis, IN | 3.0 | 2.0 | 1200 | $1,512 | $1.26 | 2d | 1 | 1.16mi |
| 2819 N Gladstone Ave Indianapolis, IN | 4.0 | 2.0 | 1261 | $1,450 | $1.15 | 43d | 1 | 1.16mi |
| 3451 E 26th St Indianapolis, IN | 3.0 | 2.0 | 1200 | $1,650 | $1.38 | 43d | 1 | 1.16mi |
| 2932 Arthington Blvd Indianapolis, IN | 3.0 | 1.0 | 900 | $1,350 | $1.50 | 23d | 1 | 1.22mi |
| 2950 N Dequincy St Indianapolis, IN | 3.0 | 1.0 | 888 | $1,375 | $1.55 | 14d | 1 | 1.27mi |
| 2820 Caroline Ave Indianapolis, IN | 3.0 | 1.5 | 1112 | $1,250 | $1.12 | 23d | 1 | 1.27mi |
| 2410 Adams St Indianapolis, IN | 3.0 | 1.0 | 900 | $1,200 | $1.33 | 10d | 1 | 1.28mi |
Listing history 10 events
-
2026-06-07statusdays on market $100,000 Pending 7 DOM
-
2026-06-03days on market $100,000 Active 6 DOM
-
2026-06-02days on market $100,000 Active 5 DOM
-
2026-06-01days on market $100,000 Active 4 DOM
-
2026-05-31days on market $100,000 Active 3 DOM
-
2026-05-28$100,000 Active
-
2017-10-23soldstatus $61,500 Sold 228-char remark
Show marketing remark (228 chars)
Nicely rehabbed property with three beds and two baths. Three beds and one bath on the main level.Additional space in the finished, walk out, ground floor basement, could be a separate living quarters with great room as bedroom.
-
2017-10-19status Pending 228-char remark
Show marketing remark (228 chars)
Nicely rehabbed property with three beds and two baths. Three beds and one bath on the main level.Additional space in the finished, walk out, ground floor basement, could be a separate living quarters with great room as bedroom.
-
2017-10-19$65,000 Active 228-char remark
Show marketing remark (228 chars)
Nicely rehabbed property with three beds and two baths. Three beds and one bath on the main level.Additional space in the finished, walk out, ground floor basement, could be a separate living quarters with great room as bedroom.
-
2001-12-31soldstatus $76,874
ⓘ Source: listings_history table (triggers on properties + properties_extension) + one-shot
backfill from property_details.listing_events for pre-trigger history.
Tax reassessment forecast IN · Partial reset (capped growth)
- Current annual tax
- $2,506 · $209/mo
- Projected year-2 tax
- $2,506 · $209/mo
- Expected delta
- $0/yr ($0/mo · 0.0%)
ⓘ Screening estimate from a state-policy table — verify with the county assessor before closing.
Climate risk First Street
- Flood 7/10 Severe FEMA zone X (unshaded) · 78% chance over 30 yrs
- Wildfire 1/10 Low
- Heat 3/10 Moderate 7 d/yr ≥102°F today · 18 d/yr by 30 yrs out
- Wind 2/10 Low 100% chance of damaging wind over 30 yrs
- Air quality 4/10 Moderate 5 unhealthy d/yr today · 7 by 30 yrs out
Nearby sold comps map
Loading sold comps map…
Walkable amenities ~0.75 mi
Loading nearby amenities…
Taxation est. · year 1
- Rental income
- $16,473
- − Mortgage interest
- −$5,602
- − Property taxes
- −$2,506
- − Insurance
- −$1,166
- − Repairs & maintenance
- −$1,318
- − Management
- −$1,318
- − Depreciation
- −$2,909
- Taxable income
- $1,654
- Est. tax owed @ 24.0%
- −$397
- After-tax cash flow
- $2,651/yr
For passive investors: Depreciation is non-cash, so a rental often shows a tax loss while cash-flowing — sheltering income. Rental losses are passive: they offset passive income freely, and up to $25,000/yr can offset ordinary (W-2) income if you actively participate and your MAGI is under $100k (phasing out to $0 by $150k); unused losses carry forward. On sale, claimed depreciation is recaptured at up to 25%, and gains may owe capital-gains tax (a 1031 exchange can defer both). Figures are a year-1 estimate at your 24.0% rate — not tax advice; consult a CPA.
Schools (NCES district)
- District
- Indianapolis Public Schools
- NCES district ID
- 1804770
- Math proficiency
- 14% ▼ -7.00%
- Reading proficiency
- 20% ▼ -3.00%
- Median HH income
- $32,034
- Composite
- 13.69/100
- National rank
- #9499
- State rank
- #286 of 301 in IN
Livability — Indianapolis city (balance)
No livability data for this city. (Only ~50 U.S. cities are tracked.)
Census & demographics
- Census place
- Indianapolis city (balance), IN
- County
- Marion County · 998,460 people
- City population
- 881,119
- Metro
- Indianapolis-Carmel-Anderson, IN
- Population (ZIP)
- 29,360
- Household income
- $38,063
- Rent vs Own
- Severe rent burden
- 2340.0
Population outlook (Marion County) Hauer SSP2
- Today (2025)
- 1,025,572 people
- By 2030
- 1,065,727 · +3.9%
- By 2040
- 1,141,577 · +11.3%
- By 2050
- 1,208,920 · +17.9%
- By 2075
- 1,367,288 · +33.3%
- By 2100
- 1,438,201 · +40.2%
Race, ethnicity, and origin ACS 2023
- Neighborhood character
- Predominantly Black (68%)
- Race & ethnicity
- Black 68% White 18% Hispanic / Latino 9% Two or more races 6%
- Hispanic origin (detail)
- Mexican 6%
- Common ancestry
- Romanian 1%
- Foreign-born
- 5% · Canada, Philippines
- Languages at home
- 92% English-only · Spanish 7%
Political lean MEDSL · Marion
- 2024 margin
- Strong D (+27.7) · D 63.0% · R 35.3% · Other 1.7%
- 2008→2024 swing
- -0.7pp no change · 2008: 28.4pp · 2024: 27.7pp
- All cycles
- 2024: D+27.7 2020: D+29.1 2016: D+22.8 2012: D+22.2 2008: D+28.4
Not yet ingested
- Civics
- —
Market trends
- HPI YoY
- ▼ -81.57%
- Current HPI
- 395.7071
- Rent YoY
- ▲ 0.81%
- Metro
- Indianapolis-Carmel-Anderson, IN
- State GDP YoY
- ▲ 2.90%
- F500 in state
- 18
Industry mix (Fortune 500 HQ in IN)
| Industry | F500 HQs | Revenue |
|---|---|---|
| Industrial Machinery | 2 | $37B |
|
||
| Healthcare | 1 | $177B |
|
||
| Pharmaceuticals | 1 | $45B |
|
||
| Metals / Steel | 1 | $18B |
|
||
| Agriculture | 1 | $17B |
|
||
| Packaging | 1 | $12B |
|
||
Price history
+30.1% since first listed5 events — show timeline
- 2026-05-28 Listed $100,000 MIBOR as Distributed by MLS Grid
- 2017-10-23 Sold (MLS) $61,500 MIBOR as Distributed by MLS Grid
- 2017-10-19 Pending — MIBOR as Distributed by MLS Grid
- 2017-10-19 Listed $65,000 MIBOR as Distributed by MLS Grid
- 2001-12-31 Sold (Public Records) $76,874 Public Records
Property tax history
+14.9%/yrLatest (2025): $2,506 · +7.3% YoY. Source: county tax records.
Cash-flow waterfall
monthlySold comps — $/sqft
last 12 mo · ≤1 miLoading sold comps…