519 Micklenburg St · Victoria, VA
Flood risk 1/10 · Minimal
- FEMA flood zone
- X (unshaded)
- Chance of flooding over 30 yrs
- 0.0%
- Est. flood insurance / yr
- $507 – $1,088
Fire risk 4/10 · Minor
- Est. fire insurance / yr
- $666 – $1,236
Heat risk 6/10 · Moderate
- Hot days now (above 104°F)
- 7 days/yr
- Hot days in 30 yrs
- 15 days/yr
Wind risk 4/10 · Minor
- Chance of severe wind over 30 yrs
- 18.0%
Air-quality risk 2/10 · Minimal
- Unhealthy air days now
- 1 days/yr
- Unhealthy air days in 30 yrs
- 1 days/yr
Risk factors via First Street. Map © Google.
Why this score? — see what drove the B grade
The composite is a weighted blend of 9 inputs, each scored 0–100. Each bar is that input's sub-score; the figure is the points it added to the 100-point composite (weight × sub-score).
- Cash flow +30.0/30.0
- DSCR +10.0/10.0
- 1% rule +7.7/10.0
- ARV discount +7.5/15.0
- Appreciation +4.7/10.0
- Schools +3.9/10.0
- Livability +3.5/5.0
- Rent growth +2.5/5.0
- Condition / age +2.5/5.0
$80,000
🖨 Deal sheet (PDF) 📄 Offer letter ✓ Due diligence
Listing remarks MLS
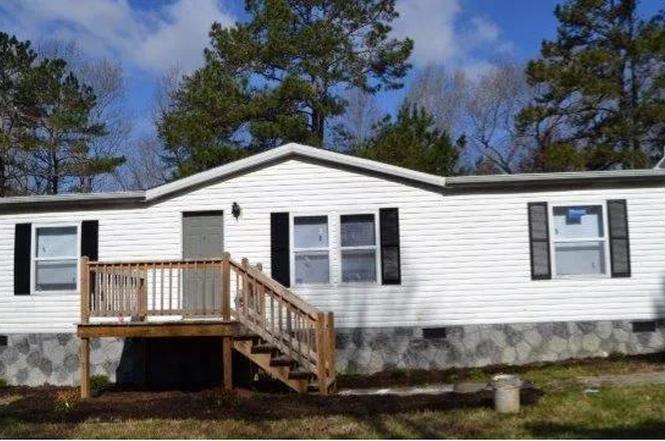
Doublewide located in the country on almost 1 acre with 3 bedrooms and 2 baths and 1188 square feet of living space. Just minutes from local dining, shopping and entertainment. Needs work. Sold as-is, where is. Call your Realtor to view. Thanks for looking.
Key facts
- 0.96 acre lot
- Built 2009
Neighborhood map
What this means for you Summary
Snapshot
- This is a 3-bed/2.0-bath manufactured listed at $80k.
Deal economics
- At list price, monthly cash flow is $331 ($4k/yr) — positive.
- The deal already cash-flows at list — no discount required.
- Meets the 1% rule at list price ($1k rent vs $80k).
Location & tenants
- Location reads 70/100 on livability (#235 in VA) — a middle-class / working-renter tenant base. Strengths: cost of living A+, health & safety A+, housing A; Watch: amenities F, commute F, employment F.
- Lunenburg County Public School District (rural): math 33% / reading 60% proficiency, ranked #110 of 131 in VA (top 84%) — families likely to look elsewhere, expect single-tenant / working-renter base with shorter leases; 60% free/reduced lunch — lower-income household profile, screen leases tightly.
- Zoned schools: Victoria Elementary (math 37% / reading 57%, grade D-, #794 of 1,108 statewide, top 74%, 378 students, 99% FRL); Lunenburg Middle (math 23% / reading 63%, grade D-, #288 of 342 statewide, top 85%, 332 students, 98% FRL); Central High (math 57% / reading 67%, grade B-, #231 of 319 statewide, top 75%, 495 students, 98% FRL) — zoned schools average 98% FRL vs 60% district-wide (38 pts higher); higher-poverty schools than district average — tighter screening recommended.
- Market conditions: 26 active listings in the ZIP; 25 units permitted in Lunenburg County in 2024 (0 in 5+ unit buildings).
Forward outlook
- In year one you build about $29 of equity ($553 loan paydown + $-524 appreciation (-0.7% local appreciation)).
- Lunenburg County population projected at -27% by 2050 — secular population decline; favor cash flow + early exit over multi-decade hold.
- At projected returns (-0.7% appreciation + 3.0% rent growth), your $22k cash investment doubles in ~5 years — after that, you're playing with house money.
Negotiation context
- Only 0 days on market — expect competitive offers; lowballing is unlikely to land.
- 2 sale attempts since 10y ago; this cycle's ask is 7% above the opening price — seller raised mid-cycle; expect resistance to lowballs.
- Current owner paid $50k; list at $80k implies a 60% gain — meaningful room to come down on a strong offer.
Risks & watch-outs
- Climate carrying-cost: extreme-heat days projected 7→15/yr by 2055 (HVAC capex compounding) — expect insurance premiums to compound above CPI over the hold.
Questions for the listing agent
- Is there a deadline driving the sale (1031 exchange, divorce, estate, relocation)? That informs how much negotiation room exists.
- Schools are B-rated — typically a magnet for longer-tenancy family renters. What's the average tenant stay here, and is there a school-zone premium baked into asking?
- What's the average days-on-market for RENTAL listings here right now (not sales)? A rising rental-DOM trend means longer vacancies and softer asking-rent achievability than the comps imply.
- What's the recent tenant-quality profile in this submarket — average credit score on applications, eviction rate, late-payment / NSF rate, and stable-employment percentage? A property-management company in the area should have these aggregated.
- How much new for-sale + rental construction is in the pipeline within 1–3 miles? Heavy new supply typically softens prices + rents 12–24 months out; constrained supply supports both.
Investment metrics
- 1% rule
- 1.27% ✓
- Cap rate
- 11.26%
- Cash-on-cash
- 17.74%
- DSCR
- 1.79
- GRM
- 6.6
CMA / ARV
No comps found within radius.
Projected returns pro-forma
-0.65% appreciation · 3.0% rent growth · sell at horizon
- IRR
- 15.7%
- Equity multiple
- 1.73×
- Total profit
- $16,286
- Equity at exit
- $20,646
- IRR
- 21.0%
- Equity multiple
- 3.19×
- Total profit
- $49,028
- Equity at exit
- $22,839
Cash invested: $22,400 (down + closing). Projections, not guarantees.
Landlord ↔ Tenant lean methodology
- Overall (STATE)
- 55 Moderately Landlord-Leaning
- State Virginia
- 55 Moderately Landlord-Leaning · D+2
- County
- — inherits STATE
- City
- — inherits STATE
ZIP-level market 23974
- Home prices YoY
- -0.4%
- Active inventory
- 26
- Price-to-rent
- 6.6×
Monthly cashflow live
- Estimated rent
- $1,015 medium interval (Pro) →
- Mortgage (P&I)
- −$420
- Tax from tax record
- −$18 /mo · $219/yr
- Insurance
- −$33
- HOA
- −$0
- Vacancy / Maint / Mgmt
- −$213
- Net cashflow
- $331
Break-even live
Sensitivity live
| Price | -10% $376 | -5% $354 | +0% $331 | +5% $308 | +10% $286 |
|---|---|---|---|---|---|
| Rent | -10% $251 | -5% $291 | +0% $331 | +5% $371 | +10% $411 |
| Rate | -1.0pp $371 | -0.5pp $351 | base $331 | +0.5pp $310 | +1.0pp $289 |
UW: 25.0% down · 7.5% · 30yr · 1.5% tax · 5.0% vac · 8.0% maint · 8.0% mgmt
Financing live
Cash to close
- Down payment
- $20,000
- Closing costs
- $2,400
- Reserves months
- —
- Total cash needed
- —
Loan-product check · same deal, 3 products live
Conventional
25% down · 7.5% · 30yr
- Down + closing
- —
- Monthly P&I
- —
- Monthly cashflow
- —
- DSCR
- —
- Eligible?
- —
Personal DTI + credit; lowest rate.
DSCR
20% down · 8.5% · 30yr
- Down + closing
- —
- Monthly P&I
- —
- Monthly cashflow
- —
- DSCR
- —
- Eligible?
- —
No personal income docs; deal must DSCR.
Hard money
10% down · 12.0% · 12mo
- Down + closing
- —
- Monthly P&I
- —
- Monthly cashflow
- —
- DSCR
- —
- Eligible?
- —
Short-term bridge; refi at stabilization.
Listing history 6 events
-
2020-10-30soldstatus $50,000
-
2019-06-13historical
-
2019-03-26$75,000
-
2016-10-14soldstatus $20,000 257-char remark
Show marketing remark (257 chars)
Doublewide located in the country on almost 1 acre with 3 bedrooms and 2 baths and 1188 square feet of living space. Just minutes from local dining, shopping and entertainment. Needs work. Sold as-is, where is. Call your Realtor to view. Thanks for looking.
-
2016-10-14soldstatus $20,000
Show marketing remark (257 chars)
Doublewide located in the country on almost 1 acre with 3 bedrooms and 2 baths and 1188 square feet of living space. Just minutes from local dining, shopping and entertainment. Needs work. Sold as-is, where is. Call your Realtor to view. Thanks for looking.
-
2016-07-05$25,000 257-char remark
Show marketing remark (257 chars)
Doublewide located in the country on almost 1 acre with 3 bedrooms and 2 baths and 1188 square feet of living space. Just minutes from local dining, shopping and entertainment. Needs work. Sold as-is, where is. Call your Realtor to view. Thanks for looking.
ⓘ Source: listings_history table (triggers on properties + properties_extension) + one-shot
backfill from property_details.listing_events for pre-trigger history.
Tax reassessment forecast VA · Resets to sale price
- Current annual tax
- $219 · $18/mo
- Projected year-2 tax
- $656 · $55/mo
- Expected delta
- +$437/yr (+$36/mo · 200.0%)
ⓘ Screening estimate from a state-policy table — verify with the county assessor before closing.
Climate risk First Street
- Flood 1/10 Low FEMA zone X (unshaded) · 0% chance over 30 yrs
- Wildfire 4/10 Moderate
- Heat 6/10 Major 7 d/yr ≥104°F today · 15 d/yr by 30 yrs out
- Wind 4/10 Moderate 18% chance of damaging wind over 30 yrs
- Air quality 2/10 Low 1 unhealthy d/yr today · 1 by 30 yrs out
Nearby sold comps map
Loading sold comps map…
Walkable amenities ~0.75 mi
Loading nearby amenities…
Taxation est. · year 1
- Rental income
- $12,186
- − Mortgage interest
- −$4,481
- − Property taxes
- −$219
- − Insurance
- −$400
- − Repairs & maintenance
- −$975
- − Management
- −$975
- − Depreciation
- −$2,327
- Taxable income
- $2,809
- Est. tax owed @ 24.0%
- −$674
- After-tax cash flow
- $3,300/yr
For passive investors: Depreciation is non-cash, so a rental often shows a tax loss while cash-flowing — sheltering income. Rental losses are passive: they offset passive income freely, and up to $25,000/yr can offset ordinary (W-2) income if you actively participate and your MAGI is under $100k (phasing out to $0 by $150k); unused losses carry forward. On sale, claimed depreciation is recaptured at up to 25%, and gains may owe capital-gains tax (a 1031 exchange can defer both). Figures are a year-1 estimate at your 24.0% rate — not tax advice; consult a CPA.
Schools (NCES district)
- District
- Lunenburg County Public School District
- NCES district ID
- 5102310
- Math proficiency
- 33% ▼ -41.00%
- Reading proficiency
- 60% ▼ -13.00%
- Median HH income
- $37,728
- Composite
- 38.6/100
- National rank
- #4162
- State rank
- #110 of 131 in VA
Livability — Victoria
- Score
- 70/100
- State rank
- #235
- US rank
- #7920
Category grades
Schools grade is shown separately in the Schools card above.
Census & demographics
- Population (ZIP)
- 4,908
Population outlook (Lunenburg County) Hauer SSP2
- Today (2025)
- 11,367 people
- By 2030
- 10,757 · -5.4%
- By 2040
- 9,464 · -16.7%
- By 2050
- 8,329 · -26.7%
- By 2075
- 6,292 · -44.6%
- By 2100
- 4,575 · -59.8%
Race, ethnicity, and origin ACS 2023
- Neighborhood character
- Majority White (55%)
- Race & ethnicity
- White 55% Black 39% Two or more races 5% Hispanic / Latino 3%
- Common ancestry
- Serbian 1% Slovak 1% Romanian 1%
- Foreign-born
- 1% · Canada
- Languages at home
- 99% English-only · Spanish 1%
Political lean MEDSL · Lunenburg
- 2024 margin
- Strong R (+22.8) · D 38.3% · R 61.1%
- 2008→2024 swing
- -19.3pp toward R · 2008: -3.5pp · 2024: -22.8pp
- All cycles
- 2024: R+22.8 2020: R+18.6 2016: R+17.6 2012: R+5.0 2008: R+3.5
Not yet ingested
- Civics
- —
Market trends
- HPI YoY
- ▼ -0.65%
- Current HPI
- 177.4653
- Rent YoY
- —
- Metro
- —
- State GDP YoY
- ▲ 2.40%
- F500 in state
- 50
Industry mix (Fortune 500 HQ in VA)
| Industry | F500 HQs | Revenue |
|---|---|---|
| Aerospace / Defense | 4 | $236B |
|
||
| Technology / Defense | 3 | $32B |
|
||
| Financial Services | 2 | $176B |
|
||
| Utilities | 2 | $27B |
|
||
| Insurance | 2 | $25B |
|
||
| Technology | 2 | $15B |
|
||
Price history
+100.0% since first listed6 events — show timeline
- 2020-10-30 Sold (Public Records) $50,000 Public Records
- 2019-06-13 Listing Removed — CVRMLS
- 2019-03-26 Listed $75,000 CVRMLS
- 2016-10-14 Sold (MLS) $20,000 SCAR
- 2016-10-14 Sold (MLS) $20,000 RVLG
- 2016-07-05 Listed $25,000 RVLG
Property tax history
+0.1%/yrLatest (2026): $219 · +12.1% YoY. Source: county tax records.
Cash-flow waterfall
monthlySold comps — $/sqft
last 12 mo · ≤1 miLoading sold comps…