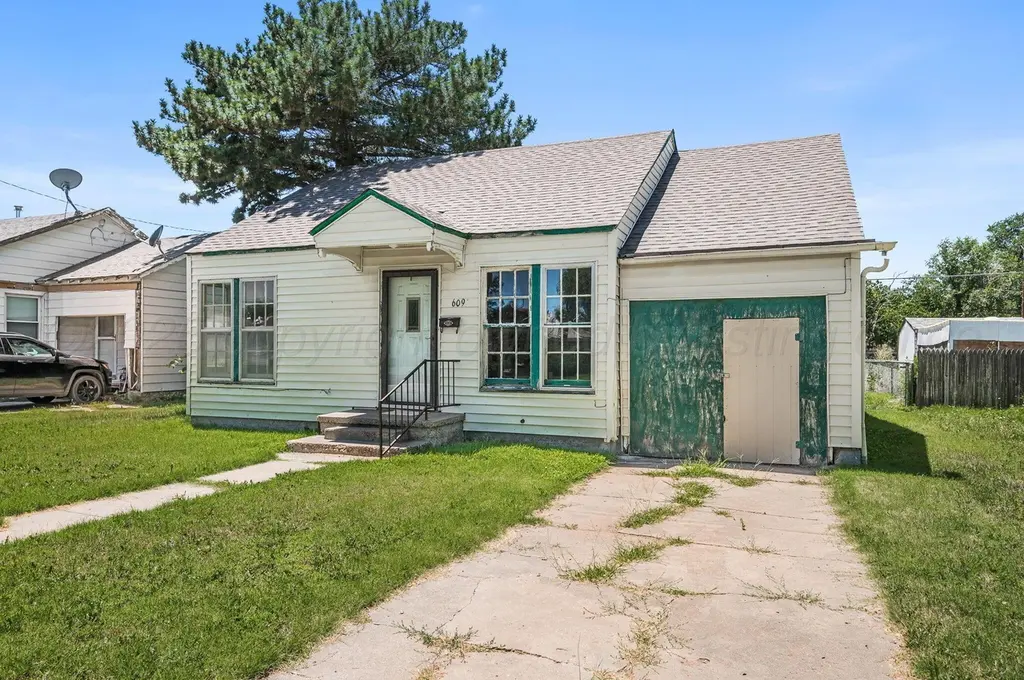
609 Sumner St · Pampa, TX
Flood risk 1/10 · Minimal
- FEMA flood zone
- X (unshaded)
- Chance of flooding over 30 yrs
- 0.0%
- Est. flood insurance / yr
- $507 – $1,088
Fire risk 9/10 · Severe
- Est. fire insurance / yr
- $1,222 – $2,270
Heat risk 5/10 · Moderate
- Hot days now (above 99°F)
- 7 days/yr
- Hot days in 30 yrs
- 19 days/yr
Wind risk 2/10 · Minimal
- Chance of severe wind over 30 yrs
- —
Air-quality risk 2/10 · Minimal
- Unhealthy air days now
- 1 days/yr
- Unhealthy air days in 30 yrs
- 1 days/yr
Risk factors via First Street. Map © Google.
Why this score? — see what drove the C+ grade
The composite is a weighted blend of 9 inputs, each scored 0–100. Each bar is that input's sub-score; the figure is the points it added to the 100-point composite (weight × sub-score).
- Cash flow +27.7/30.0
- DSCR +9.8/10.0
- ARV discount +7.5/15.0
- 1% rule +7.1/10.0
- Livability +3.8/5.0
- Schools +3.1/10.0
- Rent growth +2.5/5.0
- Condition / age +2.5/5.0
- Appreciation +0.0/10.0
$75,000
🖨 Deal sheet 📄 Offer letter ✓ Due diligence
Listing remarks MLS
Charming and move-in ready, this adorable 2-bedroom, 1-bath home offers a welcoming blend of classic character and modern updates. Enjoy original hardwood floors in the hallway and both bedrooms, complemented by newer vinyl flooring in the spacious living room, dining area, and kitchen. The open-concept layout creates a bright and inviting atmosphere, perfect for relaxing or entertaining. Kitchen: Functional and updated, with easy-care vinyl flooring. Dining Area: Seamlessly flows from the kitchen and living room. Living Room: Features newer vinyl flooring for a modern touch. Bedrooms: Both bedrooms have beautiful original hardwood floors. Bathroom: Conveniently located between the bedrooms.
Key facts
- Functional kitchen
- Dining area flows
- Newer vinyl flooring
Tags
Neighborhood map
What this means for you Summary
Snapshot
- This is a 2-bed/1.0-bath single-family listed at $75k.
Deal economics
- At list price, monthly cash flow is $227 ($3k/yr) — positive.
- The deal already cash-flows at list — no discount required.
- Meets the 1% rule at list price ($910 rent vs $75k).
- Recommended offer: $66k (12.0% below list) — sets the bar for market timing.
Location & tenants
- Location reads 75/100 on livability (#128 in TX, #3,885 nationally) — a middle-class / working-renter tenant base. Strengths: cost of living A+, housing A+, health & safety A+; Watch: schools D+, employment D+, crime F.
- Pampa ISD (town): math 38% / reading 36% proficiency, ranked #482 of 826 in TX (top 58%) — families likely to look elsewhere, expect single-tenant / working-renter base with shorter leases.
- Market conditions: 174 active listings in the ZIP; 6 comparable units currently listed for rent nearby; rentals lingering (median 44d on market — plan ~5-8 weeks vacancy on turnover, expect pricing pressure); 100% of comp listings sitting > 30 days — soft ceiling on asking rent; 7 units permitted in Gray County in 2024 (0 in 5+ unit buildings).
Forward outlook
- Local home prices are declining (-3.0%/yr); year-one equity from $519 of loan paydown is wiped out by about $2k of value loss. Plan a longer hold.
- Gray County population projected at +28% by 2050 — long-run rental-demand tailwind backs the buy-and-hold thesis.
- At projected returns (-3.0% appreciation + 3.0% rent growth), your $21k cash investment doubles in ~9 years — after that, you're playing with house money.
Negotiation context
- It's been on market 343 days — a 12% lower offer ($66k) is reasonable based on typical stale-listing flexibility.
- 3 sale attempts since 11y ago with the ask held roughly flat each time — persistent listings suggest the price (not the market) is what's stuck; bring a comps-based counter.
Risks & watch-outs
- Climate carrying-cost: severe wildfire risk; extreme-heat days projected 7→19/yr by 2055 (HVAC capex compounding) — expect insurance premiums to compound above CPI over the hold.
Questions for the listing agent
- It's been on market 343 days. Have you received any prior offers? Is the seller open to a 12% concession, seller financing, or rate buy-down credit?
- Why hasn't it sold? Are there any deal-killer items the seller is aware of (foundation, flood, title, zoning, code violations)?
- Is there a deadline driving the sale (1031 exchange, divorce, estate, relocation)? That informs how much negotiation room exists.
- Schools are D-rated, which usually means shorter tenancies and higher turnover. Who's the typical renter profile here, and what's been the actual vacancy rate?
- Crime grade is F in this area — have there been break-ins, vandalism, or insurance claims at this property in the last 3 years? What carrier currently insures it and at what premium?
- What's the average days-on-market for RENTAL listings here right now (not sales)? A rising rental-DOM trend means longer vacancies and softer asking-rent achievability than the comps imply.
- What's the recent tenant-quality profile in this submarket — average credit score on applications, eviction rate, late-payment / NSF rate, and stable-employment percentage? A property-management company in the area should have these aggregated.
- How much new for-sale + rental construction is in the pipeline within 1–3 miles? Heavy new supply typically softens prices + rents 12–24 months out; constrained supply supports both.
Investment metrics
- 1% rule
- 1.21% ✓
- Cap rate
- 9.93%
- Cash-on-cash
- 12.99%
- DSCR
- 1.58
- GRM
- 6.9
CMA / ARV
- ARV (median comp)
- $41,213
- List price
- $75,000
- Delta
- 81.98%
- Verdict
- OVERPRICED
- Comps
- 3 within 2.0 mi
Projected returns pro-forma
-3.0% appreciation · 3.0% rent growth · sell at horizon
- IRR
- 2.9%
- Equity multiple
- 1.11×
- Total profit
- $2,322
- Equity at exit
- $11,183
- IRR
- 12.4%
- Equity multiple
- 1.98×
- Total profit
- $20,654
- Equity at exit
- $6,485
Cash invested: $21,000 (down + closing). Projections, not guarantees.
Landlord ↔ Tenant lean methodology
- Overall (STATE)
- 87 Strongly Landlord-Friendly
- State Texas
- 87 Strongly Landlord-Friendly · R+5
- County
- — inherits STATE
- City
- — inherits STATE
ZIP-level market 79065
- Active inventory
- 174
- Price-to-rent
- 6.9×
Monthly cashflow live
- Estimated rent
- $910 high interval (Pro) →
- Mortgage (P&I)
- −$393
- Tax from tax record
- −$67 /mo · $803/yr
- Insurance
- −$31
- HOA
- −$0
- Vacancy / Maint / Mgmt
- −$191
- Net cashflow
- $227
Break-even live
UW: 25.0% down · 7.5% · 30yr · 1.5% tax · 5.0% vac · 8.0% maint · 8.0% mgmt
Financing live
Cash to close
- Down payment
- $18,750
- Closing costs
- $2,250
- Reserves months
- —
- Total cash needed
- —
Loan-product check · same deal, 3 products live
Conventional
25% down · 7.5% · 30yr
- Down + closing
- —
- Monthly P&I
- —
- Monthly cashflow
- —
- DSCR
- —
- Eligible?
- —
Personal DTI + credit; lowest rate.
DSCR
20% down · 8.5% · 30yr
- Down + closing
- —
- Monthly P&I
- —
- Monthly cashflow
- —
- DSCR
- —
- Eligible?
- —
No personal income docs; deal must DSCR.
Hard money
10% down · 12.0% · 12mo
- Down + closing
- —
- Monthly P&I
- —
- Monthly cashflow
- —
- DSCR
- —
- Eligible?
- —
Short-term bridge; refi at stabilization.
Rent comps 6 comps
| Address | Beds | Baths | Sqft | Rent | $/sqft | DOM | Units | Dist |
|---|---|---|---|---|---|---|---|---|
| 1404 Coronado Dr Pampa, TX | 3.0 | 2.5 | 1500 | $1,200 | $0.80 | 43d | 1 | 0.35mi |
| 1601 W Somerville St Unit 1201 Pampa, TX | 3.0 | 2.0 | 1053 | $865 | $0.82 | 43d | 1 | 0.48mi |
| 1601 W Somerville St Unit 1001 Pampa, TX | 2.0 | 2.0 | 935 | $780 | $0.83 | 43d | 1 | 0.48mi |
| 1601 W Somerville St Unit 601 Pampa, TX | 1.0 | 1.0 | 812 | $750 | $0.92 | 43d | 1 | 0.48mi |
| 1601 W Somerville St Unit 103 Pampa, TX | 1.0 | 1.0 | 700 | $700 | $1.00 | 43d | 1 | 0.48mi |
| 100 Hampton Ln Pampa, TX | 2.0 | 2.0 | 1000 | $1,048 | $1.05 | 43d | 1 | 0.49mi |
Listing history 18 events
-
2026-06-18days on market $75,000 Active 343 DOM
-
2026-06-17days on market $75,000 Active 342 DOM
-
2026-06-16days on market $75,000 Active 341 DOM
-
2026-06-15days on market $75,000 Active 340 DOM
-
2026-06-15days on market $75,000 Active 339 DOM
-
2026-06-13days on market $75,000 Active 338 DOM
-
2026-06-12days on market $75,000 Active 337 DOM
-
2026-06-10days on market $75,000 Active 334 DOM
-
2026-06-08days on market $75,000 Active 333 DOM
-
2026-06-08days on market $75,000 Active 332 DOM
-
2026-06-03days on market $75,000 Active 328 DOM
-
2026-06-02days on market $75,000 Active 327 DOM
-
2026-06-01days on market $75,000 Active 326 DOM
-
2026-05-31days on market $75,000 Active 325 DOM
-
2025-07-10$75,000 Active 700-char remark
Show marketing remark (700 chars)
Charming and move-in ready, this adorable 2-bedroom, 1-bath home offers a welcoming blend of classic character and modern updates. Enjoy original hardwood floors in the hallway and both bedrooms, complemented by newer vinyl flooring in the spacious living room, dining area, and kitchen. The open-concept layout creates a bright and inviting atmosphere, perfect for relaxing or entertaining. Kitchen: Functional and updated, with easy-care vinyl flooring. Dining Area: Seamlessly flows from the kitchen and living room. Living Room: Features newer vinyl flooring for a modern touch. Bedrooms: Both bedrooms have beautiful original hardwood floors. Bathroom: Conveniently located between the bedrooms.
-
2024-09-06$79,000 Active
-
2015-04-09soldstatus
-
2015-01-26$19,900
ⓘ Source: listings_history table (triggers on properties + properties_extension) + one-shot
backfill from property_details.listing_events for pre-trigger history.
Tax reassessment forecast TX · Resets to sale price
- Current annual tax
- $803 · $67/mo
- Projected year-2 tax
- $1,372 · $114/mo
- Expected delta
- +$570/yr (+$47/mo · 71.0%)
ⓘ Screening estimate from a state-policy table — verify with the county assessor before closing.
Climate risk First Street
- Flood 1/10 Low FEMA zone X (unshaded) · 0% chance over 30 yrs
- Wildfire 9/10 Extreme
- Heat 5/10 Major 7 d/yr ≥99°F today · 19 d/yr by 30 yrs out
- Wind 2/10 Low
- Air quality 2/10 Low 1 unhealthy d/yr today · 1 by 30 yrs out
Nearby sold comps map
Loading sold comps map…
Walkable amenities ~0.75 mi
Loading nearby amenities…
Taxation est. · year 1
- Rental income
- $10,918
- − Mortgage interest
- −$4,201
- − Property taxes
- −$803
- − Insurance
- −$375
- − Repairs & maintenance
- −$873
- − Management
- −$873
- − Depreciation
- −$2,182
- Taxable income
- $1,611
- Est. tax owed @ 24.0%
- −$387
- After-tax cash flow
- $2,341/yr
For passive investors: Depreciation is non-cash, so a rental often shows a tax loss while cash-flowing — sheltering income. Rental losses are passive: they offset passive income freely, and up to $25,000/yr can offset ordinary (W-2) income if you actively participate and your MAGI is under $100k (phasing out to $0 by $150k); unused losses carry forward. On sale, claimed depreciation is recaptured at up to 25%, and gains may owe capital-gains tax (a 1031 exchange can defer both). Figures are a year-1 estimate at your 24.0% rate — not tax advice; consult a CPA.
Schools (NCES district)
- District
- Pampa ISD
- NCES district ID
- 4834170
- Math proficiency
- 38% ▼ -10.00%
- Reading proficiency
- 36% ▬ 0.00%
- Median HH income
- $43,741
- Composite
- 31.43/100
- National rank
- #5986
- State rank
- #482 of 826 in TX
Livability — Pampa
- Score
- 75/100
- State rank
- #128
- US rank
- #3885
Category grades
Schools grade is shown separately in the Schools card above.
Census & demographics
- Census place
- Pampa, TX
- Population (ZIP)
- 19,569
Population outlook (Gray County) Hauer SSP2
- Today (2025)
- 24,965 people
- By 2030
- 26,105 · +4.6%
- By 2040
- 28,752 · +15.2%
- By 2050
- 31,859 · +27.6%
- By 2075
- 39,812 · +59.5%
- By 2100
- 43,284 · +73.4%
Race, ethnicity, and origin ACS 2023
- Neighborhood character
- Majority White (59%)
- Race & ethnicity
- White 59% Hispanic / Latino 32% Two or more races 6% Black 5% Native American 1%
- Hispanic origin (detail)
- Mexican 29%
- Common ancestry
- Slovak 3% Iranian 2% Lithuanian 2%
- Foreign-born
- 10% · Canada, South Korea
- Languages at home
- 79% English-only · Spanish 21%
Political lean MEDSL · Gray
- 2024 margin
- Solid R (+77.1) · D 11.2% · R 88.3%
- 2008→2024 swing
- -6.2pp toward R · 2008: -71.0pp · 2024: -77.1pp
- All cycles
- 2024: R+77.1 2020: R+77.2 2016: R+78.8 2012: R+75.2 2008: R+71.0
Not yet ingested
- Civics
- —
Market trends
- HPI YoY
- ▼ -88.67%
- Current HPI
- 128.8525
- Rent YoY
- —
- Metro
- —
- State GDP YoY
- ▲ 3.95%
- F500 in state
- 110
Industry mix (Fortune 500 HQ in TX)
| Industry | F500 HQs | Revenue |
|---|---|---|
| Energy | 16 | $1,198B |
|
||
| Technology | 5 | $198B |
|
||
| Engineering / Construction | 4 | $72B |
|
||
| Energy Services | 3 | $60B |
|
||
| Utilities | 3 | $41B |
|
||
| Healthcare | 2 | $330B |
|
||
Price history
+276.9% since first listed4 events — show timeline
- 2025-07-10 Listed $75,000 PBOR
- 2024-09-06 Listed $79,000 PBOR
- 2015-04-09 Sold (MLS) — AARMLS
- 2015-01-26 Listed $19,900 AARMLS
Property tax history
+6.7%/yrLatest (2025): $803 · +11.7% YoY. Source: county tax records.
Cash-flow waterfall
monthlySold comps — $/sqft
last 12 mo · ≤1 miLoading sold comps…