242 H St · Belchertown, MA
Flood risk No data
- FEMA flood zone
- —
- Chance of flooding over 30 yrs
- —
- Est. flood insurance / yr
- —
Fire risk No data
- Est. fire insurance / yr
- —
Heat risk No data
- Hot days now (above threshold)
- —
- Hot days in 30 yrs
- —
Wind risk No data
- Chance of severe wind over 30 yrs
- —
Air-quality risk No data
- Unhealthy air days now
- —
- Unhealthy air days in 30 yrs
- —
Risk factors via First Street. Map © Google.
Why this score? — see what drove the B- grade
The composite is a weighted blend of 9 inputs, each scored 0–100. Each bar is that input's sub-score; the figure is the points it added to the 100-point composite (weight × sub-score).
- Cash flow +28.7/30.0
- 1% rule +10.0/10.0
- DSCR +10.0/10.0
- ARV discount +7.5/15.0
- Schools +3.9/10.0
- Livability +3.9/5.0
- Rent growth +2.5/5.0
- Condition / age +2.2/5.0
- Appreciation +0.0/10.0
$125,000
🖨 Deal sheet 📄 Offer letter ✓ Due diligence
Listing remarks MLS
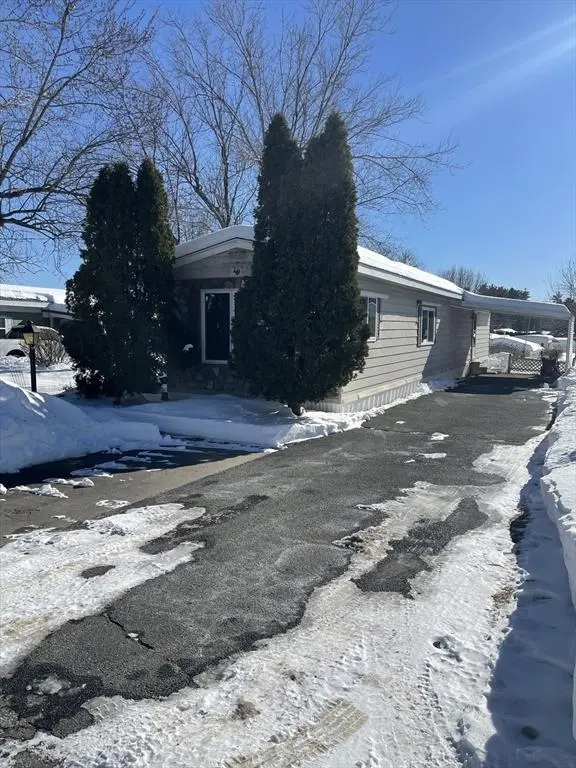
Located in a desirable 55+ community, this well-maintained mobile home is a fantastic option for comfortable downsizing. Offering 700 square feet of thoughtfully designed living space, the open floor plan makes the home feel larger and more spacious than expected. Situated on the Springfield Street side of the park, the location provides easy access in and out of the community for added convenience.The home features a unique man-made rock front that adds curb appeal and sets it apart from others in the park. Inside, the primary bedroom offers generous space along with ample built-in storage. The home has been well cared for and can be sold partially furnished, making for an easy and seamless move. Efficient, inviting, and full of charm—this home is ready to be enjoyed.
Key facts
- Man-made rock front
- Built-in storage
- Garage
Tags
Neighborhood map
What this means for you Summary
Snapshot
- This is a 2-bed/1.0-bath manufactured listed at $125k. Condition is rated fair.
Deal economics
- At list price, monthly cash flow is $418 ($5k/yr) — positive.
- The deal already cash-flows at list — no discount required.
- Meets the 1% rule at list price ($2k rent vs $125k).
- Recommended offer: $110k (12.0% below list) — sets the bar for market timing.
- Cap rate 10.3% vs local median 3.0% in Belchertown — top-decile yield for the area; either an underpriced asset or a hidden risk that comps aren't pricing in. Stress-test before assuming the spread holds.
Location & tenants
- Location reads 77/100 on livability (#56 in MA, #2,946 nationally) — a middle-class / working-renter tenant base. Strengths: housing A+, health & safety A+, crime A; Watch: cost of living D+, amenities F.
- Belchertown (rural): math 35% / reading 49% proficiency, ranked #176 of 302 in MA (top 58%) — families likely to look elsewhere, expect single-tenant / working-renter base with shorter leases; only 18% free/reduced lunch — higher-income household profile.
- Market conditions: 55 active listings in the ZIP; solid renter incomes; 349 units permitted in Hampshire County in 2024 (185 in 5+ unit buildings).
Forward outlook
- Local home prices are declining (-3.0%/yr); year-one equity from $864 of loan paydown is wiped out by about $4k of value loss. Plan a longer hold.
- Hampshire County population projected at +5% by 2050 — modest demand growth; plan on rents tracking national, not racing it.
- At projected returns (-3.0% appreciation + 3.0% rent growth), your $35k cash investment doubles in ~9 years — after that, you're playing with house money.
Negotiation context
- It's been on market 129 days — a 12% lower offer ($110k) is reasonable based on typical stale-listing flexibility.
Questions for the listing agent
- It's been on market 129 days. Have you received any prior offers? Is the seller open to a 12% concession, seller financing, or rate buy-down credit?
- Have any recent inspections been done? Can we get a copy of the seller's disclosures and any deferred-maintenance estimates?
- What does the HOA fee cover, when was the last increase, and are there any pending special assessments or reserve-fund shortfalls?
- Why hasn't it sold? Are there any deal-killer items the seller is aware of (foundation, flood, title, zoning, code violations)?
- Is there a deadline driving the sale (1031 exchange, divorce, estate, relocation)? That informs how much negotiation room exists.
- What's the average days-on-market for RENTAL listings here right now (not sales)? A rising rental-DOM trend means longer vacancies and softer asking-rent achievability than the comps imply.
- What's the recent tenant-quality profile in this submarket — average credit score on applications, eviction rate, late-payment / NSF rate, and stable-employment percentage? A property-management company in the area should have these aggregated.
- How much new for-sale + rental construction is in the pipeline within 1–3 miles? Heavy new supply typically softens prices + rents 12–24 months out; constrained supply supports both.
Investment metrics
- 1% rule
- 1.63% ✓
- Cap rate
- 10.31%
- Cash-on-cash
- 14.33%
- DSCR
- 1.64
- GRM
- 5.1
CMA / ARV
No comps found within radius.
Projected returns pro-forma
-3.0% appreciation · 3.0% rent growth · sell at horizon
- IRR
- 4.9%
- Equity multiple
- 1.19×
- Total profit
- $6,599
- Equity at exit
- $18,638
- IRR
- 14.4%
- Equity multiple
- 2.17×
- Total profit
- $40,978
- Equity at exit
- $10,808
Cash invested: $35,000 (down + closing). Projections, not guarantees.
Landlord ↔ Tenant lean methodology
- Overall (STATE)
- 20 Strongly Tenant-Friendly
- State Massachusetts
- 20 Strongly Tenant-Friendly · D+15
- County
- — inherits STATE
- City
- — inherits STATE
ZIP-level market 01007
- Home prices YoY
- -28.1%
- Active inventory
- 55
- Price-to-rent
- 5.1×
Monthly cashflow live
- Estimated rent
- $2,043 medium interval (Pro) →
- Mortgage (P&I)
- −$656
- Tax est. 1.5%
- −$156 /mo · $1,875/yr
- Insurance
- −$52
- HOA
- −$332
- Vacancy / Maint / Mgmt
- −$429
- Net cashflow
- $418
Break-even live
UW: 25.0% down · 7.5% · 30yr · 1.5% tax · 5.0% vac · 8.0% maint · 8.0% mgmt
Financing live
Cash to close
- Down payment
- $31,250
- Closing costs
- $3,750
- Reserves months
- —
- Total cash needed
- —
Loan-product check · same deal, 3 products live
Conventional
25% down · 7.5% · 30yr
- Down + closing
- —
- Monthly P&I
- —
- Monthly cashflow
- —
- DSCR
- —
- Eligible?
- —
Personal DTI + credit; lowest rate.
DSCR
20% down · 8.5% · 30yr
- Down + closing
- —
- Monthly P&I
- —
- Monthly cashflow
- —
- DSCR
- —
- Eligible?
- —
No personal income docs; deal must DSCR.
Hard money
10% down · 12.0% · 12mo
- Down + closing
- —
- Monthly P&I
- —
- Monthly cashflow
- —
- DSCR
- —
- Eligible?
- —
Short-term bridge; refi at stabilization.
HOA detail
- Monthly dues
- $332 · $3,984/yr
Listing history 17 events
-
2026-06-18days on market $125,000 Active 129 DOM
-
2026-06-17days on market $125,000 Active 128 DOM
-
2026-06-16days on market $125,000 Active 127 DOM
-
2026-06-15days on market $125,000 Active 126 DOM
-
2026-06-14days on market $125,000 Active 124 DOM
-
2026-06-10days on market $125,000 Active 121 DOM
-
2026-06-09days on market $125,000 Active 120 DOM
-
2026-06-08days on market $125,000 Active 119 DOM
-
2026-06-07days on market $125,000 Active 118 DOM
-
2026-06-05days on market $125,000 Active 115 DOM
-
2026-06-03days on market $125,000 Active 114 DOM
-
2026-06-02days on market $125,000 Active 113 DOM
-
2026-06-01days on market $125,000 Active 112 DOM
-
2026-05-31days on market $125,000 Active 111 DOM
-
2026-05-30days on market $125,000 Active 110 DOM
-
2026-04-27price $125,000 785-char remark
Show marketing remark (785 chars)
Located in a desirable 55+ community, this well-maintained mobile home is a fantastic option for comfortable downsizing. Offering 700 square feet of thoughtfully designed living space, the open floor plan makes the home feel larger and more spacious than expected. Situated on the Springfield Street side of the park, the location provides easy access in and out of the community for added convenience.The home features a unique man-made rock front that adds curb appeal and sets it apart from others in the park. Inside, the primary bedroom offers generous space along with ample built-in storage. The home has been well cared for and can be sold partially furnished, making for an easy and seamless move. Efficient, inviting, and full of charm—this home is ready to be enjoyed.
-
2026-02-09$140,000 New 785-char remark
Show marketing remark (785 chars)
Located in a desirable 55+ community, this well-maintained mobile home is a fantastic option for comfortable downsizing. Offering 700 square feet of thoughtfully designed living space, the open floor plan makes the home feel larger and more spacious than expected. Situated on the Springfield Street side of the park, the location provides easy access in and out of the community for added convenience.The home features a unique man-made rock front that adds curb appeal and sets it apart from others in the park. Inside, the primary bedroom offers generous space along with ample built-in storage. The home has been well cared for and can be sold partially furnished, making for an easy and seamless move. Efficient, inviting, and full of charm—this home is ready to be enjoyed.
ⓘ Source: listings_history table (triggers on properties + properties_extension) + one-shot
backfill from property_details.listing_events for pre-trigger history.
Nearby sold comps map
Loading sold comps map…
Walkable amenities ~0.75 mi
Loading nearby amenities…
Taxation est. · year 1
- Rental income
- $24,513
- − Mortgage interest
- −$7,002
- − Property taxes
- −$1,875
- − Insurance
- −$625
- − Repairs & maintenance
- −$1,961
- − Management
- −$1,961
- − HOA
- −$3,984
- − Depreciation
- −$3,636
- Taxable income
- $3,469
- Est. tax owed @ 24.0%
- −$833
- After-tax cash flow
- $4,183/yr
For passive investors: Depreciation is non-cash, so a rental often shows a tax loss while cash-flowing — sheltering income. Rental losses are passive: they offset passive income freely, and up to $25,000/yr can offset ordinary (W-2) income if you actively participate and your MAGI is under $100k (phasing out to $0 by $150k); unused losses carry forward. On sale, claimed depreciation is recaptured at up to 25%, and gains may owe capital-gains tax (a 1031 exchange can defer both). Figures are a year-1 estimate at your 24.0% rate — not tax advice; consult a CPA.
Condition & rehab AI · 1 photo
This manufactured home requires extensive repairs and maintenance, including roof, driveway, foundation, siding, and landscaping. Significant structural and aesthetic issues need addressing to improve its value.
Repairs flagged
- Major roof — Significant damage with visible leaks and missing shingles.
- Major driveway — Large potholes and cracks.
- Major foundation — Visible cracks and settling.
- Major siding — Peeling and missing sections.
- Major landscaping — Bare patches and overgrown areas.
- Major driveway — Large potholes and cracks.
- Major foundation — Visible cracks and settling.
- Major siding — Peeling and missing sections.
- Major landscaping — Bare patches and overgrown areas.
- Major driveway — Large potholes and cracks.
- Major foundation — Visible cracks and settling.
- Major siding — Peeling and missing sections.
- Major landscaping — Bare patches and overgrown areas.
Value-add opportunities
- Both repair and replace roof — Fixing the roof will prevent further water damage and improve the home's appearance.
- Both repair and replace driveway — A repaired driveway will improve the home's curb appeal and functionality.
- Both repair and replace foundation — Stabilizing the foundation will prevent further structural damage and improve the home's value.
- Both repair and replace siding — A repaired and replaced siding will improve the home's appearance and energy efficiency.
- Both repair and replace landscaping — A well-maintained landscape will improve the home's curb appeal and increase its value.
Renovation cost estimate screening
| Repair item | Severity | Est. cost |
|---|---|---|
| roof · Significant damage with visible leaks and missing shingles. | Major | $15,000–50,000 |
| driveway · Large potholes and cracks. | Major | $15,000–50,000 |
| foundation · Visible cracks and settling. | Major | $15,000–50,000 |
| siding · Peeling and missing sections. | Major | $15,000–50,000 |
| landscaping · Bare patches and overgrown areas. | Major | $15,000–50,000 |
| driveway · Large potholes and cracks. | Major | $15,000–50,000 |
| foundation · Visible cracks and settling. | Major | $15,000–50,000 |
| siding · Peeling and missing sections. | Major | $15,000–50,000 |
| landscaping · Bare patches and overgrown areas. | Major | $15,000–50,000 |
| driveway · Large potholes and cracks. | Major | $15,000–50,000 |
| foundation · Visible cracks and settling. | Major | $15,000–50,000 |
| siding · Peeling and missing sections. | Major | $15,000–50,000 |
| landscaping · Bare patches and overgrown areas. | Major | $15,000–50,000 |
| Total estimated repair cost · 13 items | $195,000–650,000 |
Value-add ROI direction
- Both repair and replace roof — Fixing the roof will prevent further water damage and improve the home's appearance. ↑
- Both repair and replace driveway — A repaired driveway will improve the home's curb appeal and functionality. ↑
- Both repair and replace foundation — Stabilizing the foundation will prevent further structural damage and improve the home's value. ↑
- Both repair and replace siding — A repaired and replaced siding will improve the home's appearance and energy efficiency. ↑
- Both repair and replace landscaping — A well-maintained landscape will improve the home's curb appeal and increase its value. ↑
ⓘ Cost ranges are severity-bucket heuristics (US national rule-of-thumb). Get contractor quotes + a written scope before underwriting a rehab budget.
Schools (NCES district)
- District
- Belchertown
- NCES district ID
- 2502430
- Math proficiency
- 35% ▼ -9.00%
- Reading proficiency
- 49% ▲ 2.00%
- Median HH income
- $77,349
- Composite
- 38.71/100
- National rank
- #4136
- State rank
- #176 of 302 in MA
Livability — Belchertown
- Score
- 77/100
- State rank
- #56
- US rank
- #2946
Category grades
Schools grade is shown separately in the Schools card above.
Census & demographics
- Census place
- Belchertown, MA
- County
- Hampshire County · 76,035 people
- City population
- 15,419
- Metro
- Springfield, MA
- Population (ZIP)
- 15,419
- Household income
- $108,125
- Rent vs Own
- Severe rent burden
- 191.0
Population outlook (Hampshire County) Hauer SSP2
- Today (2025)
- 166,577 people
- By 2030
- 168,928 · +1.4%
- By 2040
- 171,197 · +2.8%
- By 2050
- 175,542 · +5.4%
- By 2075
- 199,884 · +20.0%
- By 2100
- 211,819 · +27.2%
Race, ethnicity, and origin ACS 2023
- Neighborhood character
- Predominantly White (85%)
- Race & ethnicity
- White 85% Hispanic / Latino 6% Two or more races 5% Asian 3% Black 2%
- Hispanic origin (detail)
- Mexican 2% Puerto Rican 2%
- Common ancestry
- Lithuanian 14% Romanian 14% Italian 3%
- Foreign-born
- 5% · China, Canada
- Languages at home
- 91% English-only · Spanish 4% French/Haitian/Cajun 2% Other Asian/Pacific 1%
Political lean MEDSL · Hampshire
- 2024 margin
- Solid D (+41.9) · D 69.5% · R 27.6% · Other 2.9%
- 2008→2024 swing
- -3.6pp toward R · 2008: 45.6pp · 2024: 41.9pp
- All cycles
- 2024: D+41.9 2020: D+46.8 2016: D+39.5 2012: D+43.8 2008: D+45.6
Not yet ingested
- Civics
- —
Market trends
- HPI YoY
- ▼ -107.42%
- Current HPI
- 274.6244
- Rent YoY
- —
- Metro
- Springfield, MA
- State GDP YoY
- ▲ 2.28%
- F500 in state
- 38
Industry mix (Fortune 500 HQ in MA)
| Industry | F500 HQs | Revenue |
|---|---|---|
| Technology | 3 | $17B |
|
||
| Insurance | 2 | $84B |
|
||
| Retail | 2 | $76B |
|
||
| Life Sciences | 1 | $43B |
|
||
| Energy Technology | 1 | $31B |
|
||
| Aerospace / Defense | 1 | $18B |
|
||
Price history
-10.7% since first listed2 events — show timeline
- 2026-04-27 Price Changed $125,000 MLS PIN
- 2026-02-09 Listed $140,000 MLS PIN
Cash-flow waterfall
monthlySold comps — $/sqft
last 12 mo · ≤1 miLoading sold comps…