Cleburne St · Houston, TX
Flood risk No data
- FEMA flood zone
- —
- Chance of flooding over 30 yrs
- —
- Est. flood insurance / yr
- —
Fire risk No data
- Est. fire insurance / yr
- —
Heat risk No data
- Hot days now (above threshold)
- —
- Hot days in 30 yrs
- —
Wind risk No data
- Chance of severe wind over 30 yrs
- —
Air-quality risk No data
- Unhealthy air days now
- —
- Unhealthy air days in 30 yrs
- —
Risk factors via First Street. Map © Google.
Why this score? — see what drove the F grade
The composite is a weighted blend of 9 inputs, each scored 0–100. Each bar is that input's sub-score; the figure is the points it added to the 100-point composite (weight × sub-score).
- Livability +3.7/5.0
- Schools +2.7/10.0
- Condition / age +2.5/5.0
- Rent growth +2.4/5.0
- Cash flow +2.2/30.0
- 1% rule +0.0/10.0
- DSCR +0.0/10.0
- ARV discount +0.0/15.0
- Appreciation +0.0/10.0
$850,000
🖨 Deal sheet (PDF) 📄 Offer letter ✓ Due diligence
Listing remarks MLS
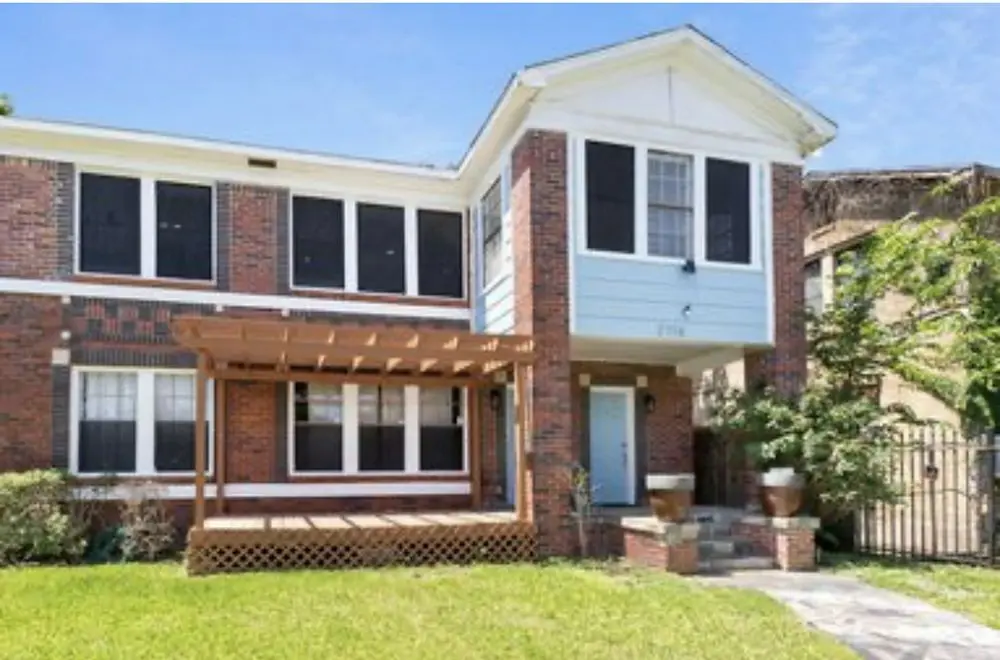
Beautifully remodeled home featuring elegant charm and hardwood floors throughout. Move-in ready with timeless appeal and modern updates. Owning a duplex in Third Ward aligns with my personal and entrepreneurial values its a property that supports community, creates housing opportunities, and generates revenue in a way thats both stable and scalable. Its not just about rent checks; iitsabout building sustainable enterprise around real estate that serves people and serves profit. Offer to owner finance with down payment of equity .
Key facts
- 4,950 sq ft lot
- Built 1945
- Listed 135 days
Neighborhood map
What this means for you Summary
Snapshot
- This is a 10-bed/6.0-bath land listed at $850k.
Deal economics
- At list price, monthly cash flow is $-3k ($-37k/yr) — negative.
- To cash-flow at today's rent, offer at most $307k (63.9% below list).
- To meet the 1% rule (rent ≥ 1% of price), the offer needs to be $257k (69.8% below list).
- Recommended offer: $257k (69.8% below list) — sets the bar for 1% rule.
- Cap rate 2.0% vs local median 3.2% in Houston — below-typical yield; the buyer is paying a premium for something (appreciation thesis, condition, location) that the cap rate doesn't capture.
Location & tenants
- Location reads 74/100 on livability (#184 in TX, #4,771 nationally) — a middle-class / working-renter tenant base. Strengths: amenities A+, cost of living A+, housing A+; Watch: crime F.
- Houston ISD (urban): math 27% / reading 35% proficiency, ranked #593 of 826 in TX (top 72%) — families likely to look elsewhere, expect single-tenant / working-renter base with shorter leases; 71% free/reduced lunch — lower-income household profile, screen leases tightly.
- Zoned schools: Gregory-Lincoln Ed Ctr (math 14% / reading 30%, grade F, #3,333 of 4,322 statewide, top 80%, 600 students, 93% FRL); Lamar H S (math 38% / reading 65%, grade D+, #478 of 1,632 statewide, top 29%, 3,125 students, 49% FRL) — zoned schools at 71% FRL track the district average.
- Market conditions: Rents soft (-0.3%/yr); 585 active listings in the ZIP; 29,883 units permitted in Harris County in 2024 (8,621 in 5+ unit buildings).
- This rent runs 43% of the median local income ($71k/yr) — at the standard rent-burdened threshold; future hikes will face affordability resistance.
Forward outlook
- Local home prices are declining (-3.0%/yr); year-one equity from $6k of loan paydown is wiped out by about $26k of value loss. Plan a longer hold.
- Harris County population projected at +47% by 2050 — long-run rental-demand tailwind backs the buy-and-hold thesis.
Negotiation context
- It's been on market 135 days — a 12% lower offer ($748k) is reasonable based on typical stale-listing flexibility.
- 3 sale attempts since 20y ago; this cycle's ask is 89% above the opening price — seller raised mid-cycle; expect resistance to lowballs.
Risks & watch-outs
- Watch-outs: built in 1945 — expect roof / HVAC / electrical / plumbing capex.
Questions for the listing agent
- What do current leases actually rent for vs. the listed asking? Can we see a recent rent roll and the last 12 months of T-12 income?
- It's been on market 135 days. Have you received any prior offers? Is the seller open to a 70% concession, seller financing, or rate buy-down credit?
- Built in 1945 — when were the roof, HVAC, electrical panel, plumbing, and water heater last replaced?
- Why hasn't it sold? Are there any deal-killer items the seller is aware of (foundation, flood, title, zoning, code violations)?
- Is there a deadline driving the sale (1031 exchange, divorce, estate, relocation)? That informs how much negotiation room exists.
- Schools are D-rated, which usually means shorter tenancies and higher turnover. Who's the typical renter profile here, and what's been the actual vacancy rate?
- Crime grade is F in this area — have there been break-ins, vandalism, or insurance claims at this property in the last 3 years? What carrier currently insures it and at what premium?
- The area grade is low — what's the realistic commute time and amenity access for the typical tenant pool here? Any planned neighborhood developments (good or bad) we should know about?
- What's the average days-on-market for RENTAL listings here right now (not sales)? A rising rental-DOM trend means longer vacancies and softer asking-rent achievability than the comps imply.
- What's the recent tenant-quality profile in this submarket — average credit score on applications, eviction rate, late-payment / NSF rate, and stable-employment percentage? A property-management company in the area should have these aggregated.
- How much new for-sale + rental construction is in the pipeline within 1–3 miles? Heavy new supply typically softens prices + rents 12–24 months out; constrained supply supports both.
Investment metrics
- 1% rule
- 0.30% ✗
- Cap rate
- 1.95%
- Cash-on-cash
- -15.50%
- DSCR
- 0.31
- GRM
- 27.6
CMA / ARV
- ARV (median comp)
- $713,479
- List price
- $850,000
- Delta
- 19.13%
- Verdict
- OVERPRICED
- Comps
- 20 within 1.0 mi
Projected returns pro-forma
-3.0% appreciation · 0.0% rent growth · sell at horizon
- IRR
- -48.6%
- Equity multiple
- -0.43×
- Total profit
- $-341,499
- Equity at exit
- $126,738
- IRR
- —
- Equity multiple
- -1.44×
- Total profit
- $-580,345
- Equity at exit
- $73,492
Cash invested: $238,000 (down + closing). Projections, not guarantees.
Landlord ↔ Tenant lean methodology
- Overall (STATE)
- 87 Strongly Landlord-Friendly
- State Texas
- 87 Strongly Landlord-Friendly · R+5
- County
- — inherits STATE
- City
- — inherits STATE
ZIP-level market 77004
- Rents YoY
- -0.3%
- Active inventory
- 585
- Price-to-rent
- 27.6×
Monthly cashflow live
- Estimated rent
- $2,568 medium interval (Pro) →
- Mortgage (P&I)
- −$4,457
- Tax from tax record
- −$291 /mo · $3,492/yr
- Insurance
- −$354
- HOA
- −$0
- Vacancy / Maint / Mgmt
- −$539
- Net cashflow
- $-3,074
Break-even live
Sensitivity live
| Price | -10% $-2,593 | -5% $-2,834 | +0% $-3,074 | +5% $-3,315 | +10% $-3,555 |
|---|---|---|---|---|---|
| Rent | -10% $-3,277 | -5% $-3,176 | +0% $-3,074 | +5% $-2,973 | +10% $-2,871 |
| Rate | -1.0pp $-2,646 | -0.5pp $-2,858 | base $-3,074 | +0.5pp $-3,295 | +1.0pp $-3,519 |
UW: 25.0% down · 7.5% · 30yr · 1.5% tax · 5.0% vac · 8.0% maint · 8.0% mgmt
Financing live
Cash to close
- Down payment
- $212,500
- Closing costs
- $25,500
- Reserves months
- —
- Total cash needed
- —
Loan-product check · same deal, 3 products live
Conventional
25% down · 7.5% · 30yr
- Down + closing
- —
- Monthly P&I
- —
- Monthly cashflow
- —
- DSCR
- —
- Eligible?
- —
Personal DTI + credit; lowest rate.
DSCR
20% down · 8.5% · 30yr
- Down + closing
- —
- Monthly P&I
- —
- Monthly cashflow
- —
- DSCR
- —
- Eligible?
- —
No personal income docs; deal must DSCR.
Hard money
10% down · 12.0% · 12mo
- Down + closing
- —
- Monthly P&I
- —
- Monthly cashflow
- —
- DSCR
- —
- Eligible?
- —
Short-term bridge; refi at stabilization.
Listing history 18 events
-
2026-06-21days on market $850,000 Active 135 DOM
-
2026-06-18days on market $850,000 Active 132 DOM
-
2026-06-17days on market $850,000 Active 131 DOM
-
2026-06-16days on market $850,000 Active 130 DOM
-
2026-06-15days on market $850,000 Active 129 DOM
-
2026-06-13days on market $850,000 Active 127 DOM
-
2026-06-10days on market $850,000 Active 123 DOM
-
2026-06-08days on market $850,000 Active 122 DOM
-
2026-06-07days on market $850,000 Active 121 DOM
-
2026-06-04pricedays on market $850,000 Active 118 DOM
-
2026-06-01days on market $450,000 Active 115 DOM
-
2026-05-31days on market $450,000 Active 114 DOM
-
2026-02-06$450,000 Active 539-char remark
Show marketing remark (539 chars)
Beautifully remodeled home featuring elegant charm and hardwood floors throughout. Move-in ready with timeless appeal and modern updates. Owning a duplex in Third Ward aligns with my personal and entrepreneurial values its a property that supports community, creates housing opportunities, and generates revenue in a way thats both stable and scalable. Its not just about rent checks; iitsabout building sustainable enterprise around real estate that serves people and serves profit. Offer to owner finance with down payment of equity .
-
2010-12-31historical
-
2009-12-11$157,500
-
2007-05-24historical
-
2006-11-28$180,000
-
1988-01-02soldstatus
ⓘ Source: listings_history table (triggers on properties + properties_extension) + one-shot
backfill from property_details.listing_events for pre-trigger history.
Tax reassessment forecast TX · Resets to sale price
- Current annual tax
- $3,492 · $291/mo
- Projected year-2 tax
- $15,555 · $1,296/mo
- Expected delta
- +$12,063/yr (+$1,005/mo · 345.5%)
ⓘ Screening estimate from a state-policy table — verify with the county assessor before closing.
Nearby sold comps map
Loading sold comps map…
Walkable amenities ~0.75 mi
Loading nearby amenities…
Taxation est. · year 1
- Rental income
- $30,811
- − Mortgage interest
- −$47,613
- − Property taxes
- −$3,492
- − Insurance
- −$4,250
- − Repairs & maintenance
- −$2,465
- − Management
- −$2,465
- − Depreciation
- −$24,727
- Taxable loss
- −$54,201
- Est. tax savings @ 24.0%
- +$13,008
- After-tax cash flow
- $-23,883/yr
For passive investors: Depreciation is non-cash, so a rental often shows a tax loss while cash-flowing — sheltering income. Rental losses are passive: they offset passive income freely, and up to $25,000/yr can offset ordinary (W-2) income if you actively participate and your MAGI is under $100k (phasing out to $0 by $150k); unused losses carry forward. On sale, claimed depreciation is recaptured at up to 25%, and gains may owe capital-gains tax (a 1031 exchange can defer both). Figures are a year-1 estimate at your 24.0% rate — not tax advice; consult a CPA.
Schools (NCES district)
- District
- Houston ISD
- NCES district ID
- 4823640
- Math proficiency
- 27% ▼ -18.00%
- Reading proficiency
- 35% ▼ -6.00%
- Median HH income
- $46,054
- Composite
- 26.63/100
- National rank
- #7173
- State rank
- #593 of 826 in TX
Livability — Houston
- Score
- 74/100
- State rank
- #184
- US rank
- #4771
Category grades
Schools grade is shown separately in the Schools card above.
Census & demographics
- Census place
- Houston, TX
- County
- Harris County · 4,702,590 people
- City population
- 3,226,434
- Metro
- Houston-The Woodlands-Sugar Land, TX
- Population (ZIP)
- 35,997
- Household income
- $71,199
- Rent vs Own
- Severe rent burden
- 3072.0
Population outlook (Harris County) Hauer SSP2
- Today (2025)
- 5,571,493 people
- By 2030
- 6,089,821 · +9.3%
- By 2040
- 7,142,806 · +28.2%
- By 2050
- 8,185,864 · +46.9%
- By 2075
- 10,574,329 · +89.8%
- By 2100
- 12,109,958 · +117.4%
Race, ethnicity, and origin ACS 2023
- Neighborhood character
- Diverse neighborhood (Simpson 0.68)
- Race & ethnicity
- Black 48% White 27% Hispanic / Latino 13% Two or more races 11% Asian 8%
- Hispanic origin (detail)
- Mexican 9%
- Common ancestry
- Lithuanian 1% Romanian 1% Italian 1%
- Foreign-born
- 14% · Canada, China, South Korea
- Languages at home
- 82% English-only · Spanish 10% Chinese 2% Other Indo-European 2%
Political lean MEDSL · Harris
- 2024 margin
- Lean D (+5.5) · D 52.0% · R 46.4% · Other 1.6%
- 2008→2024 swing
- +3.9pp toward D · 2008: 1.6pp · 2024: 5.5pp
- All cycles
- 2024: D+5.5 2020: D+13.3 2016: D+12.4 2012: D+0.1 2008: D+1.6
Not yet ingested
- Civics
- —
Market trends
- HPI YoY
- ▼ -139.34%
- Current HPI
- 199.6066
- Rent YoY
- ▼ -0.32%
- Metro
- Houston-The Woodlands-Sugar Land, TX
- State GDP YoY
- ▲ 3.95%
- F500 in state
- 110
Industry mix (Fortune 500 HQ in TX)
| Industry | F500 HQs | Revenue |
|---|---|---|
| Energy | 16 | $1,198B |
|
||
| Technology | 5 | $198B |
|
||
| Engineering / Construction | 4 | $72B |
|
||
| Energy Services | 3 | $60B |
|
||
| Utilities | 3 | $41B |
|
||
| Healthcare | 2 | $330B |
|
||
Price history
+150.0% since first listed6 events — show timeline
- 2026-02-06 Listed $450,000 ForSaleByOwner.com
- 2010-12-31 Listing Removed — HARMLS
- 2009-12-11 Listed $157,500 HARMLS
- 2007-05-24 Listing Removed — HARMLS
- 2006-11-28 Listed $180,000 HARMLS
- 1988-01-02 Sold (Public Records) — Public Records
Property tax history
-0.5%/yrLatest (2025): $3,492 · +1.5% YoY. Source: county tax records.
Cash-flow waterfall
monthlySold comps — $/sqft
last 12 mo · ≤1 miLoading sold comps…