 Duplex
97-19 87th St · New York, NY
Flood risk 1/10 · Minimal
- FEMA flood zone
- X (unshaded)
- Chance of flooding over 30 yrs
- 0.0%
- Est. flood insurance / yr
- $507 – $1,088
Fire risk 1/10 · Minimal
- Est. fire insurance / yr
- $691 – $1,283
Heat risk 7/10 · Major
- Hot days now (above 99°F)
- 7 days/yr
- Hot days in 30 yrs
- 15 days/yr
Wind risk 6/10 · Moderate
- Chance of severe wind over 30 yrs
- 50.0%
Air-quality risk 5/10 · Moderate
- Unhealthy air days now
- 6 days/yr
- Unhealthy air days in 30 yrs
- 8 days/yr
Risk factors via First Street. Map © Google.
Why this score? — see what drove the D+ grade
The composite is a weighted blend of 9 inputs, each scored 0–100. Each bar is that input's sub-score; the figure is the points it added to the 100-point composite (weight × sub-score).
- ARV discount +15.0/15.0
- Cash flow +13.3/30.0
- Schools +5.0/10.0
- DSCR +4.0/10.0
- Livability +3.8/5.0
- 1% rule +3.0/10.0
- Rent growth +2.5/5.0
- Condition / age +2.5/5.0
- Appreciation +0.0/10.0
$825,000
🖨 Deal sheet 📄 Offer letter ✓ Due diligence
Multi-family units
County records classify this as Multi-Family (2-4 Unit). Listing-text estimate: 2 units. confirmed
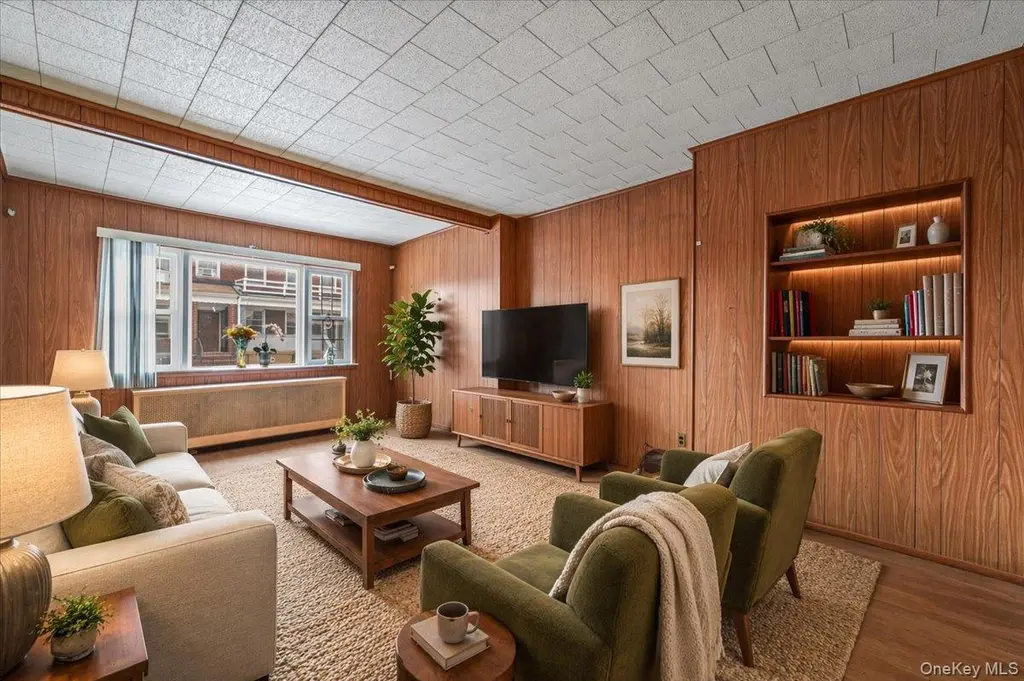
Listing remarks
This spacious two-family home is ideal for both investors and owner-occupants, offering exceptional value and versatility. Featuring three bedrooms on the first floor and three bedrooms on the second, along with a finished basement and a lot of storage space. The property also offers a beautiful, large backyard, perfect for outdoor enjoyment or entertaining. Conveniently located with close proximity to local schools, including P. S. 232 elementary school and John Adams High School, JFK airport as well as public transportation including the A train, grocery stores, parks, and everyday amenities. A fantastic opportunity at a great price! * Please note that select images have been digitally
Key facts
- Grocery stores
- Large backyard
- Finished basement
Tags
Property features AI
Exterior
- Parking: No carport; No designated parking
- Utilities: Public sewer; Electricity connected; Natural gas connected; Public water connected; Trash collection (public)
- Home design: Duplex
- Construction: Frame construction
- Exterior features: Frame construction; Not on the waterfront
Interior
- Bedrooms: One 3-bedroom unit
- Bathrooms: 2 full bathrooms
- Heating & cooling: Natural gas heating; No central cooling
- Interior features: Washer/dryer hookup; Common laundry area; Laundry room in basement
- Laundry & utility: Common area laundry; Basement laundry room
Neighborhood map
What this means for you Summary
Snapshot
- This is a 2 × 3-bed/1.0-bath units multifamily listed at $825k.
Deal economics
- At list price, monthly cash flow is $-2 ($-26/yr) — negative. Per door: $-1/mo.
- To cash-flow at today's rent, offer at most $825k (0.0% below list).
- To meet the 1% rule (rent ≥ 1% of price), the offer needs to be $658k (20.3% below list).
- Recommended offer: $658k (20.3% below list) — sets the bar for 1% rule.
- Cap rate 6.3% vs local median 2.6% in New York — top-decile yield for the area; either an underpriced asset or a hidden risk that comps aren't pricing in. Stress-test before assuming the spread holds.
Location & tenants
- Location reads 75/100 on livability (#268 in NY, #4,188 nationally) — a middle-class / working-renter tenant base. Strengths: amenities A+, commute A+, health & safety A; Watch: crime F, cost of living F.
- Market conditions: 55 active listings in the ZIP; 5,302 units permitted in Queens County in 2024 (4,918 in 5+ unit buildings).
Forward outlook
- Local home prices are declining (-3.0%/yr); year-one equity from $6k of loan paydown is wiped out by about $25k of value loss. Plan a longer hold.
- Queens County population projected at +16% by 2050 — long-run rental-demand tailwind backs the buy-and-hold thesis.
Negotiation context
- It's been on market 28 days — a 2% lower offer ($813k) is reasonable based on typical stale-listing flexibility.
- Current owner paid $175k; list at $825k implies a 371% gain — meaningful room to come down on a strong offer.
Risks & watch-outs
- Watch-outs: built in 1930 — expect roof / HVAC / electrical / plumbing capex.
- Climate carrying-cost: major wind risk, 50% chance of damaging wind over 30y; extreme-heat days projected 7→15/yr by 2055 (HVAC capex compounding) — expect insurance premiums to compound above CPI over the hold.
Questions for the listing agent
- What do current leases actually rent for vs. the listed asking? Can we see a recent rent roll and the last 12 months of T-12 income?
- Can we see the unit-by-unit rent roll, current vacancy, and any below-market leases? What's the average tenancy length?
- What capital expenditures (roof, boiler, parking lot, exteriors) have been made in the last 5 years, and what's planned in the next 2?
- Built in 1930 — when were the roof, HVAC, electrical panel, plumbing, and water heater last replaced?
- Is there a deadline driving the sale (1031 exchange, divorce, estate, relocation)? That informs how much negotiation room exists.
- Schools are B-rated — typically a magnet for longer-tenancy family renters. What's the average tenant stay here, and is there a school-zone premium baked into asking?
- Crime grade is F in this area — have there been break-ins, vandalism, or insurance claims at this property in the last 3 years? What carrier currently insures it and at what premium?
- The area grade is low — what's the realistic commute time and amenity access for the typical tenant pool here? Any planned neighborhood developments (good or bad) we should know about?
- What's the average days-on-market for RENTAL listings here right now (not sales)? A rising rental-DOM trend means longer vacancies and softer asking-rent achievability than the comps imply.
- What's the recent tenant-quality profile in this submarket — average credit score on applications, eviction rate, late-payment / NSF rate, and stable-employment percentage? A property-management company in the area should have these aggregated.
- How much new apartment / multifamily construction is in the pipeline within 1–3 miles? Heavy new supply (>2% of stock underway) typically softens rents 12–24 months out; light construction supports rent growth.
Investment metrics
- 1% rule
- 0.80% ✗
- Cap rate
- 6.29%
- Cash-on-cash
- -0.01%
- DSCR
- 1.00
- GRM
- 10.5
CMA / ARV
- ARV (on-the-fly)
- $1,032,120
- Comps found
- 12
Show comp detail 12 sales within ~0.75 mi
| Address | Dist | Beds/Ba | Sqft | Sold | Price | $/sf | Match |
|---|---|---|---|---|---|---|---|
| 80-60 90 Ave | 0.44mi | 5/2.0 (-1) | 1,848 (-2%) | 2mo | $875,000 | $473 | 70 |
| 95-15 84 St | 0.16mi | 6/3.0 | 1,684 (-10%) | 2mo | $1,050,000 | $624 | 69 |
| 10109 97th Ave | 0.64mi | 6/2.0 | 1,920 (+2%) | 1mo | $1,300,000 | $677 | 66 |
| 10118 94th St | 0.34mi | 6/2.0 | 2,096 (+12%) | 2mo | $1,150,000 | $549 | 63 |
| 91-49 86th St | 0.26mi | 6/3.0 | 2,160 (+15%) | 2mo | $1,170,000 | $542 | 57 |
| 9406 76th St | 0.54mi | 5/3.0 (-1) | 1,814 (-4%) | 4mo | $875,000 | $482 | 57 |
| 10301 97th Ave | 0.72mi | 6/3.0 | 1,944 (+3%) | 0mo | $1,100,000 | $566 | 56 |
| 9018 77th St | 0.61mi | 7/3.0 (+1) | 1,832 (-3%) | 5mo | $950,000 | $519 | 54 |
| 273 Grant Ave | 0.74mi | 6/2.0 | 2,000 (+6%) | 5mo | $997,500 | $499 | 51 |
| 9117 78th St | 0.50mi | 5/2.0 (-1) | 1,696 (-10%) | 5mo | $945,000 | $557 | 51 |
| 87-44 89 St | 0.56mi | 5/2.0 (-1) | 1,626 (-14%) | 5mo | $910,000 | $560 | 42 |
| 87-38 94th St | 0.65mi | 5/2.0 (-1) | 2,160 (+15%) | 6mo | $960,000 | $444 | 35 |
Match score weights: distance 35% · size 25% · config 20% · recency 20%. Top-matched comps best support the ARV.
Projected returns pro-forma
-3.0% appreciation · 3.0% rent growth · sell at horizon
- IRR
- -16.4%
- Equity multiple
- 0.42×
- Total profit
- $-134,034
- Equity at exit
- $123,010
- IRR
- -8.1%
- Equity multiple
- 0.49×
- Total profit
- $-117,745
- Equity at exit
- $71,331
Cash invested: $231,000 (down + closing). Projections, not guarantees.
Landlord ↔ Tenant lean methodology
- Overall (CITY)
- 0 Strongly Tenant-Friendly
- State New York
- 15 Strongly Tenant-Friendly · D+10
- County
- — inherits STATE
- City New York
- 0 Strongly Tenant-Friendly · D+34
ZIP-level market 11416
- Active inventory
- 55
- Price-to-rent
- 20.9×
Monthly cashflow live
- Estimated rent
- $6,577 high interval (Pro) →
- Mortgage (P&I)
- −$4,326
- Tax from tax record
- −$528 /mo · $6,334/yr
- Insurance
- −$344
- HOA
- −$0
- Vacancy / Maint / Mgmt
- −$1,381
- Net cashflow
- $-2
Break-even live
2-unit breakdown (identical units grouped — click to expand)
| Units | Beds | Baths | Est. rent |
|---|---|---|---|
| 2× units | 3 | 1 | $6,576 |
| #1 | 3 | 1 | $3,288 |
| #2 | 3 | 1 | $3,288 |
| Total (2 units) | $6,577 | ||
UW: 25.0% down · 7.5% · 30yr · 1.5% tax · 5.0% vac · 8.0% maint · 8.0% mgmt
Financing live
Cash to close
- Down payment
- $206,250
- Closing costs
- $24,750
- Reserves months
- —
- Total cash needed
- —
Loan-product check · same deal, 3 products live
Conventional
25% down · 7.5% · 30yr
- Down + closing
- —
- Monthly P&I
- —
- Monthly cashflow
- —
- DSCR
- —
- Eligible?
- —
Personal DTI + credit; lowest rate.
DSCR
20% down · 8.5% · 30yr
- Down + closing
- —
- Monthly P&I
- —
- Monthly cashflow
- —
- DSCR
- —
- Eligible?
- —
No personal income docs; deal must DSCR.
Hard money
10% down · 12.0% · 12mo
- Down + closing
- —
- Monthly P&I
- —
- Monthly cashflow
- —
- DSCR
- —
- Eligible?
- —
Short-term bridge; refi at stabilization.
Listing history 3 events
-
2026-05-20status Pending
-
2026-04-21$825,000 Active
-
1995-10-30soldstatus $175,000
ⓘ Source: listings_history table (triggers on properties + properties_extension) + one-shot
backfill from property_details.listing_events for pre-trigger history.
Tax reassessment forecast NY · Partial reset (capped growth)
- Current annual tax
- $6,334 · $528/mo
- Projected year-2 tax
- $10,138 · $845/mo
- Expected delta
- +$3,804/yr (+$317/mo · 60.1%)
ⓘ Screening estimate from a state-policy table — verify with the county assessor before closing.
Climate risk First Street
- Flood 1/10 Low FEMA zone X (unshaded) · 0% chance over 30 yrs
- Wildfire 1/10 Low
- Heat 7/10 Severe 7 d/yr ≥99°F today · 15 d/yr by 30 yrs out
- Wind 6/10 Major 50% chance of damaging wind over 30 yrs
- Air quality 5/10 Major 6 unhealthy d/yr today · 8 by 30 yrs out
Nearby sold comps map
Loading sold comps map…
Walkable amenities ~0.75 mi
Loading nearby amenities…
Taxation est. · year 1
- Rental income
- $78,924
- − Mortgage interest
- −$46,213
- − Property taxes
- −$6,334
- − Insurance
- −$4,125
- − Repairs & maintenance
- −$6,314
- − Management
- −$6,314
- − Depreciation
- −$24,000
- Taxable loss
- −$14,376
- Est. tax savings @ 24.0%
- +$3,450
- After-tax cash flow
- $3,424/yr
For passive investors: Depreciation is non-cash, so a rental often shows a tax loss while cash-flowing — sheltering income. Rental losses are passive: they offset passive income freely, and up to $25,000/yr can offset ordinary (W-2) income if you actively participate and your MAGI is under $100k (phasing out to $0 by $150k); unused losses carry forward. On sale, claimed depreciation is recaptured at up to 25%, and gains may owe capital-gains tax (a 1031 exchange can defer both). Figures are a year-1 estimate at your 24.0% rate — not tax advice; consult a CPA.
Schools (NCES district)
No district data.
Livability — New York
- Score
- 75/100
- State rank
- #268
- US rank
- #4188
Category grades
Schools grade is shown separately in the Schools card above.
Census & demographics
- Census place
- New York, NY
- City population
- 7,731,280
- Population (ZIP)
- 26,660
Population outlook (Queens County) Hauer SSP2
- Today (2025)
- 2,546,320 people
- By 2030
- 2,643,059 · +3.8%
- By 2040
- 2,815,563 · +10.6%
- By 2050
- 2,944,423 · +15.6%
- By 2075
- 3,123,338 · +22.7%
- By 2100
- 3,098,688 · +21.7%
Race, ethnicity, and origin ACS 2023
- Neighborhood character
- Diverse neighborhood (Simpson 0.69)
- Race & ethnicity
- Hispanic / Latino 43% Asian 33% Two or more races 17% White 12% Black 4%
- Hispanic origin (detail)
- Mexican 5% Puerto Rican 10% Dominican 11%
- Common ancestry
- Romanian 3%
- Foreign-born
- 54% · Canada, Jamaica, China
- Languages at home
- 35% English-only · Spanish 37% Other Indo-European 21% Russian/Polish/Slavic 3%
Political lean MEDSL · Queens
- 2024 margin
- Strong D (+24.6) · D 62.3% · R 37.7%
- 2008→2024 swing
- -26.2pp toward R · 2008: 50.8pp · 2024: 24.6pp
- All cycles
- 2024: D+24.6 2020: D+45.2 2016: D+53.4 2012: D+58.5 2008: D+50.8
Not yet ingested
- Civics
- —
Market trends
- HPI YoY
- ▼ -185.71%
- Current HPI
- 274.1375
- Rent YoY
- —
- Metro
- —
- State GDP YoY
- ▲ 2.60%
- F500 in state
- 92
Industry mix (Fortune 500 HQ in NY)
| Industry | F500 HQs | Revenue |
|---|---|---|
| Financial Services | 10 | $950B |
|
||
| Consumer Goods | 9 | $162B |
|
||
| Insurance | 4 | $225B |
|
||
| Telecommunications | 2 | $144B |
|
||
| Pharmaceuticals | 2 | $112B |
|
||
| Media / Entertainment | 2 | $69B |
|
||
Price history
+371.4% since first listed3 events — show timeline
- 2026-05-20 Pending — OneKey® MLS as Distributed by MLS Grid
- 2026-04-21 Listed $825,000 OneKey® MLS as Distributed by MLS Grid
- 1995-10-30 Sold (Public Records) $175,000 Public Records
Property tax history
+5.8%/yrLatest (2025): $6,334 · +3.3% YoY. Source: county tax records.
Cash-flow waterfall
monthlySold comps — $/sqft
last 12 mo · ≤1 miLoading sold comps…