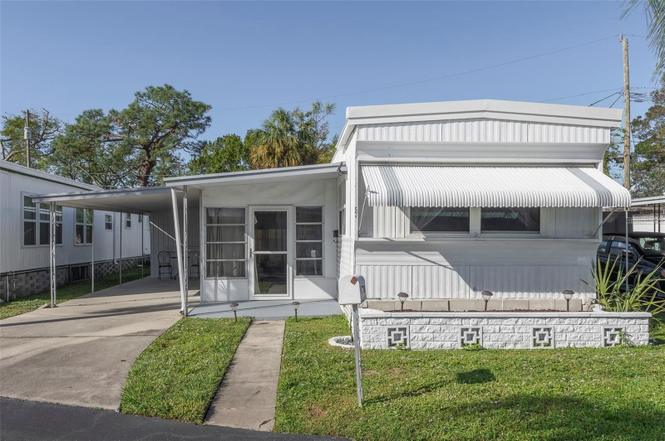
4086 72nd Way N #57 · West Lealman, FL
Flood risk 1/10 · Minimal
- FEMA flood zone
- X (unshaded)
- Chance of flooding over 30 yrs
- 0.0%
- Est. flood insurance / yr
- $507 – $1,088
Fire risk 1/10 · Minimal
- Est. fire insurance / yr
- $947 – $1,759
Heat risk 10/10 · Severe
- Hot days now (above 107°F)
- 7 days/yr
- Hot days in 30 yrs
- 25 days/yr
Wind risk 10/10 · Severe
- Chance of severe wind over 30 yrs
- 99.0%
Air-quality risk 4/10 · Minor
- Unhealthy air days now
- 4 days/yr
- Unhealthy air days in 30 yrs
- 4 days/yr
Risk factors via First Street. Map © Google.
Why this score? — see what drove the B- grade
The composite is a weighted blend of 9 inputs, each scored 0–100. Each bar is that input's sub-score; the figure is the points it added to the 100-point composite (weight × sub-score).
- Cash flow +28.0/30.0
- DSCR +9.9/10.0
- 1% rule +9.8/10.0
- ARV discount +7.5/15.0
- Schools +4.3/10.0
- Livability +4.0/5.0
- Rent growth +2.7/5.0
- Condition / age +2.5/5.0
- Appreciation +0.0/10.0
$110,000
🖨 Deal sheet 📄 Offer letter ✓ Due diligence
Listing remarks
Immaculate and move-in ready residence in a well-maintained community! This updated home boasts numerous major improvements including a new AC installed 2023, new roof installed 2024, and new luxury-style flooring installed 2021 throughout. Recent enhancements also include updated plumbing, a beautifully updated bathroom, new vapor barrier, and added insulation for comfort and efficiency. Inside, enjoy an open floor plan with bright living spaces, modern finishes, and thoughtful upgrades — perfect for comfortable everyday living. Located near shopping, dining, recreation, and major commute routes, this property offers a rare combination of turnkey condition and value. Don’t miss
Key facts
- New flooring
- New vapor barrier
- New ac
Tags
Property features AI
Finance
- Other: Furnished; No water source specified (listed as none); Public records list living area ~600 square feet and building area total ~1,246 square feet
- Financial info: Total annual fees $2,700; total monthly fees $225
- HOA & community: Magnolia Manor HOA; monthly fee $225 (includes pool and recreational facilities); Community amenities: clubhouse, laundry, pool; Senior community (55+); Pets not allowed; Full-time management
Exterior
- Parking: Carport (1 space)
- Utilities: Public sewer; Water connected; Electricity connected; Broadband/high-speed internet available
- Home design: Residential mobile home (single wide); One story; Faces northeast; Entry level: one
- Construction: Metal frame construction; Metal siding; Membrane roof; Pillar/post/pier foundation; Built on a 12.4-acre parcel (approx. 10 to less than 20 acres)
- Exterior features: Awnings; Hurricane shutters; Private mailbox; Asphalt road access
Interior
- Kitchen: Refrigerator
- Bedrooms: 2 bedrooms
- Flooring: Carpet; Laminate
- Bathrooms: 1 full bathroom
- Heating & cooling: Central heating; Central air conditioning
- Interior features: Kitchen/family room combo
- Laundry & utility: Laundry area (other)
Neighborhood map
What this means for you Summary
Snapshot
- This is a 2-bed/1.0-bath manufactured listed at $110k.
Deal economics
- At list price, monthly cash flow is $343 ($4k/yr) — positive.
- The deal already cash-flows at list — no discount required.
- Meets the 1% rule at list price ($2k rent vs $110k).
- Recommended offer: $97k (12.0% below list) — sets the bar for market timing.
- Cap rate 10.0% vs local median 1.8% in West Lealman — top-decile yield for the area; either an underpriced asset or a hidden risk that comps aren't pricing in. Stress-test before assuming the spread holds.
Location & tenants
- Location reads 81/100 on livability (#84 in FL, #1,396 nationally) — a professional / high-income tenant draw. Strengths: commute A+, cost of living A+, housing A+; Watch: employment D+, amenities F.
- Pinellas (suburban): math 51% / reading 51% proficiency, ranked #31 of 73 in FL (top 42%) — acceptable for families but not a draw, mixed tenant base, ~2y average lease.
- Zoned schools: Seventy-Fourth St. Elementary (math 30% / reading 22%, grade F, #2,015 of 2,144 statewide, top 94%, 444 students, 72% FRL); Dixie M. Hollins High School (math 30% / reading 40%, grade F, #379 of 667 statewide, top 58%, 1,822 students, 56% FRL) — zoned schools average 64% FRL vs 48% district-wide (16 pts higher); higher-poverty schools than district average — tighter screening recommended.
- Zoned-school proficiency averages 30% at this address vs 51% district-wide (-20 pts) — the specific schools serving this property underperform the Pinellas average; the district grade overstates school quality for this exact location.
- Market conditions: Rents flat; 309 active listings in the ZIP; 20 comparable units currently listed for rent nearby; rentals at typical pace (median 15d on market — plan ~3-4 weeks tenant-placement turnaround); 2,676 units permitted in Pinellas County in 2024 (1,422 in 5+ unit buildings).
- This rent runs 37% of the median local income ($54k/yr) — at the standard rent-burdened threshold; future hikes will face affordability resistance.
Forward outlook
- Local home prices are declining (-3.0%/yr); year-one equity from $761 of loan paydown is wiped out by about $3k of value loss. Plan a longer hold.
- Pinellas County population projected at +14% by 2050 — modest demand growth; plan on rents tracking national, not racing it.
Negotiation context
- It's been on market 156 days — a 12% lower offer ($97k) is reasonable based on typical stale-listing flexibility.
- 2 sale attempts since 2y ago with the ask held roughly flat each time — persistent listings suggest the price (not the market) is what's stuck; bring a comps-based counter.
- Current owner paid $25k; list at $110k implies a 342% gain — meaningful room to come down on a strong offer.
Risks & watch-outs
- Climate carrying-cost: severe wind risk, 99% chance of damaging wind over 30y; extreme-heat days projected 7→25/yr by 2055 (HVAC capex compounding) — expect insurance premiums to compound above CPI over the hold.
Questions for the listing agent
- It's been on market 156 days. Have you received any prior offers? Is the seller open to a 12% concession, seller financing, or rate buy-down credit?
- Built in 1967 — when were the roof, HVAC, electrical panel, plumbing, and water heater last replaced?
- What does the HOA fee cover, when was the last increase, and are there any pending special assessments or reserve-fund shortfalls?
- Why hasn't it sold? Are there any deal-killer items the seller is aware of (foundation, flood, title, zoning, code violations)?
- Is there a deadline driving the sale (1031 exchange, divorce, estate, relocation)? That informs how much negotiation room exists.
- What's the average days-on-market for RENTAL listings here right now (not sales)? A rising rental-DOM trend means longer vacancies and softer asking-rent achievability than the comps imply.
- What's the recent tenant-quality profile in this submarket — average credit score on applications, eviction rate, late-payment / NSF rate, and stable-employment percentage? A property-management company in the area should have these aggregated.
- How much new for-sale + rental construction is in the pipeline within 1–3 miles? Heavy new supply typically softens prices + rents 12–24 months out; constrained supply supports both.
Investment metrics
- 1% rule
- 1.48% ✓
- Cap rate
- 10.03%
- Cash-on-cash
- 13.36%
- DSCR
- 1.59
- GRM
- 5.6
CMA / ARV
- ARV (on-the-fly)
- $70,800
- Comps found
- 3
Show comp detail 3 sales within ~0.75 mi
| Address | Dist | Beds/Ba | Sqft | Sold | Price | $/sf | Match |
|---|---|---|---|---|---|---|---|
| 4235 72nd Way N #99 | 0.10mi | 2/1.5 | 588 (-2%) | 3mo | $88,000 | $150 | 88 |
| 4100 72nd Way N #56 | 0.01mi | 1/1.0 (-1) | 552 (-8%) | 13mo | $59,000 | $107 | 70 |
| 7801 34th Ave N #11 | 0.61mi | 1/1.0 (-1) | 552 (-8%) | 9mo | $65,000 | $118 | 46 |
Match score weights: distance 35% · size 25% · config 20% · recency 20%. Top-matched comps best support the ARV.
Projected returns pro-forma
-3.0% appreciation · 0.99% rent growth · sell at horizon
- IRR
- 0.8%
- Equity multiple
- 1.03×
- Total profit
- $918
- Equity at exit
- $16,401
- IRR
- 8.0%
- Equity multiple
- 1.54×
- Total profit
- $16,739
- Equity at exit
- $9,511
Cash invested: $30,800 (down + closing). Projections, not guarantees.
Landlord ↔ Tenant lean methodology
- Overall (STATE)
- 87 Strongly Landlord-Friendly
- State Florida
- 87 Strongly Landlord-Friendly · R+3
- County
- — inherits STATE
- City
- — inherits STATE
ZIP-level market 33709
- Rents YoY
- 1.0%
- Active inventory
- 309
- Price-to-rent
- 5.6×
Monthly cashflow live
- Estimated rent
- $1,631 high interval (Pro) →
- Mortgage (P&I)
- −$577
- Tax from tax record
- −$98 /mo · $1,171/yr
- Insurance
- −$46
- HOA
- −$225
- Vacancy / Maint / Mgmt
- −$342
- Net cashflow
- $343
Break-even live
UW: 25.0% down · 7.5% · 30yr · 1.5% tax · 5.0% vac · 8.0% maint · 8.0% mgmt
Financing live
Cash to close
- Down payment
- $27,500
- Closing costs
- $3,300
- Reserves months
- —
- Total cash needed
- —
Loan-product check · same deal, 3 products live
Conventional
25% down · 7.5% · 30yr
- Down + closing
- —
- Monthly P&I
- —
- Monthly cashflow
- —
- DSCR
- —
- Eligible?
- —
Personal DTI + credit; lowest rate.
DSCR
20% down · 8.5% · 30yr
- Down + closing
- —
- Monthly P&I
- —
- Monthly cashflow
- —
- DSCR
- —
- Eligible?
- —
No personal income docs; deal must DSCR.
Hard money
10% down · 12.0% · 12mo
- Down + closing
- —
- Monthly P&I
- —
- Monthly cashflow
- —
- DSCR
- —
- Eligible?
- —
Short-term bridge; refi at stabilization.
Rent comps 20 comps
| Address | Beds | Baths | Sqft | Rent | $/sqft | DOM | Units | Dist |
|---|---|---|---|---|---|---|---|---|
| 7317 46th Ave N Unit 4 St. Petersburg, FL | 1.0 | 1.0 | 528 | $1,200 | $2.27 | 14d | 1 | 0.36mi |
| 4801 71st St N St Petersburg, FL | 2.0 | 1.0 | 726 | $1,900 | $2.62 | 18d | 1 | 0.48mi |
| 4801 71st St N Saint Petersburg, FL | 2.0 | 1.0 | 726 | $1,900 | $2.62 | 4d | 1 | 0.48mi |
| 6801 48th Ave N Unit B St. Petersburg, FL | 1.0 | 1.0 | 650 | $1,525 | $2.35 | 24d | 1 | 0.59mi |
| 4701 68th St N Saint Petersburg, FL | 1.0 | 1.0 | 700 | $1,099 | $1.57 | 24d | 1 | 0.60mi |
| 7801 34th Ave N #88 Saint Petersburg, FL | 2.0 | 1.0 | 624 | $1,400 | $2.24 | 24d | 1 | 0.61mi |
| 7801 34th Ave N #88 Saint Petersburg, FL | 2.0 | 1.0 | 624 | $1,300 | $2.08 | 2d | 1 | 0.61mi |
| 3556 66th St N St. Petersburg, FL | 1.0 | 1.0 | 610 | $1,300 | $2.13 | 14d | 1 | 0.69mi |
| 6538 42nd Ave N Unit 7 Kenneth City, FL | 2.0 | 1.0 | 648 | $2,000 | $3.09 | 24d | 1 | 0.70mi |
| 5140 70th St N Unit 3 St. Petersburg, FL | 1.0 | 1.0 | 450 | $1,200 | $2.67 | 24d | 1 | 0.70mi |
| 7045 30th Ave N Saint Petersburg, FL | 1.0–2.0 | 1.0–2.0 | 825 | $1,595 | $1.93 | 7d | 1 | 0.71mi |
| 3980 64th St N Saint Petersburg, FL | 1.0–2.0 | 1.0–2.0 | 707 | $1,500 | $2.12 | 3d | 6 | 0.86mi |
| 5411 70th Ln N Saint Petersburg, FL | 2.0 | 1.0 | 600 | $1,800 | $3.00 | 24d | 1 | 0.88mi |
| 6522 54th Ave N Saint Petersburg, FL | 1.0–3.0 | 1.0–2.0 | 892 | $1,600 | $1.79 | 2d | 10 | 1.02mi |
| 5257 81st Ln N #6 Saint Petersburg, FL | 1.0 | 1.0 | 745 | $1,375 | $1.85 | 24d | 1 | 1.10mi |
| 6939 Stones Throw Cir N #6207 Saint Petersburg, FL | 1.0 | 1.0 | 680 | $1,595 | $2.35 | 24d | 1 | 1.31mi |
| 5255 62nd St N Kenneth City, FL | 1.0–3.0 | 1.0–2.0 | 1000 | $1,538 | $1.54 | 2d | 2 | 1.39mi |
| 6908 Stones Throw Cir N #10208 Saint Petersburg, FL | 2.0 | 1.5 | 730 | $1,900 | $2.60 | 15d | 1 | 1.40mi |
| 8800 Bay Pines Blvd #320 Saint Petersburg, FL | 1.0 | 1.0 | 506 | $2,200 | $4.35 | 4d | 1 | 1.43mi |
| 1699 68th St N Saint Petersburg, FL | 3.0 | 1.0–2.0 | 775 | $1,975 | $2.55 | 2d | 43 | 1.46mi |
HOA detail
- Monthly dues
- $225 · $2,700/yr
Listing history 16 events
-
2026-06-18days on market $110,000 Active 156 DOM
-
2026-06-17days on market $110,000 Active 155 DOM
-
2026-06-16days on market $110,000 Active 154 DOM
-
2026-06-15days on market $110,000 Active 153 DOM
-
2026-06-13days on market $110,000 Active 151 DOM
-
2026-06-09days on market $110,000 Active 147 DOM
-
2026-06-08days on market $110,000 Active 146 DOM
-
2026-06-07days on market $110,000 Active 145 DOM
-
2026-06-04days on market $110,000 Active 142 DOM
-
2026-06-03days on market $110,000 Active 141 DOM
-
2026-06-01days on market $110,000 Active 139 DOM
-
2026-05-31days on market $110,000 Active 138 DOM
-
2026-01-13$110,000 Active
-
2025-01-11historical
-
2024-11-01$129,900 Active
-
2003-11-14soldstatus $24,900
ⓘ Source: listings_history table (triggers on properties + properties_extension) + one-shot
backfill from property_details.listing_events for pre-trigger history.
Tax reassessment forecast FL · Resets to sale price
- Current annual tax
- $1,171 · $98/mo
- Projected year-2 tax
- $1,171 · $98/mo
- Expected delta
- $0/yr ($0/mo · 0.0%)
ⓘ Screening estimate from a state-policy table — verify with the county assessor before closing.
Climate risk First Street
- Flood 1/10 Low FEMA zone X (unshaded) · 0% chance over 30 yrs
- Wildfire 1/10 Low
- Heat 10/10 Extreme 7 d/yr ≥107°F today · 25 d/yr by 30 yrs out
- Wind 10/10 Extreme 99% chance of damaging wind over 30 yrs
- Air quality 4/10 Moderate 4 unhealthy d/yr today · 4 by 30 yrs out
Nearby sold comps map
Loading sold comps map…
Walkable amenities ~0.75 mi
Loading nearby amenities…
Taxation est. · year 1
- Rental income
- $19,566
- − Mortgage interest
- −$6,162
- − Property taxes
- −$1,171
- − Insurance
- −$550
- − Repairs & maintenance
- −$1,565
- − Management
- −$1,565
- − HOA
- −$2,700
- − Depreciation
- −$3,200
- Taxable income
- $2,653
- Est. tax owed @ 24.0%
- −$637
- After-tax cash flow
- $3,478/yr
For passive investors: Depreciation is non-cash, so a rental often shows a tax loss while cash-flowing — sheltering income. Rental losses are passive: they offset passive income freely, and up to $25,000/yr can offset ordinary (W-2) income if you actively participate and your MAGI is under $100k (phasing out to $0 by $150k); unused losses carry forward. On sale, claimed depreciation is recaptured at up to 25%, and gains may owe capital-gains tax (a 1031 exchange can defer both). Figures are a year-1 estimate at your 24.0% rate — not tax advice; consult a CPA.
Schools (NCES district)
- District
- Pinellas
- NCES district ID
- 1201560
- Math proficiency
- 51% ▼ -5.00%
- Reading proficiency
- 51% ▼ -3.00%
- Median HH income
- $46,270
- Composite
- 43.27/100
- National rank
- #3046
- State rank
- #31 of 73 in FL
Livability — West Lealman
- Score
- 81/100
- State rank
- #84
- US rank
- #1396
Category grades
Schools grade is shown separately in the Schools card above.
Census & demographics
- Census place
- West Lealman, FL
- County
- Pinellas County · 939,478 people
- City population
- 25,371
- Metro
- Tampa-St. Petersburg-Clearwater, FL
- Population (ZIP)
- 25,050
- Household income
- $53,501
- Rent vs Own
- Severe rent burden
- 712.0
Population outlook (Pinellas County) Hauer SSP2
- Today (2025)
- 1,027,532 people
- By 2030
- 1,063,586 · +3.5%
- By 2040
- 1,125,020 · +9.5%
- By 2050
- 1,168,637 · +13.7%
- By 2075
- 1,265,188 · +23.1%
- By 2100
- 1,260,357 · +22.7%
Race, ethnicity, and origin ACS 2023
- Neighborhood character
- Predominantly White (73%)
- Race & ethnicity
- White 73% Hispanic / Latino 11% Two or more races 10% Black 5% Asian 5%
- Hispanic origin (detail)
- Mexican 2% Puerto Rican 3% Cuban 2% Dominican 1%
- Common ancestry
- Lithuanian 3% Romanian 3% Slovak 2%
- Foreign-born
- 14% · Canada, Vietnam, Jamaica
- Languages at home
- 84% English-only · Spanish 9% Other Indo-European 2% Vietnamese 2%
Political lean MEDSL · Pinellas
- 2024 margin
- Lean R (+5.2) · D 46.9% · R 52.1%
- 2008→2024 swing
- -13.5pp toward R · 2008: 8.3pp · 2024: -5.2pp
- All cycles
- 2024: R+5.2 2020: D+0.2 2016: R+1.1 2012: D+5.6 2008: D+8.3
Not yet ingested
- Civics
- —
Market trends
- HPI YoY
- ▼ -416.74%
- Current HPI
- 391.368
- Rent YoY
- ▲ 0.99%
- Metro
- Tampa-St. Petersburg-Clearwater, FL
- State GDP YoY
- ▲ 3.28%
- F500 in state
- 36
Industry mix (Fortune 500 HQ in FL)
| Industry | F500 HQs | Revenue |
|---|---|---|
| Industrial Technology | 2 | $29B |
|
||
| Insurance | 2 | $17B |
|
||
| Retail | 1 | $60B |
|
||
| Technology Distribution | 1 | $58B |
|
||
| Homebuilding | 1 | $35B |
|
||
| Technology Manufacturing | 1 | $35B |
|
||
Price history
+341.8% since first listed4 events — show timeline
- 2026-01-13 Listed $110,000 Stellar MLS as Distributed by MLS Grid
- 2025-01-11 Listing Removed — Stellar MLS as Distributed by MLS Grid
- 2024-11-01 Listed $129,900 Stellar MLS as Distributed by MLS Grid
- 2003-11-14 Sold (Public Records) $24,900 Public Records
Property tax history
+5.1%/yrLatest (2025): $1,171 · +1.7% YoY. Source: county tax records.
Cash-flow waterfall
monthlySold comps — $/sqft
last 12 mo · ≤1 miLoading sold comps…