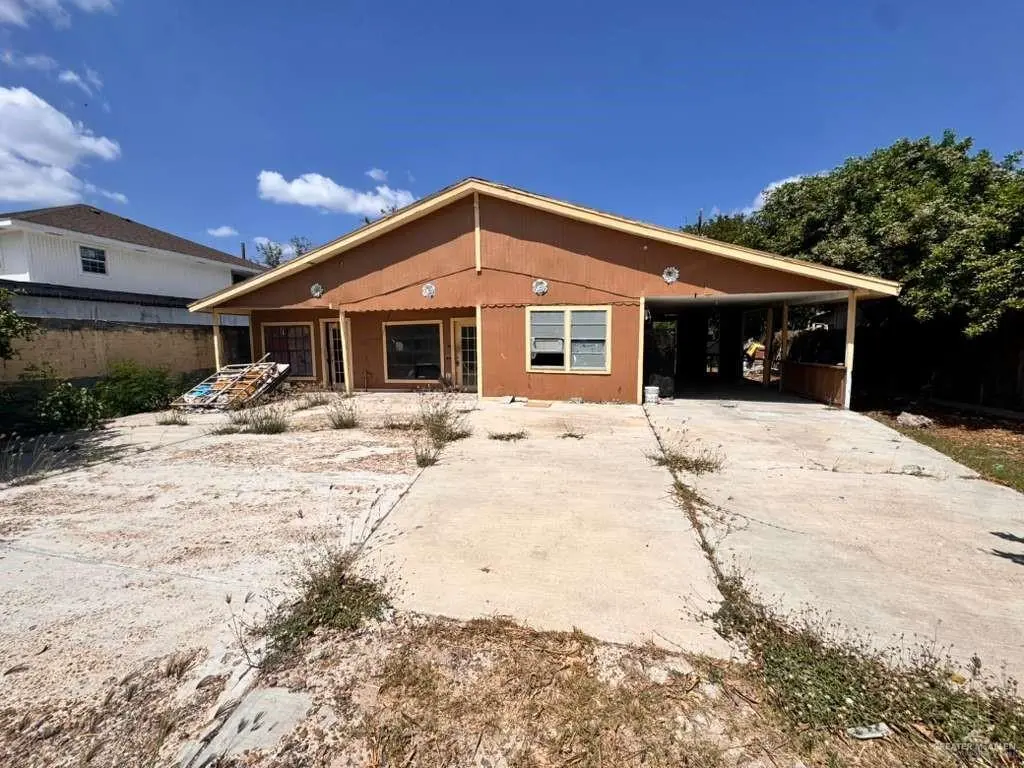
324 San Vicente Dr · South Alamo, TX
Flood risk 1/10 · Minimal
- FEMA flood zone
- X (shaded)
- Chance of flooding over 30 yrs
- 0.0%
- Est. flood insurance / yr
- $507 – $1,088
Fire risk 10/10 · Severe
- Est. fire insurance / yr
- $1,222 – $2,270
Heat risk 9/10 · Severe
- Hot days now (above 111°F)
- 7 days/yr
- Hot days in 30 yrs
- 23 days/yr
Wind risk 8/10 · Major
- Chance of severe wind over 30 yrs
- 99.0%
Air-quality risk 1/10 · Minimal
- Unhealthy air days now
- 0 days/yr
- Unhealthy air days in 30 yrs
- 0 days/yr
Risk factors via First Street. Map © Google.
Why this score? — see what drove the B- grade
The composite is a weighted blend of 9 inputs, each scored 0–100. Each bar is that input's sub-score; the figure is the points it added to the 100-point composite (weight × sub-score).
- Cash flow +30.0/30.0
- 1% rule +10.0/10.0
- DSCR +10.0/10.0
- ARV discount +7.5/15.0
- Livability +2.8/5.0
- Rent growth +2.5/5.0
- Condition / age +2.5/5.0
- Schools +1.1/10.0
- Appreciation +0.0/10.0
$69,900
🖨 Deal sheet 📄 Offer letter ✓ Due diligence
Listing remarks
Fixer-upper oportunity in Alamo, solid bone property with potential to be as an investment property
Key facts
- 7,021 sq ft lot
- Parking
- Built 1975
Property features AI
Finance
- HOA & community: No homeowners association; Community features: Other
Exterior
- Parking: 1 covered parking space; 1 carport space; Attached parking
- Utilities: Sewer: Other
- Home design: Single-family property; Entry via attached covered area
- Construction: Shingle roof; Other construction materials; Other foundation details; Building area approximately 1,332
- Exterior features: Other exterior features; Other fencing; Paved road access
Interior
- Kitchen: Water heater (other)
- Flooring: Tile flooring
- Bathrooms: 2 full bathrooms
- Interior features: Solid surface countertops; Window coverings; Other interior features
- Laundry & utility: Laundry area
Neighborhood map
What this means for you Summary
Snapshot
- This is a 4-bed/2.0-bath single-family listed at $70k.
Deal economics
- At list price, monthly cash flow is $767 ($9k/yr) — positive.
- The deal already cash-flows at list — no discount required.
- Meets the 1% rule at list price ($2k rent vs $70k).
- Recommended offer: $68k (3.0% below list) — sets the bar for market timing.
Location & tenants
- Location reads 56/100 on livability (#1,320 in TX) — a working-class tenant base; expect higher turnover. Strengths: cost of living A+, housing A+, crime B; Watch: schools F, amenities F, commute F.
- Donna ISD (suburban): math 11% / reading 18% proficiency, ranked #821 of 826 in TX (top 99%) — low school quality limits family demand, transient renter base, plan for 1-2y turnover.
- Market conditions: 350 active listings in the ZIP; 2 comparable units currently listed for rent nearby; 7,378 units permitted in Hidalgo County in 2024 (641 in 5+ unit buildings).
- This rent runs 37% of the median local income ($53k/yr) — at the standard rent-burdened threshold; future hikes will face affordability resistance.
Forward outlook
- Local home prices are declining (-3.0%/yr); year-one equity from $483 of loan paydown is wiped out by about $2k of value loss. Plan a longer hold.
- Hidalgo County population projected at +28% by 2050 — long-run rental-demand tailwind backs the buy-and-hold thesis.
- At projected returns (-3.0% appreciation + 3.0% rent growth), your $20k cash investment doubles in ~3 years — after that, you're playing with house money.
Negotiation context
- It's been on market 43 days — a 3% lower offer ($68k) is reasonable based on typical stale-listing flexibility.
- 5 sale attempts since 2y ago with the ask held roughly flat each time — persistent listings suggest the price (not the market) is what's stuck; bring a comps-based counter.
Risks & watch-outs
- Climate carrying-cost: severe wind risk, 99% chance of damaging wind over 30y; severe wildfire risk; extreme-heat days projected 7→23/yr by 2055 (HVAC capex compounding) — expect insurance premiums to compound above CPI over the hold.
Questions for the listing agent
- It's been on market 43 days. Have you received any prior offers? Is the seller open to a 3% concession, seller financing, or rate buy-down credit?
- Built in 1975 — when were the roof, HVAC, electrical panel, plumbing, and water heater last replaced?
- Is there a deadline driving the sale (1031 exchange, divorce, estate, relocation)? That informs how much negotiation room exists.
- Schools are F-rated, which usually means shorter tenancies and higher turnover. Who's the typical renter profile here, and what's been the actual vacancy rate?
- What's the average days-on-market for RENTAL listings here right now (not sales)? A rising rental-DOM trend means longer vacancies and softer asking-rent achievability than the comps imply.
- What's the recent tenant-quality profile in this submarket — average credit score on applications, eviction rate, late-payment / NSF rate, and stable-employment percentage? A property-management company in the area should have these aggregated.
- How much new for-sale + rental construction is in the pipeline within 1–3 miles? Heavy new supply typically softens prices + rents 12–24 months out; constrained supply supports both.
Investment metrics
- 1% rule
- 2.36% ✓
- Cap rate
- 19.46%
- Cash-on-cash
- 47.01%
- DSCR
- 3.09
- GRM
- 3.5
CMA / ARV
- ARV (median comp)
- $225,994
- List price
- $69,900
- Delta
- -69.07%
- Verdict
- UNDERPRICED
- Comps
- 20 within 1.0 mi
Show comp detail 12 sales within ~0.75 mi
| Address | Dist | Beds/Ba | Sqft | Sold | Price | $/sf | Match |
|---|---|---|---|---|---|---|---|
| 323 San Angelo Dr | 0.13mi | 3/2.0 (-1) | 1,384 (+4%) | 2mo | $145,000 | $105 | 81 |
| 507 Tower Oak Dr | 0.53mi | 3/2.0 (-1) | 1,345 (+1%) | 2mo | $227,499 | $169 | 67 |
| 607 Tower Oak Dr | 0.57mi | 3/2.0 (-1) | 1,338 (+0%) | 4mo | $224,700 | $168 | 65 |
| 1332 S 9th St | 0.63mi | 3/2.0 (-1) | 1,360 (+2%) | 5mo | $237,390 | $175 | 58 |
| 1334 S 9th St | 0.62mi | 3/2.0 (-1) | 1,341 (+1%) | 9mo | $239,000 | $178 | 57 |
| 100 San Angelo Dr | 0.39mi | 3/3.5 (-1) | 1,292 (-3%) | 12mo | $139,999 | $108 | 56 |
| 519 Tower Oak Dr | 0.55mi | 3/2.5 (-1) | 1,380 (+4%) | 7mo | $234,900 | $170 | 56 |
| 603 Tower Oak Dr | 0.56mi | 3/2.5 (-1) | 1,376 (+3%) | 8mo | $234,900 | $171 | 55 |
| 1310 S 9th St | 0.68mi | 3/2.0 (-1) | 1,390 (+4%) | 7mo | $234,900 | $169 | 51 |
| 1323 S 9th St | 0.67mi | 3/2.0 (-1) | 1,428 (+7%) | 2mo | $249,900 | $175 | 50 |
| 1336 Carlos Dr | 0.68mi | 3/2.0 (-1) | 1,380 (+4%) | 11mo | $205,000 | $149 | 48 |
| 1326 S 9th St | 0.64mi | 3/2.0 (-1) | 1,501 (+13%) | 8mo | $249,900 | $166 | 38 |
Match score weights: distance 35% · size 25% · config 20% · recency 20%. Top-matched comps best support the ARV.
Projected returns pro-forma
-3.0% appreciation · 3.0% rent growth · sell at horizon
- IRR
- 44.4%
- Equity multiple
- 2.92×
- Total profit
- $37,565
- Equity at exit
- $10,422
- IRR
- 50.3%
- Equity multiple
- 5.90×
- Total profit
- $95,826
- Equity at exit
- $6,044
Cash invested: $19,572 (down + closing). Projections, not guarantees.
Landlord ↔ Tenant lean methodology
- Overall (STATE)
- 87 Strongly Landlord-Friendly
- State Texas
- 87 Strongly Landlord-Friendly · R+5
- County
- — inherits STATE
- City
- — inherits STATE
ZIP-level market 78516
- Home prices YoY
- -6.5%
- Active inventory
- 350
- Price-to-rent
- 3.5×
Monthly cashflow live
- Estimated rent
- $1,648 medium interval (Pro) →
- Mortgage (P&I)
- −$367
- Tax from tax record
- −$140 /mo · $1,678/yr
- Insurance
- −$29
- HOA
- −$0
- Vacancy / Maint / Mgmt
- −$346
- Net cashflow
- $767
Break-even live
UW: 25.0% down · 7.5% · 30yr · 1.5% tax · 5.0% vac · 8.0% maint · 8.0% mgmt
Financing live
Cash to close
- Down payment
- $17,475
- Closing costs
- $2,097
- Reserves months
- —
- Total cash needed
- —
Loan-product check · same deal, 3 products live
Conventional
25% down · 7.5% · 30yr
- Down + closing
- —
- Monthly P&I
- —
- Monthly cashflow
- —
- DSCR
- —
- Eligible?
- —
Personal DTI + credit; lowest rate.
DSCR
20% down · 8.5% · 30yr
- Down + closing
- —
- Monthly P&I
- —
- Monthly cashflow
- —
- DSCR
- —
- Eligible?
- —
No personal income docs; deal must DSCR.
Hard money
10% down · 12.0% · 12mo
- Down + closing
- —
- Monthly P&I
- —
- Monthly cashflow
- —
- DSCR
- —
- Eligible?
- —
Short-term bridge; refi at stabilization.
Rent comps 2 comps
| Address | Beds | Baths | Sqft | Rent | $/sqft | DOM | Units | Dist |
|---|---|---|---|---|---|---|---|---|
| 504 San Antonio Cir Alamo, TX | 3.0 | 2.0 | 1216 | $1,600 | $1.32 | 14d | 1 | 0.23mi |
| 1003 Alta Vista Dr Alamo, TX | 4.0 | 2.0 | 1144 | $1,200 | $1.05 | 23d | 1 | 0.74mi |
Listing history 26 events
-
2026-06-18days on market $69,900 Active 43 DOM
-
2026-06-17days on market $69,900 Active 42 DOM
-
2026-06-16days on market $69,900 Active 41 DOM
-
2026-06-15days on market $69,900 Active 40 DOM
-
2026-06-14days on market $69,900 Active 38 DOM
-
2026-06-13days on market $69,900 Active 37 DOM
-
2026-06-10days on market $69,900 Active 35 DOM
-
2026-06-09days on market $69,900 Active 34 DOM
-
2026-06-08days on market $69,900 Active 33 DOM
-
2026-06-07days on market $69,900 Active 32 DOM
-
2026-06-05days on market $69,900 Active 29 DOM
-
2026-06-03days on market $69,900 Active 28 DOM
-
2026-06-02days on market $69,900 Active 27 DOM
-
2026-06-01days on market $69,900 Active 26 DOM
-
2026-05-31days on market $69,900 Active 25 DOM
-
2026-05-31days on market $69,900 Active 24 DOM
-
2026-05-05$69,900 Active 99-char remark
-
2026-01-22price $63,000
-
2025-12-05$67,000 Active
-
2025-06-23$75,000 Active
-
2024-12-12soldstatus
-
2024-11-13$75,000 Active
-
2024-10-17$75,000 Active
-
2013-03-05soldstatus
-
2009-02-05soldstatus
-
2003-01-13soldstatus
ⓘ Source: listings_history table (triggers on properties + properties_extension) + one-shot
backfill from property_details.listing_events for pre-trigger history.
Tax reassessment forecast TX · Resets to sale price
- Current annual tax
- $1,678 · $140/mo
- Projected year-2 tax
- $1,678 · $140/mo
- Expected delta
- $0/yr ($0/mo · 0.0%)
ⓘ Screening estimate from a state-policy table — verify with the county assessor before closing.
Climate risk First Street
- Flood 1/10 Low FEMA zone X (shaded) · 0% chance over 30 yrs
- Wildfire 10/10 Extreme
- Heat 9/10 Extreme 7 d/yr ≥111°F today · 23 d/yr by 30 yrs out
- Wind 8/10 Severe 99% chance of damaging wind over 30 yrs
- Air quality 1/10 Low 0 unhealthy d/yr today · 0 by 30 yrs out
Nearby sold comps map
Loading sold comps map…
Walkable amenities ~0.75 mi
Loading nearby amenities…
Taxation est. · year 1
- Rental income
- $19,781
- − Mortgage interest
- −$3,915
- − Property taxes
- −$1,678
- − Insurance
- −$350
- − Repairs & maintenance
- −$1,582
- − Management
- −$1,582
- − Depreciation
- −$2,033
- Taxable income
- $8,640
- Est. tax owed @ 24.0%
- −$2,074
- After-tax cash flow
- $7,127/yr
For passive investors: Depreciation is non-cash, so a rental often shows a tax loss while cash-flowing — sheltering income. Rental losses are passive: they offset passive income freely, and up to $25,000/yr can offset ordinary (W-2) income if you actively participate and your MAGI is under $100k (phasing out to $0 by $150k); unused losses carry forward. On sale, claimed depreciation is recaptured at up to 25%, and gains may owe capital-gains tax (a 1031 exchange can defer both). Figures are a year-1 estimate at your 24.0% rate — not tax advice; consult a CPA.
Schools (NCES district)
- District
- Donna ISD
- NCES district ID
- 4817390
- Math proficiency
- 11% ▼ -30.00%
- Reading proficiency
- 18% ▼ -13.00%
- Median HH income
- $27,330
- Composite
- 11.16/100
- National rank
- #9728
- State rank
- #821 of 826 in TX
Livability — South Alamo
- Score
- 56/100
- State rank
- #1320
- US rank
- #22734
Category grades
Schools grade is shown separately in the Schools card above.
Census & demographics
- Census place
- South Alamo, TX
- County
- Hidalgo County · 623,128 people
- Metro
- McAllen-Edinburg-Mission, TX
- Population (ZIP)
- 34,370
- Household income
- $53,229
- Rent vs Own
- Severe rent burden
- 476.0
Population outlook (Hidalgo County) Hauer SSP2
- Today (2025)
- 955,232 people
- By 2030
- 1,009,774 · +5.7%
- By 2040
- 1,120,332 · +17.3%
- By 2050
- 1,225,036 · +28.2%
- By 2075
- 1,439,189 · +50.7%
- By 2100
- 1,533,429 · +60.5%
Race, ethnicity, and origin ACS 2023
- Neighborhood character
- Predominantly Hispanic (89%)
- Race & ethnicity
- Hispanic / Latino 89% Two or more races 40% White 10% Black 1%
- Hispanic origin (detail)
- Mexican 86%
- Foreign-born
- 29% · Canada
- Languages at home
- 24% English-only · Spanish 76%
Political lean MEDSL · Hidalgo
- 2024 margin
- Toss-up / Even · D 48.1% · R 51.0%
- 2008→2024 swing
- -41.6pp toward R · 2008: 38.7pp · 2024: -2.9pp
- All cycles
- 2024: R+2.9 2020: D+17.1 2016: D+40.5 2012: D+41.8 2008: D+38.7
Not yet ingested
- Civics
- —
Market trends
- HPI YoY
- ▼ -15.56%
- Current HPI
- 225.4438
- Rent YoY
- —
- Metro
- McAllen-Edinburg-Mission, TX
- State GDP YoY
- ▲ 3.95%
- F500 in state
- 110
Industry mix (Fortune 500 HQ in TX)
| Industry | F500 HQs | Revenue |
|---|---|---|
| Energy | 16 | $1,198B |
|
||
| Technology | 5 | $198B |
|
||
| Engineering / Construction | 4 | $72B |
|
||
| Energy Services | 3 | $60B |
|
||
| Utilities | 3 | $41B |
|
||
| Healthcare | 2 | $330B |
|
||
Price history
-6.8% since first listed10 events — show timeline
- 2026-05-05 Listed $69,900 MCALLENMLS
- 2026-01-22 Price Changed $63,000 MCALLENMLS
- 2025-12-05 Listed $67,000 MCALLENMLS
- 2025-06-23 Listed $75,000 MCALLENMLS
- 2024-12-12 Sold (Public Records) — Public Records
- 2024-11-13 Listed $75,000 MCALLENMLS
- 2024-10-17 Listed $75,000 MCALLENMLS
- 2013-03-05 Sold (Public Records) — Public Records
- 2009-02-05 Sold (Public Records) — Public Records
- 2003-01-13 Sold (Public Records) — Public Records
Property tax history
+7.2%/yrLatest (2025): $1,678 · -3.3% YoY. Source: county tax records.
Cash-flow waterfall
monthlySold comps — $/sqft
last 12 mo · ≤1 miLoading sold comps…