4130 Rahn Rd #206 · Eagan, MN
Flood risk 1/10 · Minimal
- FEMA flood zone
- X (unshaded)
- Chance of flooding over 30 yrs
- 0.0%
- Est. flood insurance / yr
- $507 – $1,088
Fire risk 3/10 · Minor
- Est. fire insurance / yr
- $888 – $1,650
Heat risk 2/10 · Minimal
- Hot days now (above 99°F)
- 7 days/yr
- Hot days in 30 yrs
- 14 days/yr
Wind risk 2/10 · Minimal
- Chance of severe wind over 30 yrs
- —
Air-quality risk 2/10 · Minimal
- Unhealthy air days now
- 1 days/yr
- Unhealthy air days in 30 yrs
- 1 days/yr
Risk factors via First Street. Map © Google.
Why this score? — see what drove the D+ grade
The composite is a weighted blend of 9 inputs, each scored 0–100. Each bar is that input's sub-score; the figure is the points it added to the 100-point composite (weight × sub-score).
- Cash flow +14.5/30.0
- 1% rule +9.0/10.0
- ARV discount +7.5/15.0
- Schools +4.9/10.0
- DSCR +4.4/10.0
- Livability +4.3/5.0
- Rent growth +2.7/5.0
- Condition / age +2.5/5.0
- Appreciation +0.0/10.0
$115,000
🖨 Deal sheet 📄 Offer letter ✓ Due diligence
Listing remarks MLS
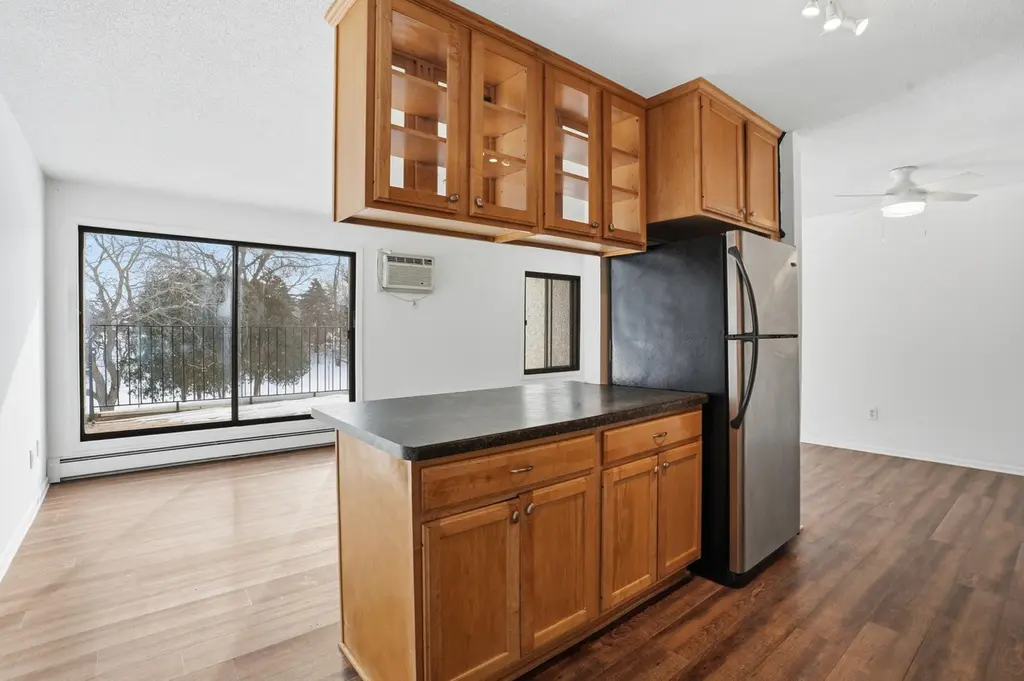
Great location in the heart of Eagan. Updates to the unit include a updated kitchen, stainless steel appliances and upgraded flooring. Patio looks out to green space, playground and dog park. Unit showcases a lot of storage for a condo. Live for less then rent.
Key facts
- Ample cabinetry
- Private balcony
- Center island
Tags
Property features AI
Finance
- Other: Association fee listed monthly
- HOA & community: Managed by Cities Management; Monthly HOA fee; HOA amenities: laundry, tennis courts; HOA covers controlled access, hazard insurance, heating, lawn care, grounds maintenance, parking, sewer, shared amenities, snow removal, water
Exterior
- Parking: Parking garage; 1-car garage
- Utilities: City water (connected); City sewer (connected); Natural gas
- Home design: Residential attached property; One story; 900 above-grade finished square feet
- Construction: Other foundation
- Exterior features: Stone exterior; Deck (11 x 5)
Interior
- Kitchen: Kitchen on main level; Stainless steel appliances
- Bedrooms: 2 bedrooms (both on the main level)
- Bathrooms: 1 full bath (main level)
- Heating & cooling: Baseboard heating; Wall unit cooling
- Interior features: Stainless steel appliances; All living facilities on one level; Main floor full bath
- Laundry & utility: Laundry in common area
Neighborhood map
What this means for you Summary
Snapshot
- This is a 2-bed/1.0-bath condo listed at $115k.
Deal economics
- At list price, monthly cash flow is $25 ($304/yr) — positive.
- The deal already cash-flows at list — no discount required.
- Meets the 1% rule at list price ($2k rent vs $115k).
- Recommended offer: $105k (9.0% below list) — sets the bar for market timing.
- Cap rate 6.6% vs local median 3.3% in Eagan — top-decile yield for the area; either an underpriced asset or a hidden risk that comps aren't pricing in. Stress-test before assuming the spread holds.
Location & tenants
- Location reads 86/100 on livability (#13 in MN, #418 nationally) — a professional / high-income tenant draw. Strengths: commute A+, employment A+, housing A+; Watch: cost of living D+, amenities F.
- Rosemount-Apple Valley-Eagan (suburban): math 50% / reading 58% proficiency, ranked #58 of 301 in MN (top 19%) — acceptable for families but not a draw, mixed tenant base, ~2y average lease; only 18% free/reduced lunch — higher-income household profile.
- Market conditions: Rents flat; 90 active listings in the ZIP; 16 comparable units currently listed for rent nearby; rentals leasing fast (median 5d on market — plan ~1-2 weeks tenant-placement turnaround); solid renter incomes; 2,134 units permitted in Dakota County in 2024 (898 in 5+ unit buildings).
Forward outlook
- Local home prices are declining (-3.0%/yr); year-one equity from $795 of loan paydown is wiped out by about $3k of value loss. Plan a longer hold.
- Dakota County population projected at +11% by 2050 — modest demand growth; plan on rents tracking national, not racing it.
Negotiation context
- It's been on market 91 days — a 9% lower offer ($105k) is reasonable based on typical stale-listing flexibility.
- 3 sale attempts since 21y ago with the ask held roughly flat each time — persistent listings suggest the price (not the market) is what's stuck; bring a comps-based counter.
Risks & watch-outs
- Watch-outs: HOA is 32% of rent.
Questions for the listing agent
- It's been on market 91 days. Have you received any prior offers? Is the seller open to a 9% concession, seller financing, or rate buy-down credit?
- Built in 1972 — when were the roof, HVAC, electrical panel, plumbing, and water heater last replaced?
- What does the HOA fee cover, when was the last increase, and are there any pending special assessments or reserve-fund shortfalls?
- Any open or pending special assessments — roof, HVAC, plumbing, elevator, façade? What's the per-unit balance and payoff schedule, and is the seller paying it off at close or rolling it to the buyer?
- Why hasn't it sold? Are there any deal-killer items the seller is aware of (foundation, flood, title, zoning, code violations)?
- Is there a deadline driving the sale (1031 exchange, divorce, estate, relocation)? That informs how much negotiation room exists.
- Schools are A-rated — typically a magnet for longer-tenancy family renters. What's the average tenant stay here, and is there a school-zone premium baked into asking?
- The area grade is low — what's the realistic commute time and amenity access for the typical tenant pool here? Any planned neighborhood developments (good or bad) we should know about?
- What's the average days-on-market for RENTAL listings here right now (not sales)? A rising rental-DOM trend means longer vacancies and softer asking-rent achievability than the comps imply.
- What's the recent tenant-quality profile in this submarket — average credit score on applications, eviction rate, late-payment / NSF rate, and stable-employment percentage? A property-management company in the area should have these aggregated.
- How much new apartment / multifamily construction is in the pipeline within 1–3 miles? Heavy new supply (>2% of stock underway) typically softens rents 12–24 months out; light construction supports rent growth.
Investment metrics
- 1% rule
- 1.40% ✓
- Cap rate
- 6.56%
- Cash-on-cash
- 0.94%
- DSCR
- 1.04
- GRM
- 6.0
CMA / ARV
No comps found within radius.
Projected returns pro-forma
-3.0% appreciation · 0.84% rent growth · sell at horizon
- IRR
- -18.3%
- Equity multiple
- 0.37×
- Total profit
- $-20,137
- Equity at exit
- $17,147
- IRR
- -18.6%
- Equity multiple
- 0.14×
- Total profit
- $-27,655
- Equity at exit
- $9,943
Cash invested: $32,200 (down + closing). Projections, not guarantees.
Landlord ↔ Tenant lean methodology
- Overall (STATE)
- 46 Balanced
- State Minnesota
- 46 Balanced · D+2
- County
- — inherits STATE
- City
- — inherits STATE
ZIP-level market 55122
- Rents YoY
- 0.8%
- Active inventory
- 90
- Price-to-rent
- 6.0×
Monthly cashflow live
- Estimated rent
- $1,604 high interval (Pro) →
- Mortgage (P&I)
- −$603
- Tax from tax record
- −$72 /mo · $866/yr
- Insurance
- −$48
- HOA
- −$519
- Vacancy / Maint / Mgmt
- −$337
- Net cashflow
- $25
Break-even live
UW: 25.0% down · 7.5% · 30yr · 1.5% tax · 5.0% vac · 8.0% maint · 8.0% mgmt
Financing live
Cash to close
- Down payment
- $28,750
- Closing costs
- $3,450
- Reserves months
- —
- Total cash needed
- —
Loan-product check · same deal, 3 products live
Conventional
25% down · 7.5% · 30yr
- Down + closing
- —
- Monthly P&I
- —
- Monthly cashflow
- —
- DSCR
- —
- Eligible?
- —
Personal DTI + credit; lowest rate.
DSCR
20% down · 8.5% · 30yr
- Down + closing
- —
- Monthly P&I
- —
- Monthly cashflow
- —
- DSCR
- —
- Eligible?
- —
No personal income docs; deal must DSCR.
Hard money
10% down · 12.0% · 12mo
- Down + closing
- —
- Monthly P&I
- —
- Monthly cashflow
- —
- DSCR
- —
- Eligible?
- —
Short-term bridge; refi at stabilization.
Rent comps 16 comps
| Address | Beds | Baths | Sqft | Rent | $/sqft | DOM | Units | Dist |
|---|---|---|---|---|---|---|---|---|
| 4130 Rahn Rd #214 Saint Paul, MN | 2.0 | 1.0 | 911 | $1,350 | $1.48 | 24d | 1 | 0.03mi |
| 4150 Rahn Rd Eagan, MN | 1.0–2.0 | 1.0 | 762 | $1,325 | $1.74 | 2d | 6 | 0.07mi |
| 4110 Rahn Rd #207 Saint Paul, MN | 2.0 | 1.0 | 911 | $1,695 | $1.86 | 24d | 1 | 0.07mi |
| 1950 Jade Ln Saint Paul, MN | 1.0–2.0 | 1.0 | 806 | $1,595 | $1.98 | 2d | 4 | 0.11mi |
| 1946 Glenfield Ct Saint Paul, MN | 2.0 | 1.0 | 1080 | $1,695 | $1.57 | 24d | 1 | 0.13mi |
| 4130 Durham Ct Eagan, MN | 2.0 | 1.0 | 1076 | $1,750 | $1.63 | 24d | 1 | 0.13mi |
| 1811 Trailway Dr Unit 6 St Paul, MN | 1.0 | 1.0 | 755 | $1,349 | $1.79 | 4d | 1 | 0.62mi |
| 3903 Cedar Grove Pkwy Saint Paul, MN | 2.0 | 1.0–2.0 | 877 | $2,806 | $3.20 | 1d | 14 | 0.64mi |
| 1835 Trailway Dr Unit 6 St Paul, MN | 1.0 | 1.0 | 755 | $1,349 | $1.79 | 4d | 1 | 0.64mi |
| 1813 Trailway Dr Saint Paul, MN | 1.0–2.0 | 1.0–1.5 | 857 | $1,609 | $1.88 | 4d | 6 | 0.65mi |
| 1805 Trailway Dr Apt 7 Eagan, MN | 2.0 | 1.5 | 960 | $1,609 | $1.68 | 24d | 1 | 0.70mi |
| 1803 Trailway Dr Apt 6 St Paul, MN | 1.0 | 1.0 | 755 | $1,389 | $1.84 | 17d | 1 | 0.70mi |
| 3800 Ballantrae Rd Eagan, MN | 3.0 | 1.0–2.0 | 1093 | $2,203 | $2.02 | 1d | 1 | 0.74mi |
| 3825 Cedar Grove Pkwy Saint Paul, MN | 1.0–3.0 | 1.0–2.0 | 1117 | $2,040 | $1.83 | 1d | 26 | 0.74mi |
| 4502 Cinnamon Ridge Trl Unit B Saint Paul, MN | 2.0 | 1.0 | 1020 | $1,745 | $1.71 | 24d | 1 | 1.26mi |
| 4598 Slater Rd Eagan, MN | 2.0 | 1.5–2.0 | 1150 | $1,780 | $1.55 | 1d | 6 | 1.42mi |
HOA detail condo
- Monthly dues
- $519 · $6,228/yr
- Assessments
- None detected in remarks — confirm with the listing agent.
Listing history 22 events
-
2026-06-18days on market $115,000 Active 91 DOM
-
2026-06-17days on market $115,000 Active 90 DOM
-
2026-06-16days on market $115,000 Active 89 DOM
-
2026-06-15days on market $115,000 Active 88 DOM
-
2026-06-13days on market $115,000 Active 86 DOM
-
2026-06-13days on market $115,000 Active 85 DOM
-
2026-06-09days on market $115,000 Active 82 DOM
-
2026-06-08days on market $115,000 Active 81 DOM
-
2026-06-07days on market $115,000 Active 80 DOM
-
2026-06-04days on market $115,000 Active 77 DOM
-
2026-06-03days on market $115,000 Active 76 DOM
-
2026-06-02days on market $115,000 Active 75 DOM
-
2026-06-01days on market $115,000 Active 74 DOM
-
2026-05-31days on market $115,000 Active 73 DOM
-
2026-04-09price $115,000
-
2026-03-19$120,000 Active
-
2021-09-16status Pending 265-char remark
Show marketing remark (265 chars)
Great location in the heart of Eagan. Updates to the unit include a updated kitchen, stainless steel appliances and upgraded flooring. Patio looks out to green space, playground and dog park. Unit showcases a lot of storage for a condo. Live for less then rent.
-
2021-09-16soldstatus $116,000 Sold 265-char remark
Show marketing remark (265 chars)
Great location in the heart of Eagan. Updates to the unit include a updated kitchen, stainless steel appliances and upgraded flooring. Patio looks out to green space, playground and dog park. Unit showcases a lot of storage for a condo. Live for less then rent.
-
2021-08-05$121,000 Active 265-char remark
Show marketing remark (265 chars)
Great location in the heart of Eagan. Updates to the unit include a updated kitchen, stainless steel appliances and upgraded flooring. Patio looks out to green space, playground and dog park. Unit showcases a lot of storage for a condo. Live for less then rent.
-
2021-08-02historical $121,000 265-char remark
Show marketing remark (265 chars)
Great location in the heart of Eagan. Updates to the unit include a updated kitchen, stainless steel appliances and upgraded flooring. Patio looks out to green space, playground and dog park. Unit showcases a lot of storage for a condo. Live for less then rent.
-
2005-06-22historical
-
2005-04-28$120,400
ⓘ Source: listings_history table (triggers on properties + properties_extension) + one-shot
backfill from property_details.listing_events for pre-trigger history.
Tax reassessment forecast MN · Partial reset (capped growth)
- Current annual tax
- $866 · $72/mo
- Projected year-2 tax
- $1,077 · $90/mo
- Expected delta
- +$211/yr (+$18/mo · 24.4%)
ⓘ Screening estimate from a state-policy table — verify with the county assessor before closing.
Climate risk First Street
- Flood 1/10 Low FEMA zone X (unshaded) · 0% chance over 30 yrs
- Wildfire 3/10 Moderate
- Heat 2/10 Low 7 d/yr ≥99°F today · 14 d/yr by 30 yrs out
- Wind 2/10 Low
- Air quality 2/10 Low 1 unhealthy d/yr today · 1 by 30 yrs out
Nearby sold comps map
Loading sold comps map…
Walkable amenities ~0.75 mi
Loading nearby amenities…
Taxation est. · year 1
- Rental income
- $19,253
- − Mortgage interest
- −$6,442
- − Property taxes
- −$866
- − Insurance
- −$575
- − Repairs & maintenance
- −$1,540
- − Management
- −$1,540
- − HOA
- −$6,228
- − Depreciation
- −$3,345
- Taxable loss
- −$1,284
- Est. tax savings @ 24.0%
- +$308
- After-tax cash flow
- $612/yr
For passive investors: Depreciation is non-cash, so a rental often shows a tax loss while cash-flowing — sheltering income. Rental losses are passive: they offset passive income freely, and up to $25,000/yr can offset ordinary (W-2) income if you actively participate and your MAGI is under $100k (phasing out to $0 by $150k); unused losses carry forward. On sale, claimed depreciation is recaptured at up to 25%, and gains may owe capital-gains tax (a 1031 exchange can defer both). Figures are a year-1 estimate at your 24.0% rate — not tax advice; consult a CPA.
Schools (NCES district)
- District
- Rosemount-Apple Valley-Eagan
- NCES district ID
- 2732390
- Math proficiency
- 50% ▼ -14.00%
- Reading proficiency
- 58% ▼ -7.00%
- Median HH income
- $85,559
- Composite
- 49.48/100
- National rank
- #2000
- State rank
- #58 of 301 in MN
Livability — Eagan
- Score
- 86/100
- State rank
- #13
- US rank
- #418
Category grades
Schools grade is shown separately in the Schools card above.
Census & demographics
- Census place
- Eagan, MN
- County
- Dakota County · 417,704 people
- City population
- 67,960
- Metro
- Minneapolis-St. Paul-Bloomington, MN-WI
- Population (ZIP)
- 32,261
- Household income
- $96,823
- Rent vs Own
- Severe rent burden
- 1005.0
Population outlook (Dakota County) Hauer SSP2
- Today (2025)
- 450,671 people
- By 2030
- 465,068 · +3.2%
- By 2040
- 486,770 · +8.0%
- By 2050
- 498,743 · +10.7%
- By 2075
- 533,865 · +18.5%
- By 2100
- 550,133 · +22.1%
Race, ethnicity, and origin ACS 2023
- Neighborhood character
- Predominantly White (68%)
- Race & ethnicity
- White 68% Black 15% Asian 9% Hispanic / Latino 5% Two or more races 5%
- Hispanic origin (detail)
- Mexican 4%
- Common ancestry
- Portuguese 10% Romanian 3% Iranian 3%
- Foreign-born
- 15% · Canada, Philippines, China
- Languages at home
- 84% English-only · Other Asian/Pacific 4% Spanish 2% Chinese 1%
Political lean MEDSL · Dakota
- 2024 margin
- D (+12.9) · D 55.4% · R 42.5% · Other 2.1%
- 2008→2024 swing
- +7.4pp toward D · 2008: 5.5pp · 2024: 12.9pp
- All cycles
- 2024: D+12.9 2020: D+13.9 2016: D+4.7 2012: D+2.9 2008: D+5.5
Not yet ingested
- Civics
- —
Market trends
- HPI YoY
- ▼ -230.39%
- Current HPI
- 226.6631
- Rent YoY
- ▲ 0.84%
- Metro
- Minneapolis-St. Paul-Bloomington, MN-WI
- State GDP YoY
- ▲ 2.41%
- F500 in state
- 34
Industry mix (Fortune 500 HQ in MN)
| Industry | F500 HQs | Revenue |
|---|---|---|
| Healthcare | 2 | $407B |
|
||
| Retail | 2 | $150B |
|
||
| Consumer Goods | 2 | $32B |
|
||
| Industrial Machinery | 2 | $6B |
|
||
| Agriculture | 1 | $40B |
|
||
| Healthcare / Medical Devices | 1 | $32B |
|
||
Price history
-4.5% since first listed8 events — show timeline
- 2026-04-09 Price Changed $115,000 NORTHSTARMLS as Distributed by MLS Grid
- 2026-03-19 Listed $120,000 NORTHSTARMLS as Distributed by MLS Grid
- 2021-09-16 Pending — NORTHSTARMLS as Distributed by MLS Grid
- 2021-09-16 Sold (MLS) $116,000 NORTHSTARMLS as Distributed by MLS Grid
- 2021-08-05 Listed $121,000 NORTHSTARMLS as Distributed by MLS Grid
- 2021-08-02 Coming Soon $121,000 NORTHSTARMLS as Distributed by MLS Grid
- 2005-06-22 Listing Removed — NORTHSTARMLS as Distributed by MLS Grid
- 2005-04-28 Listed $120,400 NORTHSTARMLS as Distributed by MLS Grid
Property tax history
+7.5%/yrLatest (2025): $866 · -15.3% YoY. Source: county tax records.
Cash-flow waterfall
monthlySold comps — $/sqft
last 12 mo · ≤1 miLoading sold comps…