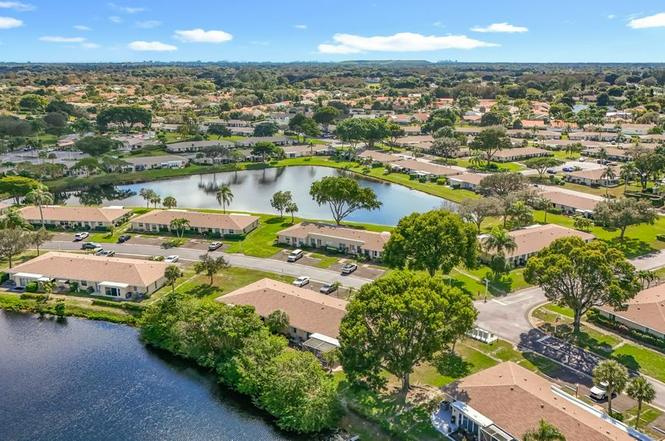
8891 Bella Vista Dr · Boca Raton, FL
Flood risk 1/10 · Minimal
- FEMA flood zone
- X (unshaded)
- Chance of flooding over 30 yrs
- 0.0%
- Est. flood insurance / yr
- $507 – $1,088
Fire risk 1/10 · Minimal
- Est. fire insurance / yr
- $947 – $1,759
Heat risk 9/10 · Severe
- Hot days now (above 107°F)
- 7 days/yr
- Hot days in 30 yrs
- 27 days/yr
Wind risk 10/10 · Severe
- Chance of severe wind over 30 yrs
- 99.0%
Air-quality risk 2/10 · Minimal
- Unhealthy air days now
- 2 days/yr
- Unhealthy air days in 30 yrs
- 2 days/yr
Risk factors via First Street. Map © Google.
Why this score? — see what drove the D grade
The composite is a weighted blend of 9 inputs, each scored 0–100. Each bar is that input's sub-score; the figure is the points it added to the 100-point composite (weight × sub-score).
- Cash flow +9.1/30.0
- 1% rule +7.9/10.0
- ARV discount +7.5/15.0
- Schools +4.3/10.0
- Livability +3.9/5.0
- Rent growth +2.6/5.0
- DSCR +2.5/10.0
- Condition / age +2.5/5.0
- Appreciation +0.0/10.0
$162,900
🖨 Deal sheet 📄 Offer letter ✓ Due diligence
Listing remarks
PRICE JUST REDUCED!! MOTIVATED SELLER SAYS SUBMIT OFFERS! You will fall in love with this bright and spacious 2 bedroom condo style Villa in Boca Lakes, a gated and vibrant 55+ community. This one level Villa style residence boasts an abundance of cabinetry and closet space, highlighted by a huge closet in the primary bedroom. Tile flooring throughout adds a touch of elegance with easy maintenance. Lovely updated bathroom with large shower. Side by side washer and dryer. Enjoy serene moments on your private patio on a lake, accessible via sliding glass doors. For added peace of mind this Villa is equipped with accordion shutters, offering both security and ease during storm season. The C
Key facts
- Gated community
- Clubhouse
- Accordion shutters
Tags
Property features AI
Exterior
- Home design: Condo
- Construction: Living area approximately 908 (unit unspecified)
- Exterior features: Lot size approximately 1 (unit unspecified)
Neighborhood map
What this means for you Summary
Snapshot
- This is a 1-bed/1.0-bath condo listed at $163k.
Deal economics
- At list price, monthly cash flow is $-126 ($-2k/yr) — negative.
- The deal already cash-flows at list — no discount required.
- Meets the 1% rule at list price ($2k rent vs $163k).
- Recommended offer: $148k (9.0% below list) — sets the bar for market timing.
- Cap rate 5.4% vs local median 2.8% in Boca Raton — top-decile yield for the area; either an underpriced asset or a hidden risk that comps aren't pricing in. Stress-test before assuming the spread holds.
Location & tenants
- Location reads 77/100 on livability (#192 in FL, #3,070 nationally) — a middle-class / working-renter tenant base. Strengths: schools A+, employment A+, health & safety A+; Watch: amenities D, cost of living F.
- Palm Beach (suburban): math 46% / reading 53% proficiency, ranked #34 of 73 in FL (top 47%) — families likely to look elsewhere, expect single-tenant / working-renter base with shorter leases.
- Market conditions: Rents flat; 430 active listings in the ZIP; 40 comparable units currently listed for rent nearby; rentals at typical pace (median 25d on market — plan ~3-4 weeks tenant-placement turnaround); solid renter incomes; 3,974 units permitted in Palm Beach County in 2024 (1,012 in 5+ unit buildings).
Forward outlook
- Local home prices are declining (-3.0%/yr); year-one equity from $1k of loan paydown is wiped out by about $5k of value loss. Plan a longer hold.
- Palm Beach County population projected at +30% by 2050 — long-run rental-demand tailwind backs the buy-and-hold thesis.
Negotiation context
- It's been on market 101 days — a 9% lower offer ($148k) is reasonable based on typical stale-listing flexibility.
- 3 sale attempts since 4y ago with the ask held roughly flat each time — persistent listings suggest the price (not the market) is what's stuck; bring a comps-based counter.
Risks & watch-outs
- Watch-outs: HOA is 29% of rent.
- Climate carrying-cost: severe wind risk, 99% chance of damaging wind over 30y; extreme-heat days projected 7→27/yr by 2055 (HVAC capex compounding) — expect insurance premiums to compound above CPI over the hold.
Questions for the listing agent
- What do current leases actually rent for vs. the listed asking? Can we see a recent rent roll and the last 12 months of T-12 income?
- It's been on market 101 days. Have you received any prior offers? Is the seller open to a 9% concession, seller financing, or rate buy-down credit?
- Built in 1977 — when were the roof, HVAC, electrical panel, plumbing, and water heater last replaced?
- What does the HOA fee cover, when was the last increase, and are there any pending special assessments or reserve-fund shortfalls?
- Any open or pending special assessments — roof, HVAC, plumbing, elevator, façade? What's the per-unit balance and payoff schedule, and is the seller paying it off at close or rolling it to the buyer?
- Why hasn't it sold? Are there any deal-killer items the seller is aware of (foundation, flood, title, zoning, code violations)?
- Is there a deadline driving the sale (1031 exchange, divorce, estate, relocation)? That informs how much negotiation room exists.
- Schools are A-rated — typically a magnet for longer-tenancy family renters. What's the average tenant stay here, and is there a school-zone premium baked into asking?
- The area grade is low — what's the realistic commute time and amenity access for the typical tenant pool here? Any planned neighborhood developments (good or bad) we should know about?
- What's the average days-on-market for RENTAL listings here right now (not sales)? A rising rental-DOM trend means longer vacancies and softer asking-rent achievability than the comps imply.
- What's the recent tenant-quality profile in this submarket — average credit score on applications, eviction rate, late-payment / NSF rate, and stable-employment percentage? A property-management company in the area should have these aggregated.
- How much new apartment / multifamily construction is in the pipeline within 1–3 miles? Heavy new supply (>2% of stock underway) typically softens rents 12–24 months out; light construction supports rent growth.
Investment metrics
- 1% rule
- 1.29% ✓
- Cap rate
- 5.36%
- Cash-on-cash
- -3.33%
- DSCR
- 0.85
- GRM
- 6.5
CMA / ARV
No comps found within radius.
Projected returns pro-forma
-3.0% appreciation · 0.33% rent growth · sell at horizon
- IRR
- -26.6%
- Equity multiple
- 0.13×
- Total profit
- $-39,506
- Equity at exit
- $24,289
- IRR
- -50.3%
- Equity multiple
- -0.41×
- Total profit
- $-64,367
- Equity at exit
- $14,085
Cash invested: $45,612 (down + closing). Projections, not guarantees.
Landlord ↔ Tenant lean methodology
- Overall (STATE)
- 87 Strongly Landlord-Friendly
- State Florida
- 87 Strongly Landlord-Friendly · R+3
- County
- — inherits STATE
- City
- — inherits STATE
ZIP-level market 33433
- Rents YoY
- 0.3%
- Active inventory
- 430
- Price-to-rent
- 6.5×
Monthly cashflow live
- Estimated rent
- $2,100 high interval (Pro) →
- Mortgage (P&I)
- −$854
- Tax from tax record
- −$264 /mo · $3,168/yr
- Insurance
- −$68
- HOA est. from 1 same-building comp
- −$599
- Vacancy / Maint / Mgmt
- −$441
- Net cashflow
- $-126
Break-even live
UW: 25.0% down · 7.5% · 30yr · 1.5% tax · 5.0% vac · 8.0% maint · 8.0% mgmt
Financing live
Cash to close
- Down payment
- $40,725
- Closing costs
- $4,887
- Reserves months
- —
- Total cash needed
- —
Loan-product check · same deal, 3 products live
Conventional
25% down · 7.5% · 30yr
- Down + closing
- —
- Monthly P&I
- —
- Monthly cashflow
- —
- DSCR
- —
- Eligible?
- —
Personal DTI + credit; lowest rate.
DSCR
20% down · 8.5% · 30yr
- Down + closing
- —
- Monthly P&I
- —
- Monthly cashflow
- —
- DSCR
- —
- Eligible?
- —
No personal income docs; deal must DSCR.
Hard money
10% down · 12.0% · 12mo
- Down + closing
- —
- Monthly P&I
- —
- Monthly cashflow
- —
- DSCR
- —
- Eligible?
- —
Short-term bridge; refi at stabilization.
Rent comps 40 comps
| Address | Beds | Baths | Sqft | Rent | $/sqft | DOM | Units | Dist |
|---|---|---|---|---|---|---|---|---|
| 8833 Bella Vista Dr #8833 Boca Raton, FL | 2.0 | 2.0 | 908 | $3,250 | $3.58 | 24d | 1 | 0.07mi |
| 20927 Sedgewick Dr Unit 20927 Boca Raton, FL | 2.0 | 1.0 | 908 | $1,950 | $2.15 | 24d | 1 | 0.13mi |
| 8732 Bella Vista Dr #42 Boca Raton, FL | 2.0 | 2.0 | 908 | $1,900 | $2.09 | 24d | 1 | 0.18mi |
| 20867 Wendall Ter Boca Raton, FL | 2.0 | 1.5 | 908 | $1,800 | $1.98 | 24d | 1 | 0.18mi |
| 8540 Chevy Chase Dr Unit 8540 Boca Raton, FL | 1.0 | 1.0 | 908 | $2,000 | $2.20 | 24d | 1 | 0.38mi |
| 20940 Uptown Ave Boca Raton, FL | 1.0–4.0 | 1.0–3.0 | 1227 | $2,650 | $2.16 | 1d | 50 | 0.78mi |
| 117 Brighton Dr Unit 117 Boca Raton, FL | 2.0 | 1.5 | 840 | $2,500 | $2.98 | 24d | 1 | 1.02mi |
| 119 Dorset Dr Unit 119 Boca Raton, FL | 1.0 | 1.0 | 600 | $1,400 | $2.33 | 24d | 1 | 1.08mi |
| 57 Dorset B Boca Raton, FL | 2.0 | 1.5 | 840 | $1,600 | $1.90 | 24d | 1 | 1.11mi |
| 22 Brighton Dr Unit 22 Boca Raton, FL | 1.0 | 1.0 | 600 | $1,300 | $2.17 | 8d | 1 | 1.12mi |
| 52 Dorset B Boca Raton, FL | 2.0 | 1.5 | 840 | $1,575 | $1.88 | 20d | 1 | 1.14mi |
| 186 Dorset E Boca Raton, FL | 2.0 | 1.5 | 835 | $1,550 | $1.86 | 24d | 1 | 1.14mi |
| 170 Dorset E Boca Raton, FL | 2.0 | 1.5 | 835 | $1,525 | $1.83 | 24d | 1 | 1.14mi |
| 82 Fanshaw Dr Unit 82 Boca Raton, FL | 1.0 | 1.5 | 702 | $1,250 | $1.78 | 24d | 1 | 1.15mi |
| 156 Brighton Dr Unit 156 Boca Raton, FL | 1.0 | 1.5 | 720 | $1,350 | $1.88 | 24d | 1 | 1.16mi |
| 251 Brighton Dr Unit 251 Boca Raton, FL | 1.0 | 1.5 | 720 | $1,450 | $2.01 | 8d | 1 | 1.16mi |
| 365 Brighton I Boca Raton, FL | 2.0 | 1.5 | 840 | $1,999 | $2.38 | 24d | 1 | 1.16mi |
| 84 Brighton B Boca Raton, FL | 2.0 | 1.5 | 840 | $1,600 | $1.90 | 24d | 1 | 1.16mi |
| 129 Brighton D Boca Raton, FL | 1.0 | 1.5 | 720 | $1,300 | $1.81 | 24d | 1 | 1.16mi |
| 365 Brighton I Unit 365 Boca Raton, FL | 2.0 | 1.5 | 840 | $1,899 | $2.26 | 24d | 1 | 1.16mi |
| 359 Brighton I Unit I Boca Raton, FL | 1.0 | 1.5 | 735 | $1,550 | $2.11 | 24d | 1 | 1.16mi |
| 321 Dorset Dr Boca Raton, FL | 1.0 | 1.5 | 720 | $1,590 | $2.21 | 24d | 1 | 1.18mi |
| 67 Fanshaw Dr Unit 670 Boca Raton, FL | 2.0 | 1.5 | 835 | $1,750 | $2.10 | 15d | 1 | 1.18mi |
| 335 Brighton Dr Unit 335 Boca Raton, FL | 2.0 | 1.5 | 840 | $1,990 | $2.37 | 24d | 1 | 1.18mi |
| 277 Brighton G Boca Raton, FL | 2.0 | 1.5 | 840 | $1,850 | $2.20 | 4d | 1 | 1.19mi |
| 314 Brighton H Unit H Boca Raton, FL | 1.0 | 1.5 | 720 | $1,500 | $2.08 | 14d | 1 | 1.19mi |
| 251 Brighton F Boca Raton, FL | 1.0 | 1.5 | 720 | $1,450 | $2.01 | 24d | 1 | 1.19mi |
| 1015 Cornwall Dr Unit 1015 Boca Raton, FL | 2.0 | 1.5 | 885 | $1,795 | $2.03 | 24d | 1 | 1.19mi |
| 1067 Cornwall D Boca Raton, FL | 1.0 | 1.5 | 751 | $1,600 | $2.13 | 24d | 1 | 1.19mi |
| 32 Fanshaw Dr Unit 32 Boca Raton, FL | 2.0 | 1.5 | 819 | $1,975 | $2.41 | 11d | 1 | 1.21mi |
| 9817 Arbor Oaks Ln Boca Raton, FL | 1.0–3.0 | 1.0–2.0 | 1110 | $2,095 | $1.89 | 1d | 27 | 1.21mi |
| 33 Fanshaw Dr Unit 33 Boca Raton, FL | 2.0 | 1.5 | 835 | $1,975 | $2.37 | 24d | 1 | 1.23mi |
| 4008 Cornwall a Boca Raton, FL | 1.0 | 1.5 | 738 | $1,600 | $2.17 | 24d | 1 | 1.25mi |
| 8 Fanshaw Dr Unit 8 Boca Raton, FL | 1.0 | 1.0 | 585 | $1,300 | $2.22 | 8d | 1 | 1.26mi |
| 4078 Exeter Unit E Boca Raton, FL | 2.0 | 1.5 | 861 | $1,475 | $1.71 | 3d | 1 | 1.28mi |
| 4085 Cornwall E Boca Raton, FL | 2.0 | 1.5 | 880 | $1,650 | $1.88 | 24d | 1 | 1.28mi |
| 3085 Cornwall E Boca Raton, FL | 2.0 | 1.5 | 880 | $1,699 | $1.93 | 24d | 1 | 1.28mi |
| 3082 Cornwall E Boca Raton, FL | 2.0 | 1.5 | 880 | $1,550 | $1.76 | 19d | 1 | 1.29mi |
| 4067 Ainslie Dr #4067 Boca Raton, FL | 2.0 | 1.5 | 861 | $1,815 | $2.11 | 24d | 1 | 1.30mi |
| 3070 Cornwall D Boca Raton, FL | 1.0 | 1.5 | 738 | $3,200 | $4.34 | 24d | 1 | 1.32mi |
HOA detail condo
- Monthly dues
- $0 · $0/yr
- Likely covers
- security
- Assessments
- None detected in remarks — confirm with the listing agent.
Listing history 23 events
-
2026-06-18days on market $162,900 Active 101 DOM
-
2026-06-17days on market $162,900 Active 100 DOM
-
2026-06-16days on market $162,900 Active 99 DOM
-
2026-06-15days on market $162,900 Active 98 DOM
-
2026-06-13days on market $162,900 Active 96 DOM
-
2026-06-09days on market $162,900 Active 92 DOM
-
2026-06-07days on market $162,900 Active 90 DOM
-
2026-06-04days on market $162,900 Active 87 DOM
-
2026-06-03days on market $162,900 Active 86 DOM
-
2026-06-01days on market $162,900 Active 84 DOM
-
2026-05-31days on market $162,900 Active 83 DOM
-
2026-03-17price $162,900
-
2026-03-09$169,000 Active
-
2022-12-08soldstatus $200,800
-
2022-06-22status Pending
-
2022-06-15price $225,000
-
2022-06-15status Active
-
2022-06-15historical
-
2022-06-14status Pending
-
2022-05-23$249,900 Active
-
2017-09-05soldstatus $110,000
-
2004-06-24soldstatus $105,000
-
1995-05-16soldstatus $43,000
ⓘ Source: listings_history table (triggers on properties + properties_extension) + one-shot
backfill from property_details.listing_events for pre-trigger history.
Tax reassessment forecast FL · Resets to sale price
- Current annual tax
- $3,168 · $264/mo
- Projected year-2 tax
- $3,168 · $264/mo
- Expected delta
- $0/yr ($0/mo · 0.0%)
ⓘ Screening estimate from a state-policy table — verify with the county assessor before closing.
Climate risk First Street
- Flood 1/10 Low FEMA zone X (unshaded) · 0% chance over 30 yrs
- Wildfire 1/10 Low
- Heat 9/10 Extreme 7 d/yr ≥107°F today · 27 d/yr by 30 yrs out
- Wind 10/10 Extreme 99% chance of damaging wind over 30 yrs
- Air quality 2/10 Low 2 unhealthy d/yr today · 2 by 30 yrs out
Nearby sold comps map
Loading sold comps map…
Walkable amenities ~0.75 mi
Loading nearby amenities…
Taxation est. · year 1
- Rental income
- $25,196
- − Mortgage interest
- −$9,125
- − Property taxes
- −$3,168
- − Insurance
- −$814
- − Repairs & maintenance
- −$2,016
- − Management
- −$2,016
- − HOA
- −$7,188
- − Depreciation
- −$4,739
- Taxable loss
- −$3,870
- Est. tax savings @ 24.0%
- +$929
- After-tax cash flow
- $-588/yr
For passive investors: Depreciation is non-cash, so a rental often shows a tax loss while cash-flowing — sheltering income. Rental losses are passive: they offset passive income freely, and up to $25,000/yr can offset ordinary (W-2) income if you actively participate and your MAGI is under $100k (phasing out to $0 by $150k); unused losses carry forward. On sale, claimed depreciation is recaptured at up to 25%, and gains may owe capital-gains tax (a 1031 exchange can defer both). Figures are a year-1 estimate at your 24.0% rate — not tax advice; consult a CPA.
Schools (NCES district)
- District
- Palm Beach
- NCES district ID
- 1201500
- Math proficiency
- 46% ▼ -16.00%
- Reading proficiency
- 53% ▼ -4.00%
- Median HH income
- $53,943
- Composite
- 42.72/100
- National rank
- #3160
- State rank
- #34 of 73 in FL
Livability — Boca Raton
- Score
- 77/100
- State rank
- #192
- US rank
- #3070
Category grades
Schools grade is shown separately in the Schools card above.
Census & demographics
- County
- Palm Beach County · 1,438,312 people
- City population
- 250,102
- Metro
- Miami-Fort Lauderdale-Pompano Beach, FL
- Population (ZIP)
- 47,005
- Household income
- $84,091
- Rent vs Own
- Severe rent burden
- 2900.0
Population outlook (Palm Beach County) Hauer SSP2
- Today (2025)
- 1,637,487 people
- By 2030
- 1,743,255 · +6.5%
- By 2040
- 1,948,712 · +19.0%
- By 2050
- 2,132,979 · +30.3%
- By 2075
- 2,530,027 · +54.5%
- By 2100
- 2,706,979 · +65.3%
Race, ethnicity, and origin ACS 2023
- Neighborhood character
- Predominantly White (68%)
- Race & ethnicity
- White 68% Hispanic / Latino 18% Two or more races 15% Asian 4% Black 2%
- Hispanic origin (detail)
- Mexican 1% Puerto Rican 2% Cuban 2% Dominican 1%
- Common ancestry
- Romanian 6% Scotch-Irish 5% Russian 3%
- Foreign-born
- 27% · Canada, Jamaica, China
- Languages at home
- 65% English-only · Spanish 15% Other Indo-European 10% Russian/Polish/Slavic 3%
Political lean MEDSL · Palm Beach
- 2024 margin
- Toss-up / Even · D 50.0% · R 49.2%
- 2008→2024 swing
- -22.1pp toward R · 2008: 22.9pp · 2024: 0.8pp
- All cycles
- 2024: D+0.8 2020: D+12.8 2016: D+15.3 2012: D+17.0 2008: D+22.9
Not yet ingested
- Civics
- —
Market trends
- HPI YoY
- ▼ -227.85%
- Current HPI
- 306.738
- Rent YoY
- ▲ 0.33%
- Metro
- Miami-Fort Lauderdale-Pompano Beach, FL
- State GDP YoY
- ▲ 3.28%
- F500 in state
- 36
Industry mix (Fortune 500 HQ in FL)
| Industry | F500 HQs | Revenue |
|---|---|---|
| Industrial Technology | 2 | $29B |
|
||
| Insurance | 2 | $17B |
|
||
| Retail | 1 | $60B |
|
||
| Technology Distribution | 1 | $58B |
|
||
| Homebuilding | 1 | $35B |
|
||
| Technology Manufacturing | 1 | $35B |
|
||
Price history
+278.8% since first listed12 events — show timeline
- 2026-03-17 Price Changed $162,900 ForSaleByOwner.com
- 2026-03-09 Listed $169,000 ForSaleByOwner.com
- 2022-12-08 Sold (Public Records) $200,800 Public Records
- 2022-06-22 Pending — Beaches MLS
- 2022-06-15 Price Changed $225,000 Beaches MLS
- 2022-06-15 Relisted — Beaches MLS
- 2022-06-15 Listing Removed — Beaches MLS
- 2022-06-14 Pending — Beaches MLS
- 2022-05-23 Listed $249,900 Beaches MLS
- 2017-09-05 Sold (Public Records) $110,000 Public Records
- 2004-06-24 Sold (Public Records) $105,000 Public Records
- 1995-05-16 Sold (Public Records) $43,000 Public Records
Property tax history
+6.8%/yrLatest (2025): $3,168 · -10.7% YoY. Source: county tax records.
Cash-flow waterfall
monthlySold comps — $/sqft
last 12 mo · ≤1 miLoading sold comps…