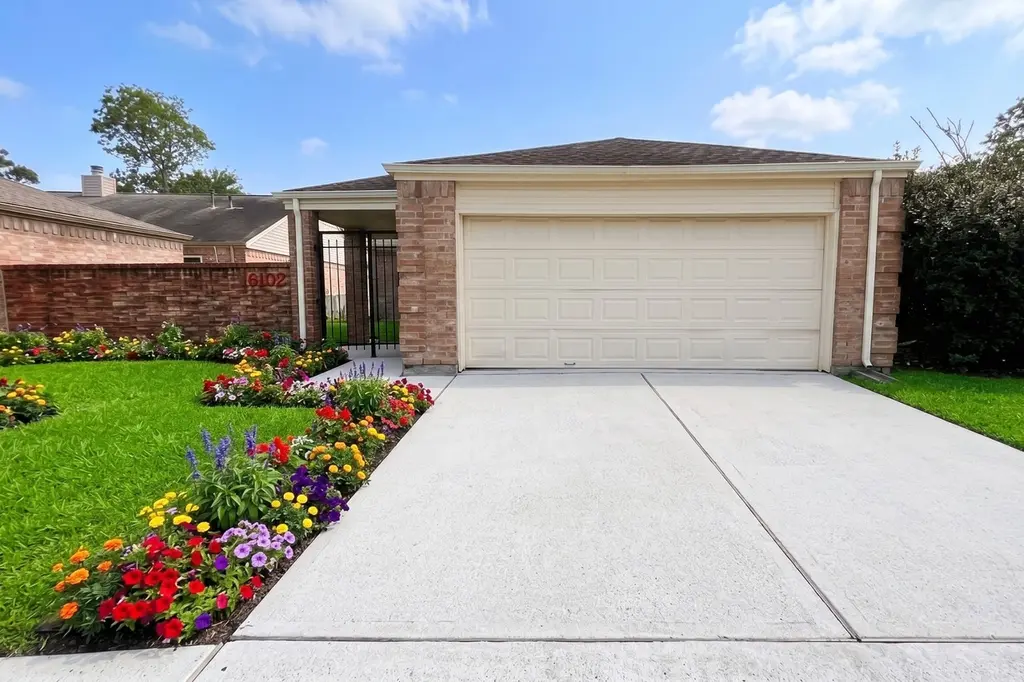
18527 Trail Bend Ln · Houston, TX
Flood risk 3/10 · Minor
- FEMA flood zone
- X (unshaded)
- Chance of flooding over 30 yrs
- 0.2%
- Est. flood insurance / yr
- $507 – $1,088
Fire risk 4/10 · Minor
- Est. fire insurance / yr
- $1,222 – $2,270
Heat risk 9/10 · Severe
- Hot days now (above 110°F)
- 7 days/yr
- Hot days in 30 yrs
- 23 days/yr
Wind risk 8/10 · Major
- Chance of severe wind over 30 yrs
- 99.0%
Air-quality risk 2/10 · Minimal
- Unhealthy air days now
- 2 days/yr
- Unhealthy air days in 30 yrs
- 2 days/yr
Risk factors via First Street. Map © Google.
Why this score? — see what drove the C+ grade
The composite is a weighted blend of 9 inputs, each scored 0–100. Each bar is that input's sub-score; the figure is the points it added to the 100-point composite (weight × sub-score).
- Cash flow +15.8/30.0
- ARV discount +15.0/15.0
- 1% rule +6.4/10.0
- Schools +5.7/10.0
- DSCR +4.9/10.0
- Appreciation +4.3/10.0
- Livability +3.7/5.0
- Condition / age +2.5/5.0
- Rent growth +1.8/5.0
$150,000
🖨 Deal sheet 📄 Offer letter ✓ Due diligence
Listing remarks MLS
BEAUTIFUL PATIO HOME IN EXCELLENT AREA. GOLF COURSE VERY CLOSE BY, SHOPPING NEAR, EASY TO GET TO I-10, LOTS OF NATURAL LIGHT, AREA POOL AND PRICED TO SELL QUICKLY. THIS IS A SHORT SALE LENDER WILL APPROVE OFFERS.
Key facts
- 4,229 sq ft lot
- 2 garage spots
- Community pool
Property features AI
Finance
- HOA & community: Community association (Wood Fern CAI / Inframark); Annual association fee of $520 (includes clubhouse and common areas); Association amenities: clubhouse, park, pool; Community features: community pool, curbs
Exterior
- Parking: Attached garage with 2 spaces
- Security: Smoke detector(s)
- Utilities: Public water; Public sewer
- Home design: Residential property; Built in 1982; Slab foundation; Composition roof
- Construction: Brick and wood siding construction
- Exterior features: Covered patio; Deck; Porch; Patio; Private yard; Fenced backyard; Association pool
Interior
- Kitchen: Kitchen on the first floor; Pantry
- Bedrooms: Primary bedroom on the first floor (12 x 15); Additional bedroom on the first floor (10 x 10)
- Flooring: Tile; Vinyl
- Bathrooms: 2 full bathrooms; Primary bathroom on the first floor
- Heating & cooling: Central heating (gas); Central air (electric)
- Interior features: High ceilings; Kitchen/family room combo; Pantry; Tub with shower; Ceiling fans; Wood-burning fireplace (1)
- Laundry & utility: Washer hookup; Electric dryer hookup
Neighborhood map
What this means for you Summary
Snapshot
- This is a 2-bed/2.0-bath single-family listed at $150k.
Deal economics
- At list price, monthly cash flow is $69 ($831/yr) — positive.
- The deal already cash-flows at list — no discount required.
- Meets the 1% rule at list price ($2k rent vs $150k).
- Cap rate 6.8% vs local median 3.2% in Houston — top-decile yield for the area; either an underpriced asset or a hidden risk that comps aren't pricing in. Stress-test before assuming the spread holds.
Location & tenants
- Location reads 74/100 on livability (#184 in TX, #4,771 nationally) — a middle-class / working-renter tenant base. Strengths: amenities A+, cost of living A+, housing A+; Watch: crime F.
- Katy ISD (suburban): math 61% / reading 63% proficiency, ranked #29 of 826 in TX (top 4%) — acceptable for families but not a draw, mixed tenant base, ~2y average lease.
- Zoned schools: Mayde Creek H S (math 42% / reading 54%, grade D, #571 of 1,632 statewide, top 36%, 2,940 students, 78% FRL) — zoned schools average 78% FRL vs 27% district-wide (51 pts higher); higher-poverty schools than district average — tighter screening recommended.
- Zoned-school proficiency averages 48% at this address vs 62% district-wide (-14 pts) — the specific schools serving this property underperform the Katy ISD average; the district grade overstates school quality for this exact location.
- Market conditions: Rents soft (-2.9%/yr); 494 active listings in the ZIP; 21 comparable units currently listed for rent nearby; rentals leasing fast (median 11d on market — plan ~1-2 weeks tenant-placement turnaround); solid renter incomes; 29,883 units permitted in Harris County in 2024 (8,621 in 5+ unit buildings).
Forward outlook
- Local home prices are declining (-1.4%/yr); year-one equity from $1k of loan paydown is wiped out by about $2k of value loss. Plan a longer hold.
- Harris County population projected at +47% by 2050 — long-run rental-demand tailwind backs the buy-and-hold thesis.
Negotiation context
- Only 11 days on market — expect competitive offers; lowballing is unlikely to land.
- 3 sale attempts since 16y ago with the ask held roughly flat each time — persistent listings suggest the price (not the market) is what's stuck; bring a comps-based counter.
Risks & watch-outs
- Watch-outs: property tax is 3.1% of price.
- Climate carrying-cost: severe wind risk, 99% chance of damaging wind over 30y; extreme-heat days projected 7→23/yr by 2055 (HVAC capex compounding) — expect insurance premiums to compound above CPI over the hold.
Questions for the listing agent
- Property tax is high relative to price — has the assessment been appealed recently, and will the sale trigger a re-assessment?
- What does the HOA fee cover, when was the last increase, and are there any pending special assessments or reserve-fund shortfalls?
- Is there a deadline driving the sale (1031 exchange, divorce, estate, relocation)? That informs how much negotiation room exists.
- Schools are D-rated, which usually means shorter tenancies and higher turnover. Who's the typical renter profile here, and what's been the actual vacancy rate?
- Crime grade is F in this area — have there been break-ins, vandalism, or insurance claims at this property in the last 3 years? What carrier currently insures it and at what premium?
- What's the average days-on-market for RENTAL listings here right now (not sales)? A rising rental-DOM trend means longer vacancies and softer asking-rent achievability than the comps imply.
- What's the recent tenant-quality profile in this submarket — average credit score on applications, eviction rate, late-payment / NSF rate, and stable-employment percentage? A property-management company in the area should have these aggregated.
- How much new for-sale + rental construction is in the pipeline within 1–3 miles? Heavy new supply typically softens prices + rents 12–24 months out; constrained supply supports both.
Investment metrics
- 1% rule
- 1.14% ✓
- Cap rate
- 6.85%
- Cash-on-cash
- 1.98%
- DSCR
- 1.09
- GRM
- 7.3
CMA / ARV
- ARV (median comp)
- $233,013
- List price
- $150,000
- Delta
- -35.63%
- Verdict
- UNDERPRICED
- Comps
- 20 within 1.0 mi
Show comp detail 9 sales within ~0.75 mi
| Address | Dist | Beds/Ba | Sqft | Sold | Price | $/sf | Match |
|---|---|---|---|---|---|---|---|
| 18542 Trail Bend Ln | 0.05mi | 2/2.0 | 1,152 (+6%) | 1mo | $210,000 | $182 | 87 |
| 18558 Trail Bend Ln | 0.08mi | 3/2.0 (+1) | 1,152 (+6%) | 5mo | $205,000 | $178 | 77 |
| 18514 Trail Bend Ln | 0.04mi | 2/2.0 | 1,152 (+6%) | 16mo | $238,000 | $207 | 75 |
| 18558 Denise Dl | 0.12mi | 2/2.0 | 1,217 (+12%) | 11mo | $204,900 | $168 | 66 |
| 18703 Clover Glen Ln | 0.27mi | 3/2.0 (+1) | 1,158 (+6%) | 10mo | $215,000 | $186 | 64 |
| 18730 Shannon Glen Ln | 0.27mi | 3/1.0 (+1) | 1,074 (-2%) | 18mo | $225,000 | $209 | 61 |
| 18715 Denise Dale Ln | 0.22mi | 3/2.0 (+1) | 1,175 (+8%) | 14mo | $240,000 | $204 | 60 |
| 18546 Glen Briar Ln | 0.06mi | 2/2.0 | 1,234 (+13%) | 20mo | $249,900 | $203 | 58 |
| 18806 Denise Dale Ln | 0.35mi | 3/1.5 (+1) | 1,193 (+9%) | 17mo | $195,000 | $163 | 47 |
Match score weights: distance 35% · size 25% · config 20% · recency 20%. Top-matched comps best support the ARV.
Projected returns pro-forma
-1.4% appreciation · 0.0% rent growth · sell at horizon
- IRR
- -8.4%
- Equity multiple
- 0.66×
- Total profit
- $-14,394
- Equity at exit
- $33,375
- IRR
- -5.0%
- Equity multiple
- 0.62×
- Total profit
- $-16,030
- Equity at exit
- $32,686
Cash invested: $42,000 (down + closing). Projections, not guarantees.
Landlord ↔ Tenant lean methodology
- Overall (STATE)
- 87 Strongly Landlord-Friendly
- State Texas
- 87 Strongly Landlord-Friendly · R+5
- County
- — inherits STATE
- City
- — inherits STATE
ZIP-level market 77084
- Home prices YoY
- -0.6%
- Rents YoY
- -2.9%
- Active inventory
- 494
- Price-to-rent
- 7.3×
Monthly cashflow live
- Estimated rent
- $1,715 high interval (Pro) →
- Mortgage (P&I)
- −$787
- Tax from tax record
- −$394 /mo · $4,723/yr
- Insurance
- −$62
- HOA
- −$43
- Vacancy / Maint / Mgmt
- −$360
- Net cashflow
- $69
Break-even live
UW: 25.0% down · 7.5% · 30yr · 1.5% tax · 5.0% vac · 8.0% maint · 8.0% mgmt
Financing live
Cash to close
- Down payment
- $37,500
- Closing costs
- $4,500
- Reserves months
- —
- Total cash needed
- —
Loan-product check · same deal, 3 products live
Conventional
25% down · 7.5% · 30yr
- Down + closing
- —
- Monthly P&I
- —
- Monthly cashflow
- —
- DSCR
- —
- Eligible?
- —
Personal DTI + credit; lowest rate.
DSCR
20% down · 8.5% · 30yr
- Down + closing
- —
- Monthly P&I
- —
- Monthly cashflow
- —
- DSCR
- —
- Eligible?
- —
No personal income docs; deal must DSCR.
Hard money
10% down · 12.0% · 12mo
- Down + closing
- —
- Monthly P&I
- —
- Monthly cashflow
- —
- DSCR
- —
- Eligible?
- —
Short-term bridge; refi at stabilization.
Rent comps 21 comps
| Address | Beds | Baths | Sqft | Rent | $/sqft | DOM | Units | Dist |
|---|---|---|---|---|---|---|---|---|
| 18747 Denise Dale Ln Houston, TX | 3.0 | 2.0 | 1136 | $1,695 | $1.49 | 5d | 1 | 0.29mi |
| 3740 Barker Cypress Rd Houston, TX | 1.0–2.0 | 1.0–2.0 | 933 | $2,070 | $2.22 | 1d | 250 | 0.34mi |
| 3450 Barker Cypress Rd Houston, TX | 1.0–3.0 | 1.0–2.0 | 826 | $1,434 | $1.74 | 1d | 17 | 0.73mi |
| 3450 Barker Cypress Rd Houston, TX | 1.0–2.0 | 1.0–2.0 | 742 | $1,500 | $2.02 | 5d | 204 | 0.73mi |
| 4211 Falcon Meadow Dr Katy, TX | 3.0 | 2.0 | 1436 | $1,795 | $1.25 | 24d | 1 | 1.01mi |
| 19138 Morton Rd Unit TOBC2 Houston, TX | 2.0 | 2.0 | 1091 | $1,745 | $1.60 | 2d | 1 | 1.10mi |
| 3199 Eagle Ridge Way Houston, TX | 1.0 | 1.0 | 826 | $1,051 | $1.27 | 24d | 1 | 1.11mi |
| 4607 Cypress Colony Ln Katy, TX | 3.0 | 2.0 | 1356 | $1,950 | $1.44 | 43d | 1 | 1.13mi |
| 2926 Barker Cypress Rd Unit 3165 Houston, TX | 3.0 | 2.0 | 1424 | $2,157 | $1.51 | 2d | 1 | 1.26mi |
| 2926 Barker Cypress Rd Unit 3047 Houston, TX | 3.0 | 2.0 | 1424 | $2,200 | $1.54 | 11d | 1 | 1.26mi |
| 2926 Barker Cypress Rd Unit 2165 Houston, TX | 2.0 | 2.0 | 1250 | $1,937 | $1.55 | 2d | 1 | 1.26mi |
| 2926 Barker Cypress Rd Unit 2959 Houston, TX | 3.0 | 2.0 | 1424 | $2,110 | $1.48 | 43d | 1 | 1.29mi |
| 2926 Barker Cypress Rd Unit 3174 Houston, TX | 3.0 | 2.0 | 1424 | $2,189 | $1.54 | 10d | 1 | 1.29mi |
| 2926 Barker Cypress Rd Unit 2174 Houston, TX | 2.0 | 2.0 | 1250 | $1,969 | $1.58 | 10d | 1 | 1.29mi |
| 2926 Barker Cypress Rd Unit 2963 Houston, TX | 2.0 | 2.0 | 1250 | $1,820 | $1.46 | 43d | 1 | 1.29mi |
| 2937 Barker Cypress Rd Houston, TX | 2.0 | 2.0 | 1138 | $1,456 | $1.28 | 43d | 1 | 1.32mi |
| 19087 Windy Stone Dr Unit EKH2 Katy, TX | 2.0 | 2.0 | 827 | $1,472 | $1.78 | 11d | 1 | 1.34mi |
| 19087 Windy Stone Dr Unit EKH1 Katy, TX | 1.0 | 1.0 | 726 | $1,282 | $1.77 | 11d | 1 | 1.34mi |
| 2931 Barker Cypress Rd Houston, TX | 1.0–3.0 | 1.0–2.0 | 1065 | $1,383 | $1.30 | 1d | 20 | 1.35mi |
| 2926 Barker Cypress Rd Houston, TX | 2.0 | 2.0 | 1091 | $1,745 | $1.60 | 12d | 1 | 1.37mi |
| 4711 Meadowbloom Ln Unit A2 Katy, TX | 3.0 | 2.0 | 1355 | $1,650 | $1.22 | 43d | 1 | 1.37mi |
HOA detail
- Monthly dues
- $43 · $516/yr
- Likely covers
- pool
Listing history 12 events
-
2026-05-14$150,000 Active 743-char remark
-
2026-04-30historical $150,000 743-char remark
-
2026-04-20historical
-
2025-04-23price $175,000
-
2025-03-10price $190,000
-
2025-03-01$210,000 Active
-
2011-03-08soldstatus
-
2011-03-04soldstatus
Show marketing remark (212 chars)
BEAUTIFUL PATIO HOME IN EXCELLENT AREA. GOLF COURSE VERY CLOSE BY, SHOPPING NEAR, EASY TO GET TO I-10, LOTS OF NATURAL LIGHT, AREA POOL AND PRICED TO SELL QUICKLY. THIS IS A SHORT SALE LENDER WILL APPROVE OFFERS.
-
2011-01-25historical
Show marketing remark (212 chars)
BEAUTIFUL PATIO HOME IN EXCELLENT AREA. GOLF COURSE VERY CLOSE BY, SHOPPING NEAR, EASY TO GET TO I-10, LOTS OF NATURAL LIGHT, AREA POOL AND PRICED TO SELL QUICKLY. THIS IS A SHORT SALE LENDER WILL APPROVE OFFERS.
-
2010-12-16$49,900
Show marketing remark (212 chars)
BEAUTIFUL PATIO HOME IN EXCELLENT AREA. GOLF COURSE VERY CLOSE BY, SHOPPING NEAR, EASY TO GET TO I-10, LOTS OF NATURAL LIGHT, AREA POOL AND PRICED TO SELL QUICKLY. THIS IS A SHORT SALE LENDER WILL APPROVE OFFERS.
-
2008-10-27soldstatus
-
1988-01-02soldstatus
ⓘ Source: listings_history table (triggers on properties + properties_extension) + one-shot
backfill from property_details.listing_events for pre-trigger history.
Tax reassessment forecast TX · Resets to sale price
- Current annual tax
- $4,723 · $394/mo
- Projected year-2 tax
- $4,723 · $394/mo
- Expected delta
- $0/yr ($0/mo · 0.0%)
ⓘ Screening estimate from a state-policy table — verify with the county assessor before closing.
Climate risk First Street
- Flood 3/10 Moderate FEMA zone X (unshaded) · 20% chance over 30 yrs
- Wildfire 4/10 Moderate
- Heat 9/10 Extreme 7 d/yr ≥110°F today · 23 d/yr by 30 yrs out
- Wind 8/10 Severe 99% chance of damaging wind over 30 yrs
- Air quality 2/10 Low 2 unhealthy d/yr today · 2 by 30 yrs out
Nearby sold comps map
Loading sold comps map…
Walkable amenities ~0.75 mi
Loading nearby amenities…
Taxation est. · year 1
- Rental income
- $20,581
- − Mortgage interest
- −$8,402
- − Property taxes
- −$4,723
- − Insurance
- −$750
- − Repairs & maintenance
- −$1,647
- − Management
- −$1,647
- − HOA
- −$516
- − Depreciation
- −$4,364
- Taxable loss
- −$1,466
- Est. tax savings @ 24.0%
- +$352
- After-tax cash flow
- $1,183/yr
For passive investors: Depreciation is non-cash, so a rental often shows a tax loss while cash-flowing — sheltering income. Rental losses are passive: they offset passive income freely, and up to $25,000/yr can offset ordinary (W-2) income if you actively participate and your MAGI is under $100k (phasing out to $0 by $150k); unused losses carry forward. On sale, claimed depreciation is recaptured at up to 25%, and gains may owe capital-gains tax (a 1031 exchange can defer both). Figures are a year-1 estimate at your 24.0% rate — not tax advice; consult a CPA.
Schools (NCES district)
- District
- Katy ISD
- NCES district ID
- 4825170
- Math proficiency
- 61% ▼ -7.00%
- Reading proficiency
- 63% ▼ -3.00%
- Median HH income
- $90,312
- Composite
- 56.59/100
- National rank
- #1146
- State rank
- #29 of 826 in TX
Livability — Houston
- Score
- 74/100
- State rank
- #184
- US rank
- #4771
Category grades
Schools grade is shown separately in the Schools card above.
Census & demographics
- County
- Harris County · 4,702,590 people
- City population
- 3,226,434
- Metro
- Houston-The Woodlands-Sugar Land, TX
- Population (ZIP)
- 110,217
- Household income
- $80,575
- Rent vs Own
- Severe rent burden
- 3257.0
Population outlook (Harris County) Hauer SSP2
- Today (2025)
- 5,571,493 people
- By 2030
- 6,089,821 · +9.3%
- By 2040
- 7,142,806 · +28.2%
- By 2050
- 8,185,864 · +46.9%
- By 2075
- 10,574,329 · +89.8%
- By 2100
- 12,109,958 · +117.4%
Race, ethnicity, and origin ACS 2023
- Neighborhood character
- Diverse neighborhood (Simpson 0.69)
- Race & ethnicity
- Hispanic / Latino 48% Two or more races 22% White 22% Black 16% Asian 11% Native American 2%
- Hispanic origin (detail)
- Mexican 27% Cuban 2%
- Common ancestry
- Lithuanian 1% Romanian 1% Slovak 1%
- Foreign-born
- 32% · Canada, Vietnam, Jamaica
- Languages at home
- 48% English-only · Spanish 38% Other Indo-European 5% Vietnamese 3%
Political lean MEDSL · Harris
- 2024 margin
- Lean D (+5.5) · D 52.0% · R 46.4% · Other 1.6%
- 2008→2024 swing
- +3.9pp toward D · 2008: 1.6pp · 2024: 5.5pp
- All cycles
- 2024: D+5.5 2020: D+13.3 2016: D+12.4 2012: D+0.1 2008: D+1.6
Not yet ingested
- Civics
- —
Market trends
- HPI YoY
- ▼ -1.40%
- Current HPI
- 251.8474
- Rent YoY
- ▼ -2.89%
- Metro
- Houston-The Woodlands-Sugar Land, TX
- State GDP YoY
- ▲ 3.95%
- F500 in state
- 110
Industry mix (Fortune 500 HQ in TX)
| Industry | F500 HQs | Revenue |
|---|---|---|
| Energy | 16 | $1,198B |
|
||
| Technology | 5 | $198B |
|
||
| Engineering / Construction | 4 | $72B |
|
||
| Energy Services | 3 | $60B |
|
||
| Utilities | 3 | $41B |
|
||
| Healthcare | 2 | $330B |
|
||
Price history
+200.6% since first listed13 events — show timeline
- 2026-05-25 Pending — HARMLS
- 2026-05-14 Listed $150,000 HARMLS
- 2026-04-30 Coming Soon $150,000 HARMLS
- 2026-04-20 Listing Removed — HARMLS
- 2025-04-23 Price Changed $175,000 HARMLS
- 2025-03-10 Price Changed $190,000 HARMLS
- 2025-03-01 Listed $210,000 HARMLS
- 2011-03-08 Sold (Public Records) — Public Records
- 2011-03-04 Sold (MLS) — HARMLS
- 2011-01-25 Listing Removed — HARMLS
- 2010-12-16 Listed $49,900 HARMLS
- 2008-10-27 Sold (Public Records) — Public Records
- 1988-01-02 Sold (Public Records) — Public Records
Property tax history
+3.2%/yrLatest (2025): $4,723 · +11.0% YoY. Source: county tax records.
Cash-flow waterfall
monthlySold comps — $/sqft
last 12 mo · ≤1 miLoading sold comps…