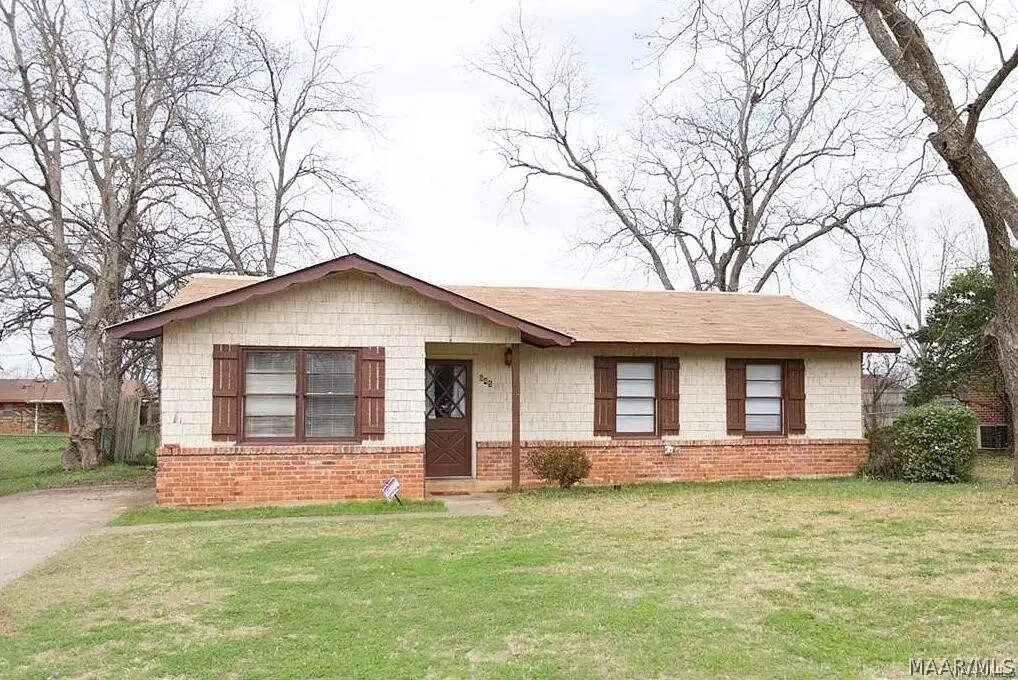
645 Groveland Dr · Montgomery, AL
Flood risk 1/10 · Minimal
- FEMA flood zone
- X (unshaded)
- Chance of flooding over 30 yrs
- 0.0%
- Est. flood insurance / yr
- $507 – $1,088
Fire risk 4/10 · Minor
- Est. fire insurance / yr
- $916 – $1,700
Heat risk 7/10 · Major
- Hot days now (above 107°F)
- 7 days/yr
- Hot days in 30 yrs
- 20 days/yr
Wind risk 8/10 · Major
- Chance of severe wind over 30 yrs
- 80.0%
Air-quality risk 4/10 · Minor
- Unhealthy air days now
- 4 days/yr
- Unhealthy air days in 30 yrs
- 5 days/yr
Risk factors via First Street. Map © Google.
Why this score? — see what drove the B+ grade
The composite is a weighted blend of 9 inputs, each scored 0–100. Each bar is that input's sub-score; the figure is the points it added to the 100-point composite (weight × sub-score).
- Cash flow +30.0/30.0
- ARV discount +15.0/15.0
- 1% rule +10.0/10.0
- DSCR +10.0/10.0
- Rent growth +3.2/5.0
- Livability +3.2/5.0
- Condition / age +2.5/5.0
- Schools +1.7/10.0
- Appreciation +0.0/10.0
$99,000
🖨 Deal sheet (PDF) 📄 Offer letter ✓ Due diligence
Listing remarks MLS
This pre-loved home is situated in the quiet established neighborhood of Pecan Grove Estates. Surprisingly, this home boasts of 2009 square feet, which features an entranceway foyer, a sunken living room, a laundry room, an eat-in kitchen, a crafts room, a multi-purpose bonus room, a family room, a master bedroom, that includes a full bath with a double vanity and a walk-in closet. Also, there are 3 additional bedrooms and another full bath. The backyard has an ample sized patio and a full fence. This quaint home is in close proximity to Gunter Air Force Base. It is just minutes away from Faulkner University, Auburn University in Montgomery, and Alabama State University, as well as, several 2-year colleges.
Key facts
- 0.24 acre lot
- Parking
- Built 1971
Property features AI
Exterior
- Parking: Driveway
- Utilities: Electricity available; Public water; Public sewer
- Home design: Single-story home; Brick construction; Slab foundation
- Construction: Brick exterior; Slab foundation; Built year source: Owner
- Exterior features: Porch
Interior
- Kitchen: Kitchen on the first floor
- Bedrooms: Three bedrooms on the first floor
- Flooring: Carpet
- Bathrooms: Two full bathrooms on the first floor
- Heating & cooling: Central heating (electric); Central air conditioning (electric)
- Interior features: One fireplace; Carpet flooring
- Laundry & utility: Washer included; No hot water (listed as No Hot Water)
Neighborhood map
What this means for you Summary
Snapshot
- This is a 4-bed/2.0-bath single-family listed at $99k.
Deal economics
- At list price, monthly cash flow is $581 ($7k/yr) — positive.
- The deal already cash-flows at list — no discount required.
- Meets the 1% rule at list price ($2k rent vs $99k).
- Recommended offer: $98k (1.5% below list) — sets the bar for market timing.
- Cap rate 13.3% vs local median 6.0% in Montgomery — top-decile yield for the area; either an underpriced asset or a hidden risk that comps aren't pricing in. Stress-test before assuming the spread holds.
Location & tenants
- Location reads 65/100 on livability (#138 in AL) — a middle-class / working-renter tenant base. Strengths: cost of living A+, housing A+; Watch: schools C-, employment D, crime F.
- Montgomery County (urban): math 9% / reading 31% proficiency, ranked #106 of 129 in AL (top 82%) — low school quality limits family demand, transient renter base, plan for 1-2y turnover; 70% free/reduced lunch — lower-income household profile, screen leases tightly.
- Market conditions: Rents rising (+2.6%/yr); 209 active listings in the ZIP; 26 comparable units currently listed for rent nearby; rentals at typical pace (median 22d on market — plan ~3-4 weeks tenant-placement turnaround); 46% of comp listings sitting > 30 days — soft ceiling on asking rent; 460 units permitted in Montgomery County in 2024 (37 in 5+ unit buildings).
- This rent runs 30% of the median local income ($59k/yr) — at the standard rent-burdened threshold; future hikes will face affordability resistance.
Forward outlook
- Local home prices are declining (-3.0%/yr); year-one equity from $684 of loan paydown is wiped out by about $3k of value loss. Plan a longer hold.
- Montgomery County population projected to shrink 8% by 2050 — rents likely to lag national; underwrite the cash flow, not the appreciation.
- At projected returns (-3.0% appreciation + 2.6% rent growth), your $28k cash investment doubles in ~5 years — after that, you're playing with house money.
Negotiation context
- It's been on market 19 days — a 2% lower offer ($98k) is reasonable based on typical stale-listing flexibility.
- 6 sale attempts since 25y ago with the ask held roughly flat each time — persistent listings suggest the price (not the market) is what's stuck; bring a comps-based counter.
- Current owner paid $75k; 32% above their basis — modest negotiation headroom, anchor on the comps not their cost.
Risks & watch-outs
- Climate carrying-cost: severe wind risk, 80% chance of damaging wind over 30y; extreme-heat days projected 7→20/yr by 2055 (HVAC capex compounding) — expect insurance premiums to compound above CPI over the hold.
Questions for the listing agent
- Built in 1971 — when were the roof, HVAC, electrical panel, plumbing, and water heater last replaced?
- Is there a deadline driving the sale (1031 exchange, divorce, estate, relocation)? That informs how much negotiation room exists.
- Crime grade is F in this area — have there been break-ins, vandalism, or insurance claims at this property in the last 3 years? What carrier currently insures it and at what premium?
- What's the average days-on-market for RENTAL listings here right now (not sales)? A rising rental-DOM trend means longer vacancies and softer asking-rent achievability than the comps imply.
- What's the recent tenant-quality profile in this submarket — average credit score on applications, eviction rate, late-payment / NSF rate, and stable-employment percentage? A property-management company in the area should have these aggregated.
- How much new for-sale + rental construction is in the pipeline within 1–3 miles? Heavy new supply typically softens prices + rents 12–24 months out; constrained supply supports both.
Investment metrics
- 1% rule
- 1.52% ✓
- Cap rate
- 13.34%
- Cash-on-cash
- 25.17%
- DSCR
- 2.12
- GRM
- 5.5
CMA / ARV
- ARV (on-the-fly)
- $191,400
- Comps found
- 12
Show comp detail 12 sales within ~0.75 mi
| Address | Dist | Beds/Ba | Sqft | Sold | Price | $/sf | Match |
|---|---|---|---|---|---|---|---|
| 708 Maryethel Dr | 0.52mi | 4/2.0 | 1,616 (-7%) | 1mo | $178,000 | $110 | 63 |
| 713 Amity Ln | 0.70mi | 4/2.0 | 1,696 (-2%) | 2mo | $135,000 | $80 | 62 |
| 356 Avon Rd | 0.47mi | 3/2.0 (-1) | 1,652 (-5%) | 3mo | $195,000 | $118 | 62 |
| 556 Shady Grove Dr | 0.33mi | 4/2.0 | 1,978 (+14%) | 1mo | $128,000 | $65 | 61 |
| 749 Amity Ln | 0.70mi | 4/2.0 | 1,767 (+2%) | 8mo | $190,000 | $108 | 59 |
| 705 Planters Rd | 0.18mi | 3/2.0 (-1) | 1,520 (-13%) | 9mo | $150,000 | $99 | 58 |
| 4500 Deerfield Ct | 0.68mi | 3/2.0 (-1) | 1,726 (-1%) | 5mo | $199,900 | $116 | 58 |
| 408 Glade Park Dr | 0.42mi | 3/2.0 (-1) | 1,579 (-9%) | 4mo | $168,000 | $106 | 57 |
| 4515 Ray Dr | 0.72mi | 3/2.0 (-1) | 1,676 (-4%) | 3mo | $201,000 | $120 | 53 |
| 4504 Charingwood Ct | 0.58mi | 3/2.0 (-1) | 1,641 (-6%) | 10mo | $189,000 | $115 | 50 |
| 5737 Darien Dr | 0.73mi | 3/2.0 (-1) | 1,511 (-13%) | 3mo | $172,000 | $114 | 36 |
| 691 Dunbarton Rd | 0.66mi | 3/2.0 (-1) | 1,500 (-14%) | 6mo | $141,000 | $94 | 36 |
Match score weights: distance 35% · size 25% · config 20% · recency 20%. Top-matched comps best support the ARV.
Projected returns pro-forma
-3.0% appreciation · 2.65% rent growth · sell at horizon
- IRR
- 18.3%
- Equity multiple
- 1.74×
- Total profit
- $20,435
- Equity at exit
- $14,761
- IRR
- 26.4%
- Equity multiple
- 3.28×
- Total profit
- $63,224
- Equity at exit
- $8,560
Cash invested: $27,720 (down + closing). Projections, not guarantees.
Landlord ↔ Tenant lean methodology
- Overall (STATE)
- 90 Strongly Landlord-Friendly
- State Alabama
- 90 Strongly Landlord-Friendly · R+15
- County
- — inherits STATE
- City
- — inherits STATE
ZIP-level market 36109
- Home prices YoY
- -20.1%
- Rents YoY
- 2.6%
- Active inventory
- 209
- Price-to-rent
- 5.5×
Monthly cashflow live
- Estimated rent
- $1,502 high interval (Pro) →
- Mortgage (P&I)
- −$519
- Tax from tax record
- −$45 /mo · $534/yr
- Insurance
- −$41
- HOA
- −$0
- Vacancy / Maint / Mgmt
- −$315
- Net cashflow
- $581
Break-even live
Sensitivity live
| Price | -10% $637 | -5% $609 | +0% $581 | +5% $553 | +10% $525 |
|---|---|---|---|---|---|
| Rent | -10% $463 | -5% $522 | +0% $581 | +5% $641 | +10% $700 |
| Rate | -1.0pp $631 | -0.5pp $607 | base $581 | +0.5pp $556 | +1.0pp $530 |
UW: 25.0% down · 7.5% · 30yr · 1.5% tax · 5.0% vac · 8.0% maint · 8.0% mgmt
Financing live
Cash to close
- Down payment
- $24,750
- Closing costs
- $2,970
- Reserves months
- —
- Total cash needed
- —
Loan-product check · same deal, 3 products live
Conventional
25% down · 7.5% · 30yr
- Down + closing
- —
- Monthly P&I
- —
- Monthly cashflow
- —
- DSCR
- —
- Eligible?
- —
Personal DTI + credit; lowest rate.
DSCR
20% down · 8.5% · 30yr
- Down + closing
- —
- Monthly P&I
- —
- Monthly cashflow
- —
- DSCR
- —
- Eligible?
- —
No personal income docs; deal must DSCR.
Hard money
10% down · 12.0% · 12mo
- Down + closing
- —
- Monthly P&I
- —
- Monthly cashflow
- —
- DSCR
- —
- Eligible?
- —
Short-term bridge; refi at stabilization.
Rent comps 26 comps
| Address | Beds | Baths | Sqft | Rent | $/sqft | DOM | Units | Dist |
|---|---|---|---|---|---|---|---|---|
| 633 Groveland Dr Montgomery, AL | 3.0 | 2.0 | 1424 | $1,200 | $0.84 | 44d | 1 | 0.04mi |
| 535 Lawndale Ln Montgomery, AL | 4.0 | 1.5 | 1260 | $1,100 | $0.87 | 14d | 1 | 0.07mi |
| 516 Lawndale Ln Montgomery, AL | 3.0 | 1.0 | 1125 | $1,150 | $1.02 | 44d | 1 | 0.10mi |
| 605 Plantation Way Montgomery, AL | 4.0 | 2.0 | 1519 | $1,200 | $0.79 | 22d | 1 | 0.13mi |
| 564 Glade Park Loop Unit 1043856P Montgomery, AL | 4.0 | 2.0 | 1496 | $2,736 | $1.83 | 14d | 1 | 0.28mi |
| 713 Amity Ln Montgomery, AL | 4.0 | 2.0 | 1696 | $1,900 | $1.12 | 44d | 1 | 0.70mi |
| 728 Amity Ln Montgomery, AL | 4.0 | 2.0 | 1218 | $1,700 | $1.40 | 14d | 1 | 0.73mi |
| 5712 Roxboro Dr Montgomery, AL | 4.0 | 2.0 | 1544 | $1,450 | $0.94 | 22d | 1 | 0.73mi |
| 5805 Hyde Park Dr Montgomery, AL | 3.0 | 2.0 | 1757 | $1,511 | $0.86 | 22d | 1 | 0.95mi |
| 5735 Sweet Meadow Dr Montgomery, AL | 3.0 | 2.0 | 1413 | $1,525 | $1.08 | 44d | 1 | 0.97mi |
| 4536 Wake Forest Dr Montgomery, AL | 3.0 | 2.0 | 1244 | $1,250 | $1.00 | 44d | 1 | 0.99mi |
| 760 N Burbank Dr Montgomery, AL | 3.0 | 2.0 | 1102 | $1,400 | $1.27 | 44d | 1 | 1.04mi |
| 341 N Burbank Dr Montgomery, AL | 5.0 | 2.0 | 1584 | $1,800 | $1.14 | 14d | 1 | 1.16mi |
| 323 N Burbank Dr Montgomery, AL | 4.0 | 2.0 | 1584 | $1,381 | $0.87 | 14d | 1 | 1.18mi |
| 6061 Karen Valley Cv Montgomery, AL | 3.0 | 2.0 | 1509 | $1,500 | $0.99 | 22d | 1 | 1.27mi |
| 6320 Burbank Crossing Loop Montgomery, AL | 3.0 | 2.0 | 1238 | $1,600 | $1.29 | 44d | 1 | 1.32mi |
| 457 Mulligan Dr Montgomery, AL | 3.0 | 2.0 | 1344 | $1,335 | $0.99 | 44d | 1 | 1.33mi |
| 438 Mulligan Dr Montgomery, AL | 4.0 | 2.0 | 1232 | $1,500 | $1.22 | 44d | 1 | 1.33mi |
| 6265 Wares Ferry Rd Montgomery, AL | 3.0 | 2.0 | 1336 | $1,600 | $1.20 | 14d | 1 | 1.39mi |
| 241 Kroy Dr Montgomery, AL | 4.0 | 2.0 | 1450 | $1,195 | $0.82 | 44d | 1 | 1.45mi |
| 6272 Deerwood Dr Montgomery, AL | 3.0 | 2.0 | 1754 | $1,785 | $1.02 | 14d | 1 | 1.45mi |
| 6272 Deerwood Dr Montgomery, AL | 3.0 | 2.0 | 1754 | $1,875 | $1.07 | 22d | 1 | 1.45mi |
| 3944 Johnstown Dr Montgomery, AL | 3.0 | 2.0 | 1912 | $1,275 | $0.67 | 44d | 1 | 1.48mi |
| 706 Placid Dr Montgomery, AL | 3.0 | 1.5 | 1120 | $1,400 | $1.25 | 14d | 1 | 1.48mi |
| 523 Placid Dr Montgomery, AL | 3.0 | 2.0 | 1122 | $1,195 | $1.07 | 44d | 1 | 1.48mi |
| 428 Fieldbrook Dr Montgomery, AL | 3.0 | 1.5 | 1440 | $995 | $0.69 | 22d | 1 | 1.49mi |
Listing history 14 events
-
2026-06-21days on market $99,000 Active 19 DOM
-
2026-06-18days on market $99,000 Active 16 DOM
-
2026-06-17days on market $99,000 Active 15 DOM
-
2026-06-16days on market $99,000 Active 14 DOM
-
2026-06-15days on market $99,000 Active 13 DOM
-
2026-06-14days on market $99,000 Active 11 DOM
-
2026-06-13days on market $99,000 Active 10 DOM
-
2026-06-10days on market $99,000 Active 8 DOM
-
2026-06-09days on market $99,000 Active 7 DOM
-
2026-06-08days on market $99,000 Active 6 DOM
-
2026-06-07remarks 323-char remark
-
2026-06-07days on market $99,000 Active 5 DOM
-
2026-06-03remarks 299-char remark
-
2026-06-03$99,000 Active 1 DOM
ⓘ Source: listings_history table (triggers on properties + properties_extension) + one-shot
backfill from property_details.listing_events for pre-trigger history.
Tax reassessment forecast AL · Resets to sale price
- Current annual tax
- $534 · $45/mo
- Projected year-2 tax
- $534 · $45/mo
- Expected delta
- $0/yr ($0/mo · 0.0%)
ⓘ Screening estimate from a state-policy table — verify with the county assessor before closing.
Climate risk First Street
- Flood 1/10 Low FEMA zone X (unshaded) · 0% chance over 30 yrs
- Wildfire 4/10 Moderate
- Heat 7/10 Severe 7 d/yr ≥107°F today · 20 d/yr by 30 yrs out
- Wind 8/10 Severe 80% chance of damaging wind over 30 yrs
- Air quality 4/10 Moderate 4 unhealthy d/yr today · 5 by 30 yrs out
Nearby sold comps map
Loading sold comps map…
Walkable amenities ~0.75 mi
Loading nearby amenities…
Taxation est. · year 1
- Rental income
- $18,020
- − Mortgage interest
- −$5,546
- − Property taxes
- −$534
- − Insurance
- −$495
- − Repairs & maintenance
- −$1,442
- − Management
- −$1,442
- − Depreciation
- −$2,880
- Taxable income
- $5,682
- Est. tax owed @ 24.0%
- −$1,364
- After-tax cash flow
- $5,613/yr
For passive investors: Depreciation is non-cash, so a rental often shows a tax loss while cash-flowing — sheltering income. Rental losses are passive: they offset passive income freely, and up to $25,000/yr can offset ordinary (W-2) income if you actively participate and your MAGI is under $100k (phasing out to $0 by $150k); unused losses carry forward. On sale, claimed depreciation is recaptured at up to 25%, and gains may owe capital-gains tax (a 1031 exchange can defer both). Figures are a year-1 estimate at your 24.0% rate — not tax advice; consult a CPA.
Schools (NCES district)
- District
- Montgomery County
- NCES district ID
- 0102430
- Math proficiency
- 9% ▼ -21.00%
- Reading proficiency
- 31% ▼ -1.00%
- Median HH income
- $43,902
- Composite
- 17.24/100
- National rank
- #9093
- State rank
- #106 of 129 in AL
Livability — Montgomery
- Score
- 65/100
- State rank
- #138
- US rank
- #13416
Category grades
Schools grade is shown separately in the Schools card above.
Census & demographics
- Census place
- Montgomery, AL
- County
- Montgomery County · 190,016 people
- City population
- 175,913
- Metro
- Montgomery, AL
- Population (ZIP)
- 23,581
- Household income
- $59,193
- Rent vs Own
- Severe rent burden
- 1039.0
Population outlook (Montgomery County) Hauer SSP2
- Today (2025)
- 224,008 people
- By 2030
- 221,460 · -1.1%
- By 2040
- 214,179 · -4.4%
- By 2050
- 204,912 · -8.5%
- By 2075
- 177,821 · -20.6%
- By 2100
- 145,134 · -35.2%
Race, ethnicity, and origin ACS 2023
- Neighborhood character
- Diverse neighborhood (Simpson 0.60)
- Race & ethnicity
- White 49% Black 39% Hispanic / Latino 8% Two or more races 4%
- Hispanic origin (detail)
- Mexican 4%
- Common ancestry
- Slovak 2% Lithuanian 1% Serbian 1%
- Foreign-born
- 4% · Canada, South Korea
- Languages at home
- 94% English-only · Spanish 5%
Political lean MEDSL · Montgomery
- 2024 margin
- Solid D (+30.7) · D 64.8% · R 34.1% · Other 1.1%
- 2008→2024 swing
- +11.5pp toward D · 2008: 19.2pp · 2024: 30.7pp
- All cycles
- 2024: D+30.7 2020: D+31.5 2016: D+26.2 2012: D+24.3 2008: D+19.2
Not yet ingested
- Civics
- —
Market trends
- HPI YoY
- ▼ -37.64%
- Current HPI
- 149.3867
- Rent YoY
- ▲ 2.65%
- Metro
- Montgomery, AL
- State GDP YoY
- ▲ 2.94%
- F500 in state
- 4
Industry mix (Fortune 500 HQ in AL)
| Industry | F500 HQs | Revenue |
|---|---|---|
| Financial Services | 1 | $8B |
|
||
| Healthcare | 1 | $5B |
|
||
Price history
+23.9% since first listed8 events — show timeline
- 2026-06-02 Listed $99,000 MAAR
- 2018-06-27 Sold (Public Records) $74,945 Public Records
- 2018-06-21 Sold (MLS) $74,800 MAAR
- 2017-10-10 Listed $80,000 MAAR
- 2016-01-08 Listed $84,900 MAAR
- 2007-05-31 Listed $99,900 MAAR
- 2006-11-15 Listed $104,900 MAAR
- 2001-06-26 Listed $79,900 MAAR
Property tax history
+5.4%/yrLatest (2025): $534 · +5.6% YoY. Source: county tax records.
Cash-flow waterfall
monthlySold comps — $/sqft
last 12 mo · ≤1 miLoading sold comps…