60 Mcclure Dr NW · Cartersville, GA
Flood risk 1/10 · Minimal
- FEMA flood zone
- X (unshaded)
- Chance of flooding over 30 yrs
- 0.0%
- Est. flood insurance / yr
- $507 – $1,088
Fire risk 5/10 · Moderate
- Est. fire insurance / yr
- $963 – $1,789
Heat risk 5/10 · Moderate
- Hot days now (above 104°F)
- 7 days/yr
- Hot days in 30 yrs
- 19 days/yr
Wind risk 4/10 · Minor
- Chance of severe wind over 30 yrs
- 13.0%
Air-quality risk 4/10 · Minor
- Unhealthy air days now
- 5 days/yr
- Unhealthy air days in 30 yrs
- 6 days/yr
Risk factors via First Street. Map © Google.
Why this score? — see what drove the B- grade
The composite is a weighted blend of 9 inputs, each scored 0–100. Each bar is that input's sub-score; the figure is the points it added to the 100-point composite (weight × sub-score).
- Cash flow +30.0/30.0
- DSCR +10.0/10.0
- 1% rule +9.3/10.0
- ARV discount +7.5/15.0
- Livability +3.7/5.0
- Schools +2.9/10.0
- Condition / age +2.5/5.0
- Rent growth +2.4/5.0
- Appreciation +0.0/10.0
$99,900
🖨 Deal sheet 📄 Offer letter ✓ Due diligence
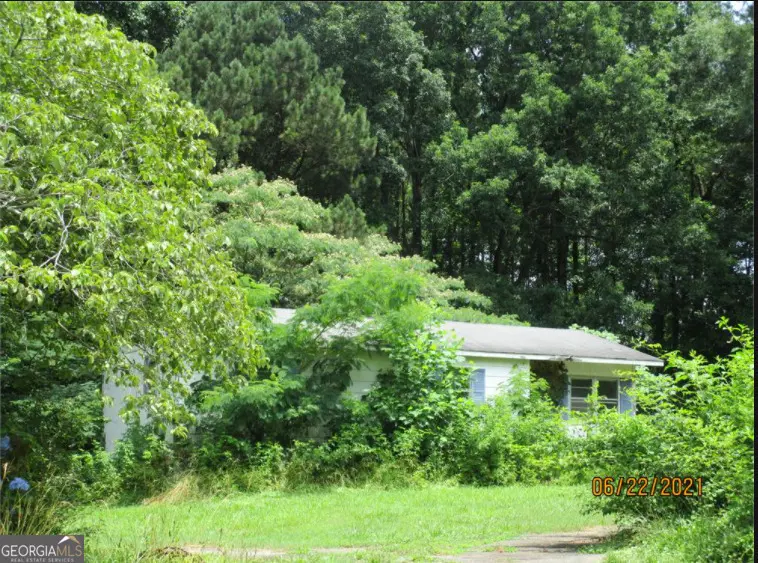
Listing remarks
Includes Parcel TID: 0059C-0003-018 & 0059C-0003-012. Investor opportunity. Excellent lot conveniently located to nearby schools and shopping. House is sold As-Is. Do not enter the structure. It is unsafe. Entry is at the viewers own risk. No sign on located property.
Key facts
- 1.38 acre lot
- Built 1987
Neighborhood map
What this means for you Summary
Snapshot
- This is a 2-bed/2.0-bath single-family listed at $100k.
Deal economics
- At list price, monthly cash flow is $525 ($6k/yr) — positive.
- The deal already cash-flows at list — no discount required.
- Meets the 1% rule at list price ($1k rent vs $100k).
- Cap rate 12.6% vs local median 3.7% in Cartersville — top-decile yield for the area; either an underpriced asset or a hidden risk that comps aren't pricing in. Stress-test before assuming the spread holds.
Location & tenants
- Location reads 74/100 on livability (#43 in GA, #4,800 nationally) — a middle-class / working-renter tenant base. Strengths: housing A+, health & safety A+, amenities A; Watch: commute F.
- Bartow County (rural): math 33% / reading 34% proficiency, ranked #70 of 174 in GA (top 40%) — families likely to look elsewhere, expect single-tenant / working-renter base with shorter leases.
- Zoned schools: Hamilton Crossing Elementary School (math 21% / reading 32%, grade F, #718 of 1,228 statewide, top 59%, 597 students, 54% FRL); Cass Middle School (math 35% / reading 36%, grade F, #185 of 470 statewide, top 40%, 879 students, 58% FRL); Cass High School (math 17% / reading 25%, grade F, #225 of 424 statewide, top 54%, 1,551 students, 51% FRL) — zoned schools at 54% FRL track the district average.
- Market conditions: Rents soft (-0.2%/yr); 521 active listings in the ZIP; solid renter incomes; 1,618 units permitted in Bartow County in 2024 (265 in 5+ unit buildings).
Forward outlook
- Local home prices are declining (-3.0%/yr); year-one equity from $691 of loan paydown is wiped out by about $3k of value loss. Plan a longer hold.
- At projected returns (-3.0% appreciation + 0.0% rent growth), your $28k cash investment doubles in ~7 years — after that, you're playing with house money.
Negotiation context
- Only 1 days on market — expect competitive offers; lowballing is unlikely to land.
- 2 sale attempts since 4y ago with the ask held roughly flat each time — persistent listings suggest the price (not the market) is what's stuck; bring a comps-based counter.
Risks & watch-outs
- Climate carrying-cost: moderate wildfire risk; extreme-heat days projected 7→19/yr by 2055 (HVAC capex compounding) — expect insurance premiums to compound above CPI over the hold.
Questions for the listing agent
- Is there a deadline driving the sale (1031 exchange, divorce, estate, relocation)? That informs how much negotiation room exists.
- Schools are D-rated, which usually means shorter tenancies and higher turnover. Who's the typical renter profile here, and what's been the actual vacancy rate?
- What's the average days-on-market for RENTAL listings here right now (not sales)? A rising rental-DOM trend means longer vacancies and softer asking-rent achievability than the comps imply.
- What's the recent tenant-quality profile in this submarket — average credit score on applications, eviction rate, late-payment / NSF rate, and stable-employment percentage? A property-management company in the area should have these aggregated.
- How much new for-sale + rental construction is in the pipeline within 1–3 miles? Heavy new supply typically softens prices + rents 12–24 months out; constrained supply supports both.
Investment metrics
- 1% rule
- 1.43% ✓
- Cap rate
- 12.60%
- Cash-on-cash
- 22.53%
- DSCR
- 2.00
- GRM
- 5.8
CMA / ARV
No comps found within radius.
Projected returns pro-forma
-3.0% appreciation · 0.0% rent growth · sell at horizon
- IRR
- 12.1%
- Equity multiple
- 1.47×
- Total profit
- $13,041
- Equity at exit
- $14,895
- IRR
- 18.8%
- Equity multiple
- 2.36×
- Total profit
- $38,101
- Equity at exit
- $8,638
Cash invested: $27,972 (down + closing). Projections, not guarantees.
Landlord ↔ Tenant lean methodology
- Overall (STATE)
- 90 Strongly Landlord-Friendly
- State Georgia
- 90 Strongly Landlord-Friendly · R+3
- County
- — inherits STATE
- City
- — inherits STATE
ZIP-level market 30120
- Home prices YoY
- -18.6%
- Rents YoY
- -0.2%
- Active inventory
- 521
- Price-to-rent
- 5.8×
Monthly cashflow live
- Estimated rent
- $1,431 medium interval (Pro) →
- Mortgage (P&I)
- −$524
- Tax from tax record
- −$40 /mo · $475/yr
- Insurance
- −$42
- HOA
- −$0
- Vacancy / Maint / Mgmt
- −$300
- Net cashflow
- $525
Break-even live
UW: 25.0% down · 7.5% · 30yr · 1.5% tax · 5.0% vac · 8.0% maint · 8.0% mgmt
Financing live
Cash to close
- Down payment
- $24,975
- Closing costs
- $2,997
- Reserves months
- —
- Total cash needed
- —
Loan-product check · same deal, 3 products live
Conventional
25% down · 7.5% · 30yr
- Down + closing
- —
- Monthly P&I
- —
- Monthly cashflow
- —
- DSCR
- —
- Eligible?
- —
Personal DTI + credit; lowest rate.
DSCR
20% down · 8.5% · 30yr
- Down + closing
- —
- Monthly P&I
- —
- Monthly cashflow
- —
- DSCR
- —
- Eligible?
- —
No personal income docs; deal must DSCR.
Hard money
10% down · 12.0% · 12mo
- Down + closing
- —
- Monthly P&I
- —
- Monthly cashflow
- —
- DSCR
- —
- Eligible?
- —
Short-term bridge; refi at stabilization.
Listing history 6 events
-
2022-06-24status Pending
-
2022-01-24status Pending
-
2022-01-24status Under Contract
-
2022-01-23historical
-
2022-01-20$99,900 Active
-
2022-01-20$99,900 New
ⓘ Source: listings_history table (triggers on properties + properties_extension) + one-shot
backfill from property_details.listing_events for pre-trigger history.
Tax reassessment forecast GA · Resets to sale price
- Current annual tax
- $475 · $40/mo
- Projected year-2 tax
- $919 · $77/mo
- Expected delta
- +$444/yr (+$37/mo · 93.5%)
ⓘ Screening estimate from a state-policy table — verify with the county assessor before closing.
Climate risk First Street
- Flood 1/10 Low FEMA zone X (unshaded) · 0% chance over 30 yrs
- Wildfire 5/10 Major
- Heat 5/10 Major 7 d/yr ≥104°F today · 19 d/yr by 30 yrs out
- Wind 4/10 Moderate 13% chance of damaging wind over 30 yrs
- Air quality 4/10 Moderate 5 unhealthy d/yr today · 6 by 30 yrs out
Nearby sold comps map
Loading sold comps map…
Walkable amenities ~0.75 mi
Loading nearby amenities…
Taxation est. · year 1
- Rental income
- $17,169
- − Mortgage interest
- −$5,596
- − Property taxes
- −$475
- − Insurance
- −$500
- − Repairs & maintenance
- −$1,374
- − Management
- −$1,374
- − Depreciation
- −$2,906
- Taxable income
- $4,946
- Est. tax owed @ 24.0%
- −$1,187
- After-tax cash flow
- $5,116/yr
For passive investors: Depreciation is non-cash, so a rental often shows a tax loss while cash-flowing — sheltering income. Rental losses are passive: they offset passive income freely, and up to $25,000/yr can offset ordinary (W-2) income if you actively participate and your MAGI is under $100k (phasing out to $0 by $150k); unused losses carry forward. On sale, claimed depreciation is recaptured at up to 25%, and gains may owe capital-gains tax (a 1031 exchange can defer both). Figures are a year-1 estimate at your 24.0% rate — not tax advice; consult a CPA.
Schools (NCES district)
- District
- Bartow County
- NCES district ID
- 1300330
- Math proficiency
- 33% ▼ -8.00%
- Reading proficiency
- 34% ▼ -7.00%
- Median HH income
- $50,596
- Composite
- 29.16/100
- National rank
- #6577
- State rank
- #70 of 174 in GA
Livability — Cartersville
- Score
- 74/100
- State rank
- #43
- US rank
- #4800
Category grades
Schools grade is shown separately in the Schools card above.
Census & demographics
- County
- Bartow County · 85,497 people
- City population
- 70,885
- Metro
- Atlanta-Sandy Springs-Alpharetta, GA
- Population (ZIP)
- 44,896
- Household income
- $86,581
- Rent vs Own
- Severe rent burden
- 987.0
Population outlook (Bartow County) Hauer SSP2
- Today (2025)
- 107,887 people
- By 2030
- 109,594 · +1.6%
- By 2040
- 111,038 · +2.9%
- By 2050
- 109,046 · +1.1%
- By 2075
- 99,484 · -7.8%
- By 2100
- 83,431 · -22.7%
Race, ethnicity, and origin ACS 2023
- Neighborhood character
- Predominantly White (70%)
- Race & ethnicity
- White 70% Black 13% Hispanic / Latino 12% Two or more races 8% Asian 1%
- Hispanic origin (detail)
- Mexican 9%
- Common ancestry
- Slovak 3% Italian 2% Serbian 1%
- Foreign-born
- 5% · Canada, Vietnam, Jamaica
- Languages at home
- 89% English-only · Spanish 9%
Political lean MEDSL · Bartow
- 2024 margin
- Solid R (+51.0) · D 24.2% · R 75.2%
- 2008→2024 swing
- -5.8pp toward R · 2008: -45.2pp · 2024: -51.0pp
- All cycles
- 2024: R+51.0 2020: R+50.7 2016: R+55.2 2012: R+51.7 2008: R+45.2
Not yet ingested
- Civics
- —
Market trends
- HPI YoY
- ▼ -68.99%
- Current HPI
- 302.5848
- Rent YoY
- ▼ -0.23%
- Metro
- Atlanta-Sandy Springs-Alpharetta, GA
- State GDP YoY
- ▲ 2.66%
- F500 in state
- 28
Industry mix (Fortune 500 HQ in GA)
| Industry | F500 HQs | Revenue |
|---|---|---|
| Paper / Packaging | 2 | $29B |
|
||
| Retail | 1 | $160B |
|
||
| Transportation / Logistics | 1 | $91B |
|
||
| Airlines | 1 | $62B |
|
||
| Consumer Goods | 1 | $47B |
|
||
| Utilities | 1 | $25B |
|
||
Price history
+0.0% since first listed6 events — show timeline
- 2022-06-24 Pending — FMLS
- 2022-01-24 Pending — FMLS
- 2022-01-24 Pending — GAMLS
- 2022-01-23 Listing Removed — FMLS
- 2022-01-20 Listed $99,900 GAMLS
- 2022-01-20 Listed $99,900 FMLS
Property tax history
-0.2%/yrLatest (2024): $475 · +9.6% YoY. Source: county tax records.
Cash-flow waterfall
monthlySold comps — $/sqft
last 12 mo · ≤1 miLoading sold comps…