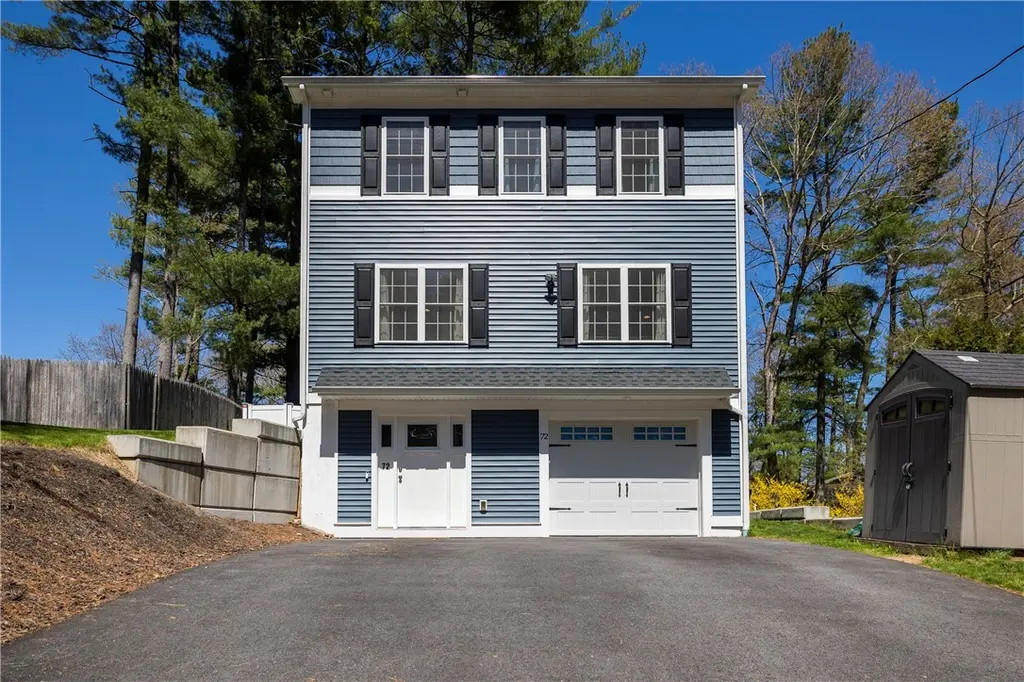
72 First Rd · Pascoag, RI
Flood risk 1/10 · Minimal
- FEMA flood zone
- X (unshaded)
- Chance of flooding over 30 yrs
- 0.0%
- Est. flood insurance / yr
- $507 – $1,088
Fire risk 1/10 · Minimal
- Est. fire insurance / yr
- $835 – $1,551
Heat risk 4/10 · Minor
- Hot days now (above 94°F)
- 7 days/yr
- Hot days in 30 yrs
- 15 days/yr
Wind risk 6/10 · Moderate
- Chance of severe wind over 30 yrs
- 64.0%
Air-quality risk 2/10 · Minimal
- Unhealthy air days now
- 2 days/yr
- Unhealthy air days in 30 yrs
- 2 days/yr
Risk factors via First Street. Map © Google.
Why this score? — see what drove the C+ grade
The composite is a weighted blend of 9 inputs, each scored 0–100. Each bar is that input's sub-score; the figure is the points it added to the 100-point composite (weight × sub-score).
- Cash flow +17.2/30.0
- ARV discount +13.7/15.0
- Appreciation +10.0/10.0
- DSCR +5.4/10.0
- Schools +5.1/10.0
- 1% rule +4.3/10.0
- Livability +3.5/5.0
- Rent growth +2.5/5.0
- Condition / age +2.5/5.0
$539,900
🖨 Deal sheet (PDF) 📄 Offer letter ✓ Due diligence
Listing remarks
Why wait for new construction when it's already here? Built in 2022 and proudly maintained by its original owner, this move-in ready home offers the perfect blend of modern finishes and relaxed lake-area living. Enjoy the ease of settling right in with main appliances included and the peace of mind that comes with newer construction. Located just a short walk from Echo Lake, residents can take advantage of membership beach rights, nearby water access, and close proximity to the public boat launch, making it easy to enjoy boating, kayaking, fishing, and time on the water all season long. Whether you're searching for a year-round residence or a weekend retreat, this home offers a lifestyle th
Key facts
- Public boat launch
- Nearby water access
- 4,792 sq ft lot
Tags
Property features AI
Exterior
- Parking: Attached garage (1 covered space); Total of 5 parking spaces
- Utilities: 200+ amp electric service; Public water and well; Septic tank
- Home design: 2-story home; Vinyl siding; Concrete perimeter foundation
- Construction: Vinyl siding construction
- Exterior features: Deck; Paved driveway; Fenced yard; Water access within walking distance
Interior
- Kitchen: Kitchen with island and recessed lighting; Microwave, Oven, Range, Dishwasher, Refrigerator
- Bedrooms: Bedroom 2 on third level; Bedroom 3 on third level; Additional bedroom (13.9 x 15.1) on third level with ceiling fan(s)
- Flooring: Ceramic tile; Hardwood
- Bathrooms: 2 full bathrooms; 1 half bathroom
- Heating & cooling: Central air conditioning; Electric and gas heating with forced air
- Interior features: Stall shower and tub/shower; Recessed lighting
- Laundry & utility: Washer and Dryer; Electric water heater
Neighborhood map
What this means for you Summary
Snapshot
- This is a 3-bed/2.5-bath single-family listed at $540k.
Deal economics
- At list price, monthly cash flow is $388 ($5k/yr) — positive.
- The deal already cash-flows at list — no discount required.
- To meet the 1% rule (rent ≥ 1% of price), the offer needs to be $500k (7.4% below list).
- Recommended offer: $500k (7.4% below list) — sets the bar for 1% rule.
- Cap rate 7.2% vs local median 3.0% in Pascoag — top-decile yield for the area; either an underpriced asset or a hidden risk that comps aren't pricing in. Stress-test before assuming the spread holds.
Location & tenants
- Location reads 70/100 on livability (#17 in RI) — a middle-class / working-renter tenant base. Strengths: crime A+, employment A+, housing A+; Watch: schools F, amenities F, commute F.
- Glocester (rural): math 46% / reading 66% proficiency, ranked #4 of 39 in RI (top 10%) — acceptable for families but not a draw, mixed tenant base, ~2y average lease; only 12% free/reduced lunch — higher-income household profile.
- Market conditions: 40 active listings in the ZIP; 1 comparable units currently listed for rent nearby; 776 units permitted in Providence County in 2024 (229 in 5+ unit buildings).
Forward outlook
- In year one you build about $58k of equity ($4k loan paydown + $54k appreciation (10.0% local appreciation)).
- Providence County population projected at +5% by 2050 — modest demand growth; plan on rents tracking national, not racing it.
- At projected returns (10.0% appreciation + 3.0% rent growth), your $151k cash investment doubles in ~3 years — after that, you're playing with house money.
- By year 2, paydown + projected appreciation supports a ~$93k cash-out refi (75% LTV) — recoverable capital for the next deal without selling this one.
Negotiation context
- Only 2 days on market — expect competitive offers; lowballing is unlikely to land.
- Current owner paid $16k; list at $540k implies a 3274% gain — meaningful room to come down on a strong offer.
Risks & watch-outs
- Climate carrying-cost: major wind risk, 64% chance of damaging wind over 30y — expect insurance premiums to compound above CPI over the hold.
Questions for the listing agent
- Is there a deadline driving the sale (1031 exchange, divorce, estate, relocation)? That informs how much negotiation room exists.
- Schools are F-rated, which usually means shorter tenancies and higher turnover. Who's the typical renter profile here, and what's been the actual vacancy rate?
- What's the average days-on-market for RENTAL listings here right now (not sales)? A rising rental-DOM trend means longer vacancies and softer asking-rent achievability than the comps imply.
- What's the recent tenant-quality profile in this submarket — average credit score on applications, eviction rate, late-payment / NSF rate, and stable-employment percentage? A property-management company in the area should have these aggregated.
- How much new for-sale + rental construction is in the pipeline within 1–3 miles? Heavy new supply typically softens prices + rents 12–24 months out; constrained supply supports both.
Investment metrics
- 1% rule
- 0.93% ✗
- Cap rate
- 7.16%
- Cash-on-cash
- 3.08%
- DSCR
- 1.14
- GRM
- 9.0
CMA / ARV
- ARV (on-the-fly)
- $626,976
- Comps found
- 3
Show comp detail 3 sales within ~0.75 mi
| Address | Dist | Beds/Ba | Sqft | Sold | Price | $/sf | Match |
|---|---|---|---|---|---|---|---|
| 325 Lake Dr | 0.10mi | 3/2.0 | 1,818 (-10%) | 6mo | $565,000 | $311 | 72 |
| 14 Jackson Schoolhouse Rd | 0.28mi | 3/2.0 | 1,836 (-9%) | 11mo | $420,000 | $229 | 61 |
| 7 Pine Orchard Rd | 0.61mi | 3/2.5 | 1,800 (-11%) | 0mo | $585,000 | $325 | 53 |
Match score weights: distance 35% · size 25% · config 20% · recency 20%. Top-matched comps best support the ARV.
Projected returns pro-forma
10.0% appreciation · 3.0% rent growth · sell at horizon
- IRR
- 26.5%
- Equity multiple
- 3.11×
- Total profit
- $318,732
- Equity at exit
- $486,385
- IRR
- 23.2%
- Equity multiple
- 7.08×
- Total profit
- $919,120
- Equity at exit
- $1,048,907
Cash invested: $151,172 (down + closing). Projections, not guarantees.
Landlord ↔ Tenant lean methodology
- Overall (STATE)
- 31 Tenant-Leaning
- State Rhode Island
- 31 Tenant-Leaning · D+8
- County
- — inherits STATE
- City
- — inherits STATE
ZIP-level market 02814
- Home prices YoY
- 3.0%
- Active inventory
- 40
- Price-to-rent
- 9.0×
Monthly cashflow live
- Estimated rent
- $5,000 medium interval (Pro) →
- Mortgage (P&I)
- −$2,831
- Tax from tax record
- −$506 /mo · $6,068/yr
- Insurance
- −$225
- HOA
- −$0
- Vacancy / Maint / Mgmt
- −$1,050
- Net cashflow
- $388
Break-even live
Sensitivity live
| Price | -10% $694 | -5% $541 | +0% $388 | +5% $235 | +10% $82 |
|---|---|---|---|---|---|
| Rent | -10% $-7 | -5% $191 | +0% $388 | +5% $586 | +10% $783 |
| Rate | -1.0pp $660 | -0.5pp $525 | base $388 | +0.5pp $248 | +1.0pp $106 |
UW: 25.0% down · 7.5% · 30yr · 1.5% tax · 5.0% vac · 8.0% maint · 8.0% mgmt
Financing live
Cash to close
- Down payment
- $134,975
- Closing costs
- $16,197
- Reserves months
- —
- Total cash needed
- —
Loan-product check · same deal, 3 products live
Conventional
25% down · 7.5% · 30yr
- Down + closing
- —
- Monthly P&I
- —
- Monthly cashflow
- —
- DSCR
- —
- Eligible?
- —
Personal DTI + credit; lowest rate.
DSCR
20% down · 8.5% · 30yr
- Down + closing
- —
- Monthly P&I
- —
- Monthly cashflow
- —
- DSCR
- —
- Eligible?
- —
No personal income docs; deal must DSCR.
Hard money
10% down · 12.0% · 12mo
- Down + closing
- —
- Monthly P&I
- —
- Monthly cashflow
- —
- DSCR
- —
- Eligible?
- —
Short-term bridge; refi at stabilization.
Rent comps 1 comps
| Address | Beds | Baths | Sqft | Rent | $/sqft | DOM | Units | Dist |
|---|---|---|---|---|---|---|---|---|
| 115 Jackson School House Rd Chepachet, RI | 4.0 | 2.5 | 2560 | $5,000 | $1.95 | 2d | 1 | 0.34mi |
Listing history 3 events
-
2026-05-31status $539,900 Pending 2 DOM
-
2026-05-28$539,900 Active
-
2016-02-12soldstatus $16,000
ⓘ Source: listings_history table (triggers on properties + properties_extension) + one-shot
backfill from property_details.listing_events for pre-trigger history.
Tax reassessment forecast RI · Partial reset (capped growth)
- Current annual tax
- $6,068 · $506/mo
- Projected year-2 tax
- $7,434 · $620/mo
- Expected delta
- +$1,366/yr (+$114/mo · 22.5%)
ⓘ Screening estimate from a state-policy table — verify with the county assessor before closing.
Climate risk First Street
- Flood 1/10 Low FEMA zone X (unshaded) · 0% chance over 30 yrs
- Wildfire 1/10 Low
- Heat 4/10 Moderate 7 d/yr ≥94°F today · 15 d/yr by 30 yrs out
- Wind 6/10 Major 64% chance of damaging wind over 30 yrs
- Air quality 2/10 Low 2 unhealthy d/yr today · 2 by 30 yrs out
Nearby sold comps map
Loading sold comps map…
Walkable amenities ~0.75 mi
Loading nearby amenities…
Taxation est. · year 1
- Rental income
- $60,000
- − Mortgage interest
- −$30,243
- − Property taxes
- −$6,068
- − Insurance
- −$2,700
- − Repairs & maintenance
- −$4,800
- − Management
- −$4,800
- − Depreciation
- −$15,706
- Taxable loss
- −$4,316
- Est. tax savings @ 24.0%
- +$1,036
- After-tax cash flow
- $5,693/yr
For passive investors: Depreciation is non-cash, so a rental often shows a tax loss while cash-flowing — sheltering income. Rental losses are passive: they offset passive income freely, and up to $25,000/yr can offset ordinary (W-2) income if you actively participate and your MAGI is under $100k (phasing out to $0 by $150k); unused losses carry forward. On sale, claimed depreciation is recaptured at up to 25%, and gains may owe capital-gains tax (a 1031 exchange can defer both). Figures are a year-1 estimate at your 24.0% rate — not tax advice; consult a CPA.
Schools (NCES district)
- District
- Glocester
- NCES district ID
- 4400450
- Math proficiency
- 46% ▼ -9.00%
- Reading proficiency
- 66% ▲ 2.00%
- Median HH income
- $81,483
- Composite
- 50.69/100
- National rank
- #1822
- State rank
- #4 of 39 in RI
Livability — Pascoag
- Score
- 70/100
- State rank
- #17
- US rank
- #7646
Category grades
Schools grade is shown separately in the Schools card above.
Census & demographics
- Population (ZIP)
- 7,421
Population outlook (Providence County) Hauer SSP2
- Today (2025)
- 653,469 people
- By 2030
- 660,819 · +1.1%
- By 2040
- 672,747 · +3.0%
- By 2050
- 683,741 · +4.6%
- By 2075
- 720,435 · +10.2%
- By 2100
- 741,582 · +13.5%
Race, ethnicity, and origin ACS 2023
- Neighborhood character
- Predominantly White (95%)
- Race & ethnicity
- White 95% Two or more races 3% Hispanic / Latino 1%
- Common ancestry
- Lithuanian 13% Romanian 5% Russian 5%
- Foreign-born
- 2% · Canada
- Languages at home
- 97% English-only · Spanish 1% Other Indo-European 1%
Political lean MEDSL · Providence
- 2024 margin
- D (+14.4) · D 56.1% · R 41.7% · Other 2.2%
- 2008→2024 swing
- -20.0pp toward R · 2008: 34.4pp · 2024: 14.4pp
- All cycles
- 2024: D+14.4 2020: D+22.9 2016: D+21.2 2012: D+34.9 2008: D+34.4
Not yet ingested
- Civics
- —
Market trends
- HPI YoY
- ▲ 11.23%
- Current HPI
- 383.6236
- Rent YoY
- —
- Metro
- —
- State GDP YoY
- ▲ 2.25%
- F500 in state
- 10
Industry mix (Fortune 500 HQ in RI)
| Industry | F500 HQs | Revenue |
|---|---|---|
| Healthcare | 1 | $373B |
|
||
| Food Distribution | 1 | $31B |
|
||
| Aerospace / Defense | 1 | $14B |
|
||
| Financial Services | 1 | $8B |
|
||
| Consumer Goods | 1 | $4B |
|
||
Price history
+3274.4% since first listed2 events — show timeline
- 2026-05-28 Listed $539,900 RIS
- 2016-02-12 Sold (Public Records) $16,000 Public Records
Property tax history
+28.5%/yrLatest (2025): $6,068 · +2.9% YoY. Source: county tax records.
Cash-flow waterfall
monthlySold comps — $/sqft
last 12 mo · ≤1 miLoading sold comps…