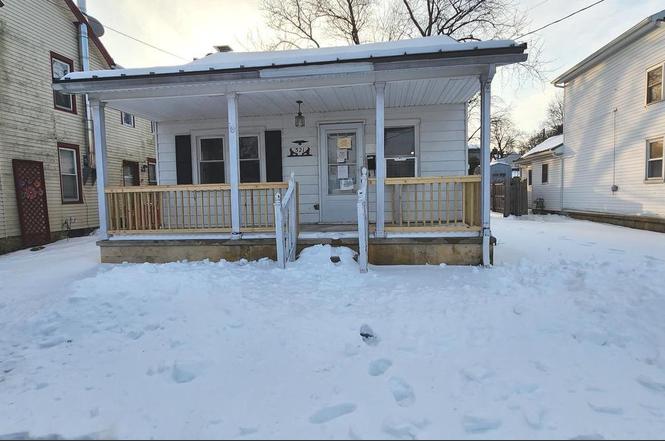
321 Chestnut · Mount Holly Springs, PA
Flood risk 1/10 · Minimal
- FEMA flood zone
- X (unshaded)
- Chance of flooding over 30 yrs
- 0.0%
- Est. flood insurance / yr
- $507 – $1,088
Fire risk 2/10 · Minimal
- Est. fire insurance / yr
- $511 – $949
Heat risk 5/10 · Moderate
- Hot days now (above 99°F)
- 8 days/yr
- Hot days in 30 yrs
- 17 days/yr
Wind risk 3/10 · Minor
- Chance of severe wind over 30 yrs
- 4.0%
Air-quality risk 2/10 · Minimal
- Unhealthy air days now
- 1 days/yr
- Unhealthy air days in 30 yrs
- 2 days/yr
Risk factors via First Street. Map © Google.
Why this score? — see what drove the B+ grade
The composite is a weighted blend of 9 inputs, each scored 0–100. Each bar is that input's sub-score; the figure is the points it added to the 100-point composite (weight × sub-score).
- Cash flow +30.0/30.0
- ARV discount +15.0/15.0
- 1% rule +10.0/10.0
- DSCR +10.0/10.0
- Schools +3.8/10.0
- Livability +3.2/5.0
- Rent growth +2.5/5.0
- Condition / age +2.5/5.0
- Appreciation +0.0/10.0
$104,500
🖨 Deal sheet 📄 Offer letter ✓ Due diligence
Listing remarks
✨ Affordable Opportunity in Mount Holly Springs! ✨ Discover the potential in this 1,152 sq. ft. two-bedroom, one-bath home located in the heart of Mount Holly Springs. Whether you're an investor, a contractor, or a buyer looking for a project, this property offers a solid foundation and plenty of room to reimagine it into something special. The home sits on a fenced-in backyard, perfect for pets, gardening, or outdoor hobbies, and includes multiple storage sheds for tools, equipment, or workshop space. With some repairs and updates, this property could truly shine. Enjoy small-town living with local conveniences just minutes away. Bring your vision and make this home your next successful pr
Key facts
- 8,712 sq ft lot
- 4 parking spots
- Built 1948
Neighborhood map
What this means for you Summary
Snapshot
- This is a 2-bed/1.0-bath single-family listed at $104k.
Deal economics
- At list price, monthly cash flow is $504 ($6k/yr) — positive.
- The deal already cash-flows at list — no discount required.
- Meets the 1% rule at list price ($2k rent vs $104k).
Location & tenants
- Location reads 65/100 on livability (#1,143 in PA) — a middle-class / working-renter tenant base. Strengths: crime A+, cost of living A+, housing B; Watch: employment C-, amenities F, commute F.
- Carlisle Area SD (urban): math 33% / reading 55% proficiency, ranked #277 of 539 in PA (top 51%) — families likely to look elsewhere, expect single-tenant / working-renter base with shorter leases.
- Zoned schools: Carlisle Area Hs (math 70% / reading 75%, grade B+, #37 of 437 statewide, top 8%, 1,578 students, 39% FRL).
- Zoned-school proficiency averages 72% at this address vs 44% district-wide (+28 pts) — the actual schools serving this property are materially stronger than the Carlisle Area SD average implies; a family-tenant draw the district grade alone would hide.
- Market conditions: 28 active listings in the ZIP; 1 comparable units currently listed for rent nearby; 1,052 units permitted in Cumberland County in 2024 (310 in 5+ unit buildings).
Forward outlook
- Local home prices are declining (-3.0%/yr); year-one equity from $722 of loan paydown is wiped out by about $3k of value loss. Plan a longer hold.
- Cumberland County population projected at +17% by 2050 — long-run rental-demand tailwind backs the buy-and-hold thesis.
- At projected returns (-3.0% appreciation + 3.0% rent growth), your $29k cash investment doubles in ~6 years — after that, you're playing with house money.
Negotiation context
- Only 6 days on market — expect competitive offers; lowballing is unlikely to land.
Risks & watch-outs
- Watch-outs: property tax is 2.8% of price; built in 1948 — expect roof / HVAC / electrical / plumbing capex.
- Climate carrying-cost: extreme-heat days projected 8→17/yr by 2055 (HVAC capex compounding) — expect insurance premiums to compound above CPI over the hold.
Questions for the listing agent
- Built in 1948 — when were the roof, HVAC, electrical panel, plumbing, and water heater last replaced?
- Property tax is high relative to price — has the assessment been appealed recently, and will the sale trigger a re-assessment?
- Is there a deadline driving the sale (1031 exchange, divorce, estate, relocation)? That informs how much negotiation room exists.
- Schools are D-rated, which usually means shorter tenancies and higher turnover. Who's the typical renter profile here, and what's been the actual vacancy rate?
- What's the average days-on-market for RENTAL listings here right now (not sales)? A rising rental-DOM trend means longer vacancies and softer asking-rent achievability than the comps imply.
- What's the recent tenant-quality profile in this submarket — average credit score on applications, eviction rate, late-payment / NSF rate, and stable-employment percentage? A property-management company in the area should have these aggregated.
- How much new for-sale + rental construction is in the pipeline within 1–3 miles? Heavy new supply typically softens prices + rents 12–24 months out; constrained supply supports both.
Investment metrics
- 1% rule
- 1.62% ✓
- Cap rate
- 12.08%
- Cash-on-cash
- 20.66%
- DSCR
- 1.92
- GRM
- 5.1
CMA / ARV
- ARV (on-the-fly)
- $199,410
- Comps found
- 8
Show comp detail 8 sales within ~0.75 mi
| Address | Dist | Beds/Ba | Sqft | Sold | Price | $/sf | Match |
|---|---|---|---|---|---|---|---|
| 212 Chestnut St | 0.16mi | 2/1.0 | 1,184 (+1%) | 1mo | $198,000 | $167 | 90 |
| 419 Chestnut | 0.10mi | 2/1.0 | 1,104 (-6%) | 6mo | $185,000 | $168 | 81 |
| 644 Highland Ave | 0.57mi | 3/1.0 (+1) | 1,200 (+2%) | 1mo | $256,000 | $213 | 64 |
| 28 E Pine St | 0.44mi | 2/1.0 | 1,175 (+0%) | 20mo | $200,000 | $170 | 62 |
| 600 W Pine St | 0.59mi | 3/1.5 (+1) | 1,104 (-6%) | 12mo | $240,000 | $217 | 46 |
| 14 Larken Ln | 0.60mi | 3/2.0 (+1) | 1,215 (+4%) | 24mo | $75,000 | $62 | 37 |
| 604 Sandbank Rd | 0.72mi | 3/1.0 (+1) | 1,276 (+9%) | 13mo | $290,000 | $227 | 36 |
| 8 Franklin St | 0.63mi | 3/2.0 (+1) | 1,296 (+10%) | 21mo | $84,500 | $65 | 27 |
Match score weights: distance 35% · size 25% · config 20% · recency 20%. Top-matched comps best support the ARV.
Projected returns pro-forma
-3.0% appreciation · 3.0% rent growth · sell at horizon
- IRR
- 13.1%
- Equity multiple
- 1.52×
- Total profit
- $15,252
- Equity at exit
- $15,581
- IRR
- 22.0%
- Equity multiple
- 2.88×
- Total profit
- $54,989
- Equity at exit
- $9,035
Cash invested: $29,260 (down + closing). Projections, not guarantees.
Landlord ↔ Tenant lean methodology
- Overall (STATE)
- 62 Landlord-Friendly
- State Pennsylvania
- 62 Landlord-Friendly · EVEN
- County
- — inherits STATE
- City
- — inherits STATE
ZIP-level market 17065
- Home prices YoY
- -10.5%
- Active inventory
- 28
- Price-to-rent
- 5.1×
Monthly cashflow live
- Estimated rent
- $1,695 medium interval (Pro) →
- Mortgage (P&I)
- −$548
- Tax from tax record
- −$244 /mo · $2,924/yr
- Insurance
- −$44
- HOA
- −$0
- Vacancy / Maint / Mgmt
- −$356
- Net cashflow
- $504
Break-even live
UW: 25.0% down · 7.5% · 30yr · 1.5% tax · 5.0% vac · 8.0% maint · 8.0% mgmt
Financing live
Cash to close
- Down payment
- $26,125
- Closing costs
- $3,135
- Reserves months
- —
- Total cash needed
- —
Loan-product check · same deal, 3 products live
Conventional
25% down · 7.5% · 30yr
- Down + closing
- —
- Monthly P&I
- —
- Monthly cashflow
- —
- DSCR
- —
- Eligible?
- —
Personal DTI + credit; lowest rate.
DSCR
20% down · 8.5% · 30yr
- Down + closing
- —
- Monthly P&I
- —
- Monthly cashflow
- —
- DSCR
- —
- Eligible?
- —
No personal income docs; deal must DSCR.
Hard money
10% down · 12.0% · 12mo
- Down + closing
- —
- Monthly P&I
- —
- Monthly cashflow
- —
- DSCR
- —
- Eligible?
- —
Short-term bridge; refi at stabilization.
Rent comps 1 comps
| Address | Beds | Baths | Sqft | Rent | $/sqft | DOM | Units | Dist |
|---|---|---|---|---|---|---|---|---|
| 309 Mill St Mount Holly Springs, PA | 2.0 | 1.0 | 1344 | $1,695 | $1.26 | 43d | 1 | 1.19mi |
Listing history 3 events
-
2026-02-18status Pending
-
2026-02-13$104,500 Active
-
2026-02-12historical $104,500
ⓘ Source: listings_history table (triggers on properties + properties_extension) + one-shot
backfill from property_details.listing_events for pre-trigger history.
Tax reassessment forecast PA · Partial reset (capped growth)
- Current annual tax
- $2,924 · $244/mo
- Projected year-2 tax
- $2,924 · $244/mo
- Expected delta
- $0/yr ($0/mo · 0.0%)
ⓘ Screening estimate from a state-policy table — verify with the county assessor before closing.
Climate risk First Street
- Flood 1/10 Low FEMA zone X (unshaded) · 0% chance over 30 yrs
- Wildfire 2/10 Low
- Heat 5/10 Major 8 d/yr ≥99°F today · 17 d/yr by 30 yrs out
- Wind 3/10 Moderate 4% chance of damaging wind over 30 yrs
- Air quality 2/10 Low 1 unhealthy d/yr today · 2 by 30 yrs out
Nearby sold comps map
Loading sold comps map…
Walkable amenities ~0.75 mi
Loading nearby amenities…
Taxation est. · year 1
- Rental income
- $20,340
- − Mortgage interest
- −$5,854
- − Property taxes
- −$2,924
- − Insurance
- −$522
- − Repairs & maintenance
- −$1,627
- − Management
- −$1,627
- − Depreciation
- −$3,040
- Taxable income
- $4,746
- Est. tax owed @ 24.0%
- −$1,139
- After-tax cash flow
- $4,907/yr
For passive investors: Depreciation is non-cash, so a rental often shows a tax loss while cash-flowing — sheltering income. Rental losses are passive: they offset passive income freely, and up to $25,000/yr can offset ordinary (W-2) income if you actively participate and your MAGI is under $100k (phasing out to $0 by $150k); unused losses carry forward. On sale, claimed depreciation is recaptured at up to 25%, and gains may owe capital-gains tax (a 1031 exchange can defer both). Figures are a year-1 estimate at your 24.0% rate — not tax advice; consult a CPA.
Schools (NCES district)
- District
- Carlisle Area SD
- NCES district ID
- 4205010
- Math proficiency
- 33% ▼ -14.00%
- Reading proficiency
- 55% ▼ -10.00%
- Median HH income
- $55,334
- Composite
- 38.23/100
- National rank
- #4247
- State rank
- #277 of 539 in PA
Livability — Mount Holly Springs
- Score
- 65/100
- State rank
- #1143
- US rank
- #13131
Category grades
Schools grade is shown separately in the Schools card above.
Census & demographics
- Census place
- Mount Holly Springs, PA
- Population (ZIP)
- 4,043
Population outlook (Cumberland County) Hauer SSP2
- Today (2025)
- 267,950 people
- By 2030
- 278,105 · +3.8%
- By 2040
- 296,552 · +10.7%
- By 2050
- 312,937 · +16.8%
- By 2075
- 349,233 · +30.3%
- By 2100
- 361,875 · +35.1%
Race, ethnicity, and origin ACS 2023
- Neighborhood character
- Predominantly White (78%)
- Race & ethnicity
- White 78% Black 9% Hispanic / Latino 6% Two or more races 5% Asian 2%
- Hispanic origin (detail)
- Mexican 2% Puerto Rican 2%
- Common ancestry
- Romanian 4% Slovak 2% Polish 1%
- Foreign-born
- 6% · Canada, India, South Korea
- Languages at home
- 92% English-only · Spanish 6% Other Indo-European 2% German/W. Germanic 1%
Political lean MEDSL · Cumberland
- 2024 margin
- Lean R (+9.4) · D 44.6% · R 54.1% · Other 1.3%
- 2008→2024 swing
- +4.2pp toward D · 2008: -13.6pp · 2024: -9.4pp
- All cycles
- 2024: R+9.4 2020: R+10.6 2016: R+18.6 2012: R+18.5 2008: R+13.6
Not yet ingested
- Civics
- —
Market trends
- HPI YoY
- ▼ -30.81%
- Current HPI
- 262.0582
- Rent YoY
- —
- Metro
- —
- State GDP YoY
- ▲ 1.68%
- F500 in state
- 34
Industry mix (Fortune 500 HQ in PA)
| Industry | F500 HQs | Revenue |
|---|---|---|
| Healthcare | 2 | $309B |
|
||
| Insurance | 2 | $27B |
|
||
| Telecommunications / Media | 1 | $124B |
|
||
| Industrial Distribution | 1 | $22B |
|
||
| Financial Services | 1 | $20B |
|
||
| Chemicals / Materials | 1 | $18B |
|
||
Price history
+0.0% since first listed3 events — show timeline
- 2026-02-18 Pending — BRIGHT MLS
- 2026-02-13 Listed $104,500 BRIGHT MLS
- 2026-02-12 Coming Soon $104,500 BRIGHT MLS
Property tax history
+3.0%/yrLatest (2026): $2,924 · +1.5% YoY. Source: county tax records.
Cash-flow waterfall
monthlySold comps — $/sqft
last 12 mo · ≤1 miLoading sold comps…