 Duplex
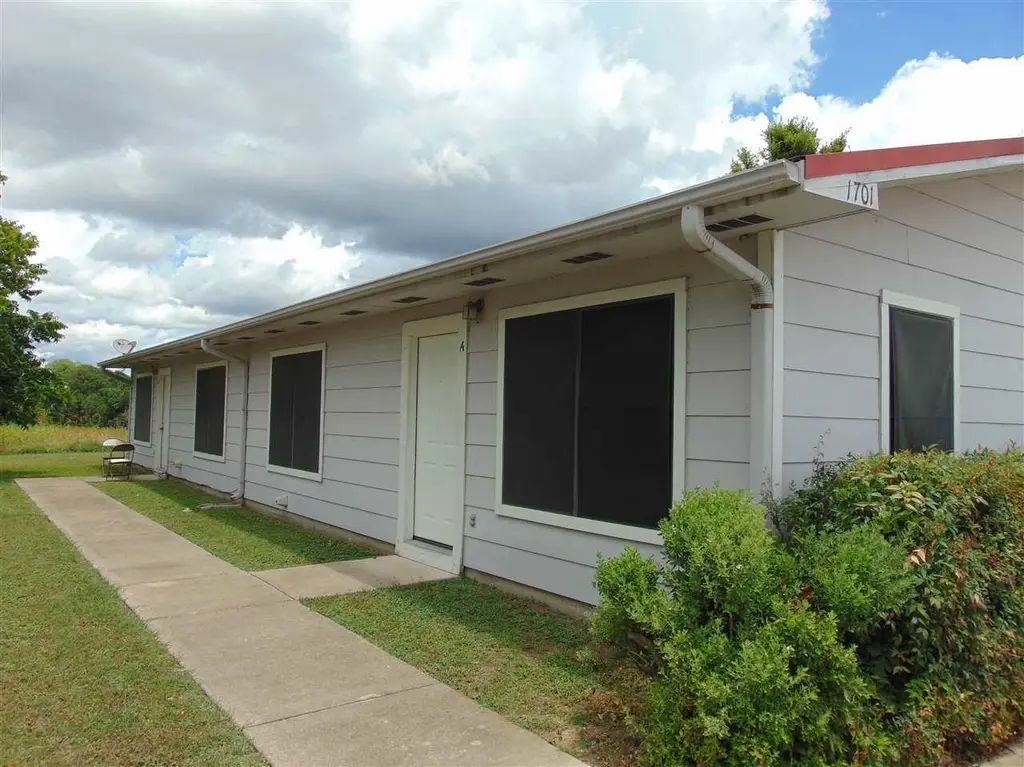
1701B Johnson St · Marble Falls, TX
Flood risk 1/10 · Minimal
- FEMA flood zone
- X (shaded)
- Chance of flooding over 30 yrs
- 0.0%
- Est. flood insurance / yr
- $507 – $1,088
Fire risk 4/10 · Minor
- Est. fire insurance / yr
- $1,222 – $2,270
Heat risk 8/10 · Major
- Hot days now (above 107°F)
- 7 days/yr
- Hot days in 30 yrs
- 23 days/yr
Wind risk 6/10 · Moderate
- Chance of severe wind over 30 yrs
- 57.0%
Air-quality risk 1/10 · Minimal
- Unhealthy air days now
- 0 days/yr
- Unhealthy air days in 30 yrs
- 0 days/yr
Risk factors via First Street. Map © Google.
Why this score? — see what drove the D grade
The composite is a weighted blend of 9 inputs, each scored 0–100. Each bar is that input's sub-score; the figure is the points it added to the 100-point composite (weight × sub-score).
- Cash flow +15.0/30.0
- ARV discount +7.5/15.0
- 1% rule +5.0/10.0
- DSCR +5.0/10.0
- Livability +3.5/5.0
- Schools +3.0/10.0
- Condition / age +2.5/5.0
- Rent growth +2.3/5.0
- Appreciation +0.0/10.0
$1,150
🖨 Deal sheet 📄 Offer letter ✓ Due diligence
Multi-family units
County records classify this as Multi-Family (2-4 Unit). Listing-text estimate: 2 units. confirmed
Listing remarks MLS
Incredible investment opportunity in the heart of Marble Falls! Ideally located between Westside Park and Johnson Park, this rare multi-unit property features five separate single-story duplex buildings situated on over 1 acre - totaling 10 units. Each unit offers a 2-bedroom, 2-bathroom layout with metal framing and metal studs. All units are currently occupied, providing immediate income. Tenants are responsible for all utilities and trash, maximizing owner efficiency. Property is serviced by city water and city sewer. Units 1803 A & B are built on pier and beam foundations and include attached garages and fenced yards. Units 1701–1707 are built on slab foundations and feature two designated paved parking spaces per unit. Significant recent upgrades include all metal roofs replaced in August 2025. The property has been meticulously maintained, with no history of pets or smoking, contributing to its excellent condition. All units are professionally managed by TJM Property Management and consistently lease quickly due to the property’s prime location and strong rental demand. Current rent rolls available with proof of funds and/or pre-approval, along with a signed NDA. This is a true turn-key investment opportunity in one of the fastest-growing areas of the Texas Hill Country—don’t miss it! Shown by appointment only.
Key facts
- 9,583 sq ft lot
- Built 2000
- Listed 41 days
Property features AI
Exterior
- Security: Smoke detectors
- Utilities: Public water; Public sewer
- Home design: Residential income property; Duplex
- Construction: Wood siding and brick exterior
- Exterior features: Composition roof
Interior
- Kitchen: Includes dishwasher and refrigerator
- Flooring: Carpet
- Heating & cooling: Central heating (electric); Central air; Ceiling fans
- Interior features: Dishwasher; Refrigerator; Carpet flooring
- Laundry & utility: Electric dryer hookup
Neighborhood map
What this means for you Summary
Snapshot
- This is a 2 × 2-bed/2.0-bath units multifamily listed at $1k.
Deal economics
- At list price, monthly cash flow is $2k ($27k/yr) — positive. Per door: $1k/mo.
- The deal already cash-flows at list — no discount required.
- Meets the 1% rule at list price ($3k rent vs $1k).
- Recommended offer: $1k (3.0% below list) — sets the bar for market timing.
- Cap rate 2393.6% vs local median 2.7% in Marble Falls — top-decile yield for the area; either an underpriced asset or a hidden risk that comps aren't pricing in. Stress-test before assuming the spread holds.
Location & tenants
- Location reads 70/100 on livability (#367 in TX) — a middle-class / working-renter tenant base. Strengths: cost of living A+, health & safety A+, housing A; Watch: crime C-, schools D, employment D.
- Marble Falls ISD (town): math 32% / reading 38% proficiency, ranked #511 of 826 in TX (top 62%) — families likely to look elsewhere, expect single-tenant / working-renter base with shorter leases.
- Market conditions: Rents soft (-0.6%/yr); 752 active listings in the ZIP; 7 comparable units currently listed for rent nearby; rentals at typical pace (median 15d on market — plan ~3-4 weeks tenant-placement turnaround); 891 units permitted in Burnet County in 2024 (76 in 5+ unit buildings).
- At $2,906/mo this rent would consume 47% of the median local household income ($74k/yr) (locally 354% of renters already pay >50% of income on rent) — very limited rent-growth headroom before tenants either downsize or default.
Forward outlook
- Local home prices are declining (-3.0%/yr); year-one equity from $8 of loan paydown is wiped out by about $34 of value loss. Plan a longer hold.
- Burnet County population projected at +22% by 2050 — long-run rental-demand tailwind backs the buy-and-hold thesis.
- At projected returns (-3.0% appreciation + 0.0% rent growth), your $322 cash investment doubles in ~1 year — after that, you're playing with house money.
Negotiation context
- It's been on market 41 days — a 3% lower offer ($1k) is reasonable based on typical stale-listing flexibility.
- 2 sale attempts with the ask held roughly flat each time — persistent listings suggest the price (not the market) is what's stuck; bring a comps-based counter.
Risks & watch-outs
- Climate carrying-cost: major wind risk, 57% chance of damaging wind over 30y; extreme-heat days projected 7→23/yr by 2055 (HVAC capex compounding) — expect insurance premiums to compound above CPI over the hold.
Questions for the listing agent
- It's been on market 41 days. Have you received any prior offers? Is the seller open to a 3% concession, seller financing, or rate buy-down credit?
- Can we see the unit-by-unit rent roll, current vacancy, and any below-market leases? What's the average tenancy length?
- What capital expenditures (roof, boiler, parking lot, exteriors) have been made in the last 5 years, and what's planned in the next 2?
- Is there a deadline driving the sale (1031 exchange, divorce, estate, relocation)? That informs how much negotiation room exists.
- Schools are D-rated, which usually means shorter tenancies and higher turnover. Who's the typical renter profile here, and what's been the actual vacancy rate?
- The area grade is low — what's the realistic commute time and amenity access for the typical tenant pool here? Any planned neighborhood developments (good or bad) we should know about?
- What's the average days-on-market for RENTAL listings here right now (not sales)? A rising rental-DOM trend means longer vacancies and softer asking-rent achievability than the comps imply.
- What's the recent tenant-quality profile in this submarket — average credit score on applications, eviction rate, late-payment / NSF rate, and stable-employment percentage? A property-management company in the area should have these aggregated.
- How much new apartment / multifamily construction is in the pipeline within 1–3 miles? Heavy new supply (>2% of stock underway) typically softens rents 12–24 months out; light construction supports rent growth.
Investment metrics
- 1% rule
- 252.70% ✓
- Cap rate
- 2393.55%
- Cash-on-cash
- 8525.94%
- DSCR
- 380.36
- GRM
- 0.0
CMA / ARV
No comps found within radius.
Projected returns pro-forma
-3.0% appreciation · 0.0% rent growth · sell at horizon
- IRR
- —
- Equity multiple
- 426.63×
- Total profit
- $137,052
- Equity at exit
- $171
- IRR
- —
- Equity multiple
- 852.66×
- Total profit
- $274,234
- Equity at exit
- $99
Cash invested: $322 (down + closing). Projections, not guarantees.
Landlord ↔ Tenant lean methodology
- Overall (STATE)
- 87 Strongly Landlord-Friendly
- State Texas
- 87 Strongly Landlord-Friendly · R+5
- County
- — inherits STATE
- City
- — inherits STATE
ZIP-level market 78654
- Home prices YoY
- -31.8%
- Rents YoY
- -0.6%
- Active inventory
- 752
- Price-to-rent
- 0.1×
Monthly cashflow live
- Estimated rent
- $2,906 high interval (Pro) →
- Mortgage (P&I)
- −$6
- Tax est. 1.5%
- −$1 /mo · $17/yr
- Insurance
- −$0
- HOA
- −$0
- Vacancy / Maint / Mgmt
- −$610
- Net cashflow
- $2,288
Break-even live
2-unit breakdown (identical units grouped — click to expand)
| Units | Beds | Baths | Est. rent |
|---|---|---|---|
| 2× units | 2 | 2 | $2,906 |
| #1 | 2 | 2 | $1,453 |
| #2 | 2 | 2 | $1,453 |
| Total (2 units) | $2,906 | ||
UW: 25.0% down · 7.5% · 30yr · 1.5% tax · 5.0% vac · 8.0% maint · 8.0% mgmt
Financing live
Cash to close
- Down payment
- $288
- Closing costs
- $34
- Reserves months
- —
- Total cash needed
- —
Loan-product check · same deal, 3 products live
Conventional
25% down · 7.5% · 30yr
- Down + closing
- —
- Monthly P&I
- —
- Monthly cashflow
- —
- DSCR
- —
- Eligible?
- —
Personal DTI + credit; lowest rate.
DSCR
20% down · 8.5% · 30yr
- Down + closing
- —
- Monthly P&I
- —
- Monthly cashflow
- —
- DSCR
- —
- Eligible?
- —
No personal income docs; deal must DSCR.
Hard money
10% down · 12.0% · 12mo
- Down + closing
- —
- Monthly P&I
- —
- Monthly cashflow
- —
- DSCR
- —
- Eligible?
- —
Short-term bridge; refi at stabilization.
Rent comps 7 comps
| Address | Beds | Baths | Sqft | Rent | $/sqft | DOM | Units | Dist |
|---|---|---|---|---|---|---|---|---|
| 301 Firestone Dr Meadowlakes, TX | 3.0 | 2.5 | 2101 | $2,700 | $1.29 | 21d | 1 | 0.32mi |
| 125 Dove Ln Meadowlakes, TX | 3.0 | 2.0 | 1740 | $2,300 | $1.32 | 4d | 1 | 0.41mi |
| 304 Avenue P Unit A Marble Falls, TX | 3.0 | 2.0 | 1500 | $2,200 | $1.47 | 14d | 1 | 0.47mi |
| 435 Saint Andrews St Meadowlakes, TX | 3.0 | 2.0 | 2066 | $2,500 | $1.21 | 43d | 1 | 0.62mi |
| 255 Braeburn Cir Meadowlakes, TX | 2.0 | 2.0 | 1308 | $1,500 | $1.15 | 14d | 1 | 0.70mi |
| 413 Olympia Fields St Meadowlakes, TX | 2.0 | 2.0 | 1406 | $1,800 | $1.28 | 3d | 1 | 0.80mi |
| 342 Columbine St Meadowlakes, TX | 3.0 | 2.0 | 1786 | $2,195 | $1.23 | 4d | 1 | 0.94mi |
Listing history 16 events
-
2026-06-18days on market $1,150 Active 41 DOM
-
2026-06-17days on market $1,150 Active 40 DOM
-
2026-06-16days on market $1,150 Active 39 DOM
-
2026-06-15days on market $1,150 Active 38 DOM
-
2026-06-13days on market $1,150 Active 36 DOM
-
2026-06-13days on market $1,150 Active 35 DOM
-
2026-06-09days on market $1,150 Active 32 DOM
-
2026-06-08days on market $1,150 Active 31 DOM
-
2026-06-07days on market $1,150 Active 30 DOM
-
2026-06-05days on market $1,150 Active 27 DOM
-
2026-06-03days on market $1,150 Active 26 DOM
-
2026-06-02days on market $1,150 Active 25 DOM
-
2026-06-01days on market $1,150 Active 24 DOM
-
2026-05-31days on market $1,150 Active 23 DOM
-
2026-05-08$1,150 Active 540-char remark
-
2026-04-02$1,750,000 Active 1368-char remark
Show marketing remark (1368 chars)
Incredible investment opportunity in the heart of Marble Falls! Ideally located between Westside Park and Johnson Park, this rare multi-unit property features five separate single-story duplex buildings situated on over 1 acre - totaling 10 units. Each unit offers a 2-bedroom, 2-bathroom layout with metal framing and metal studs. All units are currently occupied, providing immediate income. Tenants are responsible for all utilities and trash, maximizing owner efficiency. Property is serviced by city water and city sewer. Units 1803 A & B are built on pier and beam foundations and include attached garages and fenced yards. Units 1701–1707 are built on slab foundations and feature two designated paved parking spaces per unit. Significant recent upgrades include all metal roofs replaced in August 2025. The property has been meticulously maintained, with no history of pets or smoking, contributing to its excellent condition. All units are professionally managed by TJM Property Management and consistently lease quickly due to the property’s prime location and strong rental demand. Current rent rolls available with proof of funds and/or pre-approval, along with a signed NDA. This is a true turn-key investment opportunity in one of the fastest-growing areas of the Texas Hill Country—don’t miss it! Shown by appointment only.
ⓘ Source: listings_history table (triggers on properties + properties_extension) + one-shot
backfill from property_details.listing_events for pre-trigger history.
Climate risk First Street
- Flood 1/10 Low FEMA zone X (shaded) · 0% chance over 30 yrs
- Wildfire 4/10 Moderate
- Heat 8/10 Severe 7 d/yr ≥107°F today · 23 d/yr by 30 yrs out
- Wind 6/10 Major 57% chance of damaging wind over 30 yrs
- Air quality 1/10 Low 0 unhealthy d/yr today · 0 by 30 yrs out
Nearby sold comps map
Loading sold comps map…
Walkable amenities ~0.75 mi
Loading nearby amenities…
Taxation est. · year 1
- Rental income
- $34,872
- − Mortgage interest
- −$64
- − Property taxes
- −$17
- − Insurance
- −$6
- − Repairs & maintenance
- −$2,790
- − Management
- −$2,790
- − Depreciation
- −$33
- Taxable income
- $29,172
- Est. tax owed @ 24.0%
- −$7,001
- After-tax cash flow
- $20,452/yr
For passive investors: Depreciation is non-cash, so a rental often shows a tax loss while cash-flowing — sheltering income. Rental losses are passive: they offset passive income freely, and up to $25,000/yr can offset ordinary (W-2) income if you actively participate and your MAGI is under $100k (phasing out to $0 by $150k); unused losses carry forward. On sale, claimed depreciation is recaptured at up to 25%, and gains may owe capital-gains tax (a 1031 exchange can defer both). Figures are a year-1 estimate at your 24.0% rate — not tax advice; consult a CPA.
Schools (NCES district)
- District
- Marble Falls ISD
- NCES district ID
- 4829010
- Math proficiency
- 32% ▼ -8.00%
- Reading proficiency
- 38% ▼ -4.00%
- Median HH income
- $49,663
- Composite
- 30.3/100
- National rank
- #6278
- State rank
- #511 of 826 in TX
Livability — Marble Falls
- Score
- 70/100
- State rank
- #367
- US rank
- #7802
Category grades
Schools grade is shown separately in the Schools card above.
Census & demographics
- Census place
- Marble Falls, TX
- County
- Burnet County · 35,210 people
- City population
- 20,650
- Metro
- Austin-Round Rock-Georgetown, TX
- Population (ZIP)
- 20,650
- Household income
- $74,130
- Rent vs Own
- Severe rent burden
- 354.0
Population outlook (Burnet County) Hauer SSP2
- Today (2025)
- 50,492 people
- By 2030
- 52,995 · +5.0%
- By 2040
- 57,528 · +13.9%
- By 2050
- 61,444 · +21.7%
- By 2075
- 71,098 · +40.8%
- By 2100
- 74,634 · +47.8%
Race, ethnicity, and origin ACS 2023
- Neighborhood character
- Predominantly White (68%)
- Race & ethnicity
- White 68% Hispanic / Latino 28% Two or more races 8%
- Hispanic origin (detail)
- Mexican 24%
- Common ancestry
- Serbian 2% Italian 2% Slovak 2%
- Foreign-born
- 8% · Canada
- Languages at home
- 81% English-only · Spanish 18% Other Indo-European 1%
Political lean MEDSL · Burnet
- 2024 margin
- Solid R (+55.7) · D 21.7% · R 77.4%
- 2008→2024 swing
- -11.6pp toward R · 2008: -44.1pp · 2024: -55.7pp
- All cycles
- 2024: R+55.7 2020: R+53.1 2016: R+56.8 2012: R+54.6 2008: R+44.1
Not yet ingested
- Civics
- —
Market trends
- HPI YoY
- ▼ -118.02%
- Current HPI
- 252.9861
- Rent YoY
- ▼ -0.62%
- Metro
- Austin-Round Rock-Georgetown, TX
- State GDP YoY
- ▲ 3.95%
- F500 in state
- 110
Industry mix (Fortune 500 HQ in TX)
| Industry | F500 HQs | Revenue |
|---|---|---|
| Energy | 16 | $1,198B |
|
||
| Technology | 5 | $198B |
|
||
| Engineering / Construction | 4 | $72B |
|
||
| Energy Services | 3 | $60B |
|
||
| Utilities | 3 | $41B |
|
||
| Healthcare | 2 | $330B |
|
||
Price history
-99.9% since first listed2 events — show timeline
- 2026-05-08 Listed $1,150 HLMLS as distributed by MLS GRID
- 2026-04-02 Listed $1,750,000 HLMLS as distributed by MLS GRID
Property tax history
+5.5%/yrLatest (2026): $3,716 · +0.2% YoY. Source: county tax records.
Cash-flow waterfall
monthlySold comps — $/sqft
last 12 mo · ≤1 miLoading sold comps…