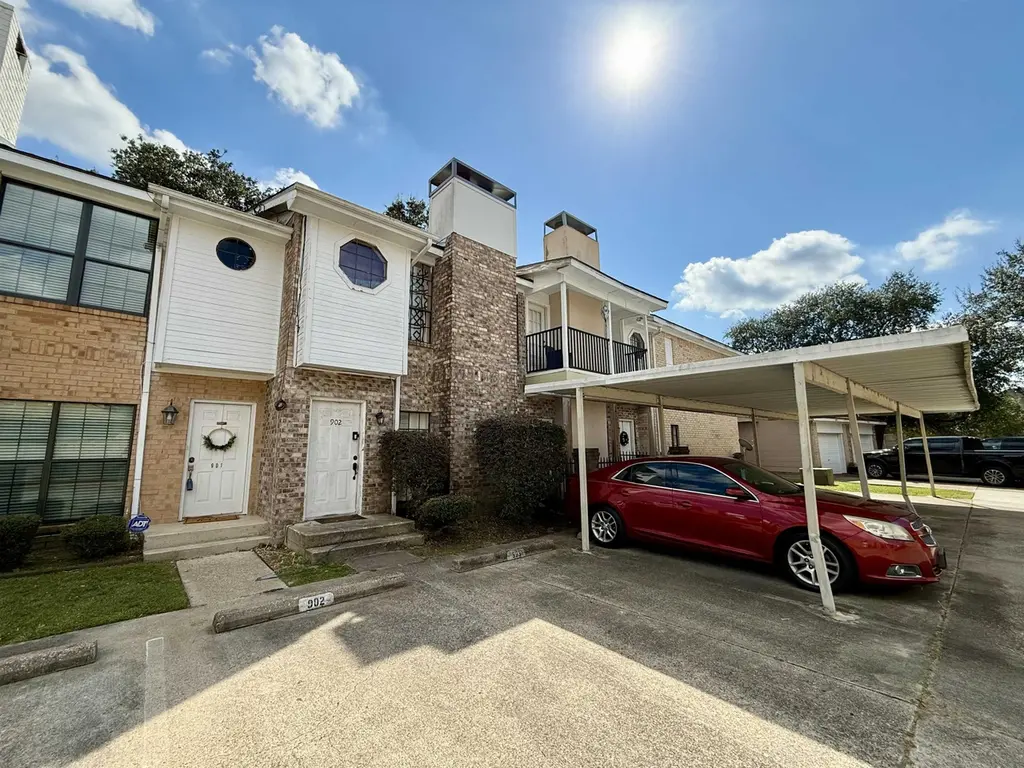
1620 Wellington Place, Unit 902 Pl · Beaumont, TX
Flood risk 7/10 · Major
- FEMA flood zone
- X
- Chance of flooding over 30 yrs
- 0.77%
- Est. flood insurance / yr
- $507 – $1,088
Fire risk 1/10 · Minimal
- Est. fire insurance / yr
- $1,222 – $2,270
Heat risk 9/10 · Severe
- Hot days now (above 110°F)
- 6 days/yr
- Hot days in 30 yrs
- 21 days/yr
Wind risk 9/10 · Severe
- Chance of severe wind over 30 yrs
- 99.0%
Air-quality risk 2/10 · Minimal
- Unhealthy air days now
- 1 days/yr
- Unhealthy air days in 30 yrs
- 1 days/yr
Risk factors via First Street. Map © Google.
Why this score? — see what drove the D- grade
The composite is a weighted blend of 9 inputs, each scored 0–100. Each bar is that input's sub-score; the figure is the points it added to the 100-point composite (weight × sub-score).
- ARV discount +15.0/15.0
- Cash flow +7.4/30.0
- 1% rule +6.2/10.0
- Livability +3.2/5.0
- Rent growth +2.7/5.0
- Condition / age +2.5/5.0
- DSCR +1.5/10.0
- Schools +1.5/10.0
- Appreciation +0.0/10.0
$125,000
🖨 Deal sheet 📄 Offer letter ✓ Due diligence
Listing remarks MLS
Discover Wellington Place Condos, a peaceful Beaumont community featuring a community pool and well-tended landscaping. This inviting 2-bedroom, 2.5-bath unit blends functionality with charm, offering an open-concept living space, private bathrooms for each bedroom, and a split-level design ideal for comfort and privacy. Whether you’re downsizing, investing, or buying your first home, you’ll love the easy maintenance and friendly atmosphere Wellington Place is known for. Call today!
Key facts
- Private bathrooms
- Community pool
- Split-level design
Tags
Neighborhood map
What this means for you Summary
Snapshot
- This is a 2-bed/2.5-bath condo listed at $125k.
Deal economics
- At list price, monthly cash flow is $-230 ($-3k/yr) — negative.
- The deal already cash-flows at list — no discount required.
- Meets the 1% rule at list price ($1k rent vs $125k).
- Recommended offer: $110k (12.0% below list) — sets the bar for market timing.
Location & tenants
- Location reads 64/100 on livability (#739 in TX) — a middle-class / working-renter tenant base. Strengths: cost of living A+, housing A+, health & safety A+; Watch: employment D, schools D-, crime F.
- Beaumont ISD (urban): math 14% / reading 22% proficiency, ranked #789 of 826 in TX (top 96%) — low school quality limits family demand, transient renter base, plan for 1-2y turnover; 69% free/reduced lunch — lower-income household profile, screen leases tightly.
- Market conditions: Rents flat; 258 active listings in the ZIP; 19 comparable units currently listed for rent nearby; rentals at typical pace (median 23d on market — plan ~3-4 weeks tenant-placement turnaround); 343 units permitted in Jefferson County in 2024 (0 in 5+ unit buildings).
Forward outlook
- Local home prices are declining (-3.0%/yr); year-one equity from $864 of loan paydown is wiped out by about $4k of value loss. Plan a longer hold.
Negotiation context
- It's been on market 241 days — a 12% lower offer ($110k) is reasonable based on typical stale-listing flexibility.
Risks & watch-outs
- Watch-outs: flood insurance adds $66/mo; HOA is 23% of rent.
- Climate carrying-cost: major flood risk; severe wind risk, 99% chance of damaging wind over 30y; extreme-heat days projected 6→21/yr by 2055 (HVAC capex compounding) — expect insurance premiums to compound above CPI over the hold.
Questions for the listing agent
- What do current leases actually rent for vs. the listed asking? Can we see a recent rent roll and the last 12 months of T-12 income?
- It's been on market 241 days. Have you received any prior offers? Is the seller open to a 12% concession, seller financing, or rate buy-down credit?
- What's the actual annual flood-insurance premium (NFIP or private), and is the property in a SFHA with mandatory coverage?
- What does the HOA fee cover, when was the last increase, and are there any pending special assessments or reserve-fund shortfalls?
- Any open or pending special assessments — roof, HVAC, plumbing, elevator, façade? What's the per-unit balance and payoff schedule, and is the seller paying it off at close or rolling it to the buyer?
- Why hasn't it sold? Are there any deal-killer items the seller is aware of (foundation, flood, title, zoning, code violations)?
- Is there a deadline driving the sale (1031 exchange, divorce, estate, relocation)? That informs how much negotiation room exists.
- Schools are D-rated, which usually means shorter tenancies and higher turnover. Who's the typical renter profile here, and what's been the actual vacancy rate?
- Crime grade is F in this area — have there been break-ins, vandalism, or insurance claims at this property in the last 3 years? What carrier currently insures it and at what premium?
- The area grade is low — what's the realistic commute time and amenity access for the typical tenant pool here? Any planned neighborhood developments (good or bad) we should know about?
- What's the average days-on-market for RENTAL listings here right now (not sales)? A rising rental-DOM trend means longer vacancies and softer asking-rent achievability than the comps imply.
- What's the recent tenant-quality profile in this submarket — average credit score on applications, eviction rate, late-payment / NSF rate, and stable-employment percentage? A property-management company in the area should have these aggregated.
- How much new apartment / multifamily construction is in the pipeline within 1–3 miles? Heavy new supply (>2% of stock underway) typically softens rents 12–24 months out; light construction supports rent growth.
Investment metrics
- 1% rule
- 1.12% ✓
- Cap rate
- 4.73%
- Cash-on-cash
- -5.59%
- DSCR
- 0.75
- GRM
- 7.4
CMA / ARV
- ARV (median comp)
- $154,798
- List price
- $125,000
- Delta
- -19.25%
- Verdict
- UNDERPRICED
- Comps
- 9 within 1.0 mi
Projected returns pro-forma
-3.0% appreciation · 0.66% rent growth · sell at horizon
- IRR
- -34.3%
- Equity multiple
- -0.08×
- Total profit
- $-37,790
- Equity at exit
- $18,638
- IRR
- -74.3%
- Equity multiple
- -0.80×
- Total profit
- $-63,082
- Equity at exit
- $10,808
Cash invested: $35,000 (down + closing). Projections, not guarantees.
Landlord ↔ Tenant lean methodology
- Overall (STATE)
- 87 Strongly Landlord-Friendly
- State Texas
- 87 Strongly Landlord-Friendly · R+5
- County
- — inherits STATE
- City
- — inherits STATE
ZIP-level market 77706
- Rents YoY
- 0.7%
- Active inventory
- 258
- Price-to-rent
- 7.4×
Monthly cashflow live
- Estimated rent
- $1,399 high interval (Pro) →
- Mortgage (P&I)
- −$656
- Tax from tax record
- −$238 /mo · $2,855/yr
- Insurance
- −$52
- Flood insurance flood zone
- −$66 /mo · $798/yr
- HOA est. from 1 same-building comp
- −$323
- Vacancy / Maint / Mgmt
- −$294
- Net cashflow
- $-230
Break-even live
UW: 25.0% down · 7.5% · 30yr · 1.5% tax · 5.0% vac · 8.0% maint · 8.0% mgmt
Financing live
Cash to close
- Down payment
- $31,250
- Closing costs
- $3,750
- Reserves months
- —
- Total cash needed
- —
Loan-product check · same deal, 3 products live
Conventional
25% down · 7.5% · 30yr
- Down + closing
- —
- Monthly P&I
- —
- Monthly cashflow
- —
- DSCR
- —
- Eligible?
- —
Personal DTI + credit; lowest rate.
DSCR
20% down · 8.5% · 30yr
- Down + closing
- —
- Monthly P&I
- —
- Monthly cashflow
- —
- DSCR
- —
- Eligible?
- —
No personal income docs; deal must DSCR.
Hard money
10% down · 12.0% · 12mo
- Down + closing
- —
- Monthly P&I
- —
- Monthly cashflow
- —
- DSCR
- —
- Eligible?
- —
Short-term bridge; refi at stabilization.
Rent comps 19 comps
| Address | Beds | Baths | Sqft | Rent | $/sqft | DOM | Units | Dist |
|---|---|---|---|---|---|---|---|---|
| 1620 Wellington Pl #903 Beaumont, TX | 2.0 | 2.5 | 1215 | $1,750 | $1.44 | 43d | 1 | 0.03mi |
| 2005 Dowlen Rd #5 Beaumont, TX | 1.0 | 1.0 | 722 | $1,000 | $1.39 | 43d | 1 | 0.27mi |
| 2015 Dowlen Rd #8 Beaumont, TX | 1.0 | 1.0 | 722 | $1,000 | $1.39 | 23d | 1 | 0.27mi |
| 2015 Dowlen Rd #3 Beaumont, TX | 1.0 | 1.0 | 722 | $1,000 | $1.39 | 43d | 1 | 0.27mi |
| 2005 Dowlen Rd Beaumont, TX | 1.0 | 1.0 | 722 | $1,000 | $1.39 | 13d | 1 | 0.33mi |
| 6250 Ivanhoe Ln Beaumont, TX | 1.0–2.0 | 1.0–2.0 | 885 | $1,604 | $1.81 | 13d | 9 | 0.99mi |
| 458 Belvedere Dr Beaumont, TX | 3.0 | 2.0 | 1465 | $1,595 | $1.09 | 21d | 1 | 1.00mi |
| 520 Dowlen Rd Beaumont, TX | 1.0–2.0 | 1.0–2.0 | 940 | $1,050 | $1.12 | 13d | 10 | 1.13mi |
| 6561 Lexington Dr Beaumont, TX | 2.0 | 2.0 | 1321 | $1,011 | $0.77 | 43d | 1 | 1.30mi |
| 85 E Caldwood Dr Beaumont, TX | 2.0 | 1.5 | 1330 | $1,223 | $0.92 | 43d | 2 | 1.31mi |
| 85 E Caldwood Dr #6 Beaumont, TX | 2.0 | 1.5 | 1331 | $1,250 | $0.94 | 23d | 1 | 1.31mi |
| 5550 Folsom Dr Beaumont, TX | 1.0–2.0 | 1.0–2.0 | 756 | $1,751 | $2.32 | 23d | 1 | 1.33mi |
| 1212 N Major Dr Beaumont, TX | 2.0 | 1.5 | 1232 | $1,250 | $1.01 | 13d | 1 | 1.38mi |
| 5110 Laurel St Beaumont, TX | 3.0 | 2.0 | 1303 | $1,995 | $1.53 | 21d | 1 | 1.38mi |
| 1450 N Major Dr Beaumont, TX | 1.0–2.0 | 1.0–2.0 | 849 | $1,188 | $1.40 | 13d | 17 | 1.39mi |
| 6120 Folsom Dr Beaumont, TX | 1.0–2.0 | 1.0–2.0 | 901 | $1,499 | $1.66 | 43d | 1 | 1.39mi |
| 1456 N Major Dr Beaumont, TX | 2.0 | 2.0 | 1008 | $1,079 | $1.07 | 43d | 1 | 1.42mi |
| 565 25th St Beaumont, TX | 2.0 | 2.0 | 1128 | $1,650 | $1.46 | 13d | 1 | 1.46mi |
| 1605 Cornerstone Ct Beaumont, TX | 1.0–2.0 | 1.0–2.0 | 818 | $1,108 | $1.35 | 13d | 17 | 1.50mi |
HOA detail condo
- Monthly dues
- $0 · $0/yr
- Likely covers
- landscapingpool
- Assessments
- None detected in remarks — confirm with the listing agent.
Listing history 18 events
-
2026-06-18days on market $125,000 Active 241 DOM
-
2026-06-17days on market $125,000 Active 240 DOM
-
2026-06-16days on market $125,000 Active 239 DOM
-
2026-06-15days on market $125,000 Active 238 DOM
-
2026-06-14days on market $125,000 Active 236 DOM
-
2026-06-13days on market $125,000 Active 235 DOM
-
2026-06-10days on market $125,000 Active 233 DOM
-
2026-06-09days on market $125,000 Active 232 DOM
-
2026-06-08days on market $125,000 Active 231 DOM
-
2026-06-07days on market $125,000 Active 230 DOM
-
2026-06-03days on market $125,000 Active 226 DOM
-
2026-06-02days on market $125,000 Active 225 DOM
-
2026-06-01days on market $125,000 Active 224 DOM
-
2026-05-31days on market $125,000 Active 223 DOM
-
2026-05-30days on market $125,000 Active 222 DOM
-
2025-10-20$125,000 Active 499-char remark
Show marketing remark (499 chars)
Discover Wellington Place Condos, a peaceful Beaumont community featuring a community pool and well-tended landscaping. This inviting 2-bedroom, 2.5-bath unit blends functionality with charm, offering an open-concept living space, private bathrooms for each bedroom, and a split-level design ideal for comfort and privacy. Whether you’re downsizing, investing, or buying your first home, you’ll love the easy maintenance and friendly atmosphere Wellington Place is known for. Call today!
-
2011-04-21soldstatus
-
2006-10-11soldstatus
ⓘ Source: listings_history table (triggers on properties + properties_extension) + one-shot
backfill from property_details.listing_events for pre-trigger history.
Tax reassessment forecast TX · Resets to sale price
- Current annual tax
- $2,855 · $238/mo
- Projected year-2 tax
- $2,855 · $238/mo
- Expected delta
- $0/yr ($0/mo · 0.0%)
ⓘ Screening estimate from a state-policy table — verify with the county assessor before closing.
Climate risk First Street
- Flood 7/10 Severe FEMA zone X · 77% chance over 30 yrs
- Wildfire 1/10 Low
- Heat 9/10 Extreme 6 d/yr ≥110°F today · 21 d/yr by 30 yrs out
- Wind 9/10 Extreme 99% chance of damaging wind over 30 yrs
- Air quality 2/10 Low 1 unhealthy d/yr today · 1 by 30 yrs out
Nearby sold comps map
Loading sold comps map…
Walkable amenities ~0.75 mi
Loading nearby amenities…
Taxation est. · year 1
- Rental income
- $16,790
- − Mortgage interest
- −$7,002
- − Property taxes
- −$2,855
- − Insurance
- −$1,422
- − Repairs & maintenance
- −$1,343
- − Management
- −$1,343
- − HOA
- −$3,876
- − Depreciation
- −$3,636
- Taxable loss
- −$4,688
- Est. tax savings @ 24.0%
- +$1,125
- After-tax cash flow
- $-1,630/yr
For passive investors: Depreciation is non-cash, so a rental often shows a tax loss while cash-flowing — sheltering income. Rental losses are passive: they offset passive income freely, and up to $25,000/yr can offset ordinary (W-2) income if you actively participate and your MAGI is under $100k (phasing out to $0 by $150k); unused losses carry forward. On sale, claimed depreciation is recaptured at up to 25%, and gains may owe capital-gains tax (a 1031 exchange can defer both). Figures are a year-1 estimate at your 24.0% rate — not tax advice; consult a CPA.
Schools (NCES district)
- District
- Beaumont ISD
- NCES district ID
- 4809670
- Math proficiency
- 14% ▼ -13.00%
- Reading proficiency
- 22% ▼ -7.00%
- Median HH income
- $41,683
- Composite
- 15.43/100
- National rank
- #9316
- State rank
- #789 of 826 in TX
Livability — Beaumont
- Score
- 64/100
- State rank
- #739
- US rank
- #13710
Category grades
Schools grade is shown separately in the Schools card above.
Census & demographics
- Census place
- Beaumont, TX
- County
- Jefferson County · 203,592 people
- City population
- 125,901
- Metro
- Beaumont-Port Arthur, TX
- Population (ZIP)
- 30,393
- Household income
- $73,185
- Rent vs Own
- Severe rent burden
- 1299.0
Population outlook (Jefferson County) Hauer SSP2
- Today (2025)
- 259,015 people
- By 2030
- 260,685 · +0.6%
- By 2040
- 263,309 · +1.7%
- By 2050
- 265,237 · +2.4%
- By 2075
- 270,193 · +4.3%
- By 2100
- 255,628 · -1.3%
Race, ethnicity, and origin ACS 2023
- Neighborhood character
- Diverse neighborhood (Simpson 0.61)
- Race & ethnicity
- White 56% Black 24% Hispanic / Latino 13% Two or more races 9% Asian 4%
- Hispanic origin (detail)
- Mexican 10%
- Common ancestry
- Lithuanian 4% Iranian 3% Slovak 2%
- Foreign-born
- 8% · Canada, China
- Languages at home
- 87% English-only · Spanish 8% Other Indo-European 2% German/W. Germanic 1%
Political lean MEDSL · Jefferson
- 2024 margin
- Lean R (+8.9) · D 45.1% · R 54.0%
- 2008→2024 swing
- -11.1pp toward R · 2008: 2.2pp · 2024: -8.9pp
- All cycles
- 2024: R+8.9 2020: R+1.6 2016: R+0.5 2012: D+1.6 2008: D+2.2
Not yet ingested
- Civics
- —
Market trends
- HPI YoY
- ▼ -180.53%
- Current HPI
- 159.4053
- Rent YoY
- ▲ 0.66%
- Metro
- Beaumont-Port Arthur, TX
- State GDP YoY
- ▲ 3.95%
- F500 in state
- 110
Industry mix (Fortune 500 HQ in TX)
| Industry | F500 HQs | Revenue |
|---|---|---|
| Energy | 16 | $1,198B |
|
||
| Technology | 5 | $198B |
|
||
| Engineering / Construction | 4 | $72B |
|
||
| Energy Services | 3 | $60B |
|
||
| Utilities | 3 | $41B |
|
||
| Healthcare | 2 | $330B |
|
||
Price history
3 events — show timeline
- 2025-10-20 Listed $125,000 BBOR
- 2011-04-21 Sold (Public Records) — Public Records
- 2006-10-11 Sold (Public Records) — Public Records
Property tax history
+2.5%/yrLatest (2025): $2,855 · +9.7% YoY. Source: county tax records.
Cash-flow waterfall
monthlySold comps — $/sqft
last 12 mo · ≤1 miLoading sold comps…