 🌊 Lakefront
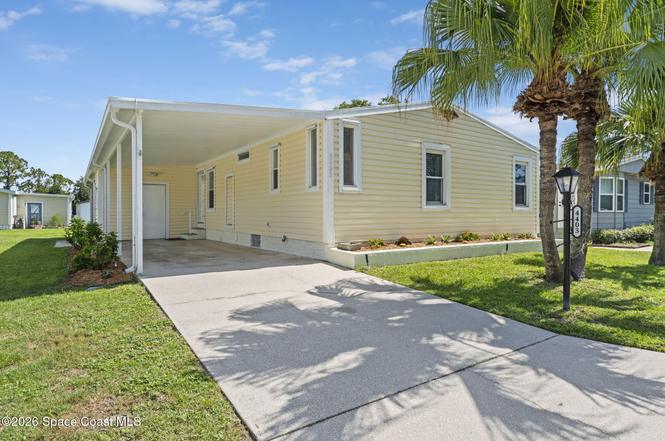
4403 Twin Lakes Dr · Melbourne, FL
Flood risk 4/10 · Minor
- FEMA flood zone
- X (unshaded)
- Chance of flooding over 30 yrs
- 0.22%
- Est. flood insurance / yr
- $507 – $1,088
Fire risk 4/10 · Minor
- Est. fire insurance / yr
- $947 – $1,759
Heat risk 10/10 · Severe
- Hot days now (above 106°F)
- 7 days/yr
- Hot days in 30 yrs
- 23 days/yr
Wind risk 10/10 · Severe
- Chance of severe wind over 30 yrs
- 99.0%
Air-quality risk 1/10 · Minimal
- Unhealthy air days now
- 0 days/yr
- Unhealthy air days in 30 yrs
- 0 days/yr
Risk factors via First Street. Map © Google.
Why this score? — see what drove the C grade
The composite is a weighted blend of 9 inputs, each scored 0–100. Each bar is that input's sub-score; the figure is the points it added to the 100-point composite (weight × sub-score).
- Cash flow +24.7/30.0
- DSCR +8.0/10.0
- ARV discount +7.5/15.0
- 1% rule +6.2/10.0
- Schools +4.7/10.0
- Rent growth +3.4/5.0
- Livability +2.5/5.0
- Condition / age +2.5/5.0
- Appreciation +0.0/10.0
$158,995
🖨 Deal sheet 📄 Offer letter ✓ Due diligence
Listing remarks MLS
IMMACULATE LAKEFRONT HOME IN DESIRABLE 55+ COMMUNITY WITH POOL; CLOSE TO EVERYTHING BUT IN A SERENE SETTING! LOVELY NEW VINYL, NEWER ROOF, A/C. ENCLOSED FLORIDA ROOM WITH GREAT VIEW OF THE LAKE. LARGE MASTER(18X12) WITH DOUBLE SINKS. INCLUDES HURRICANE SHUTTERS, REFRIGERATOR W/ ICE & WATER, AND RELAXING PORCH TO ENJOY THOSE WARM GENTLE BREEZES.
Key facts
- Clubhouse
- Lake views
- Community pool
Tags
Property features AI
Finance
- HOA & community: Association: Twin Lakes; Community clubhouse; Monthly association fee of $115; Senior community
Exterior
- Parking: Carport (1 space)
- Utilities: Public sewer; Electricity connected; Water connected; Sewer connected
- Home design: Manufactured home; One level; Faces south
- Construction: Frame construction; Shingle roof
- Exterior features: Covered rear porch; Few trees; City street frontage; Asphalt road surface; Lakefront waterfront
Interior
- Kitchen: Electric oven; Dishwasher
- Bedrooms: 2 bedrooms
- Flooring: Laminate; Tile; Vinyl
- Bathrooms: 2 full bathrooms
- Heating & cooling: Central heating (electric); Central air conditioning
- Interior features: Breakfast bar; Ceiling fans; Open floor plan; Walk-in closets
- Laundry & utility: Washer and dryer in unit
Neighborhood map
What this means for you Summary
Snapshot
- This is a 2-bed/2.0-bath manufactured listed at $159k.
Deal economics
- At list price, monthly cash flow is $331 ($4k/yr) — positive.
- The deal already cash-flows at list — no discount required.
- Meets the 1% rule at list price ($2k rent vs $159k).
Location & tenants
- Location reads: area grade C — affects rentability + tenant quality, not the cash-flow math above.
- Brevard (suburban): math 53% / reading 57% proficiency, ranked #19 of 73 in FL (top 26%) — acceptable for families but not a draw, mixed tenant base, ~2y average lease.
- Zoned schools: Sabal Elementary School (math 38% / reading 41%, grade F, #1,513 of 2,144 statewide, top 73%, 503 students, 69% FRL); Lyndon B. Johnson Middle School (math 40% / reading 42%, grade F, #353 of 571 statewide, top 63%, 610 students, 61% FRL) — zoned schools average 65% FRL vs 43% district-wide (22 pts higher); higher-poverty schools than district average — tighter screening recommended.
- Zoned-school proficiency averages 40% at this address vs 55% district-wide (-15 pts) — the specific schools serving this property underperform the Brevard average; the district grade overstates school quality for this exact location.
- Market conditions: Rents rising (+3.7%/yr); 102 active listings in the ZIP; 3 comparable units currently listed for rent nearby; rentals at typical pace (median 24d on market — plan ~3-4 weeks tenant-placement turnaround); solid renter incomes; 4,602 units permitted in Brevard County in 2024 (702 in 5+ unit buildings).
Forward outlook
- Local home prices are declining (-3.0%/yr); year-one equity from $1k of loan paydown is wiped out by about $5k of value loss. Plan a longer hold.
- Brevard County population projected at +15% by 2050 — modest demand growth; plan on rents tracking national, not racing it.
Negotiation context
- Only 1 days on market — expect competitive offers; lowballing is unlikely to land.
- 8 sale attempts since 21y ago with the ask held roughly flat each time — persistent listings suggest the price (not the market) is what's stuck; bring a comps-based counter.
- Current owner paid $67k; list at $159k implies a 138% gain — meaningful room to come down on a strong offer.
Risks & watch-outs
- Climate carrying-cost: severe wind risk, 99% chance of damaging wind over 30y; extreme-heat days projected 7→23/yr by 2055 (HVAC capex compounding) — expect insurance premiums to compound above CPI over the hold.
Questions for the listing agent
- What does the HOA fee cover, when was the last increase, and are there any pending special assessments or reserve-fund shortfalls?
- Is there a deadline driving the sale (1031 exchange, divorce, estate, relocation)? That informs how much negotiation room exists.
- This sits on a lake — are riparian / water-frontage rights deeded with the parcel? Any dock permits, shoreline easements, or HOA water-use restrictions?
- What's the documented flood / surge / shoreline-erosion history here (FEMA AND non-FEMA — e.g., storm surge, creek backup, septic-field saturation)?
- Any water-quality or seasonal algae-bloom issues that affect tenant satisfaction or short-term-rental demand?
- What's the average days-on-market for RENTAL listings here right now (not sales)? A rising rental-DOM trend means longer vacancies and softer asking-rent achievability than the comps imply.
- What's the recent tenant-quality profile in this submarket — average credit score on applications, eviction rate, late-payment / NSF rate, and stable-employment percentage? A property-management company in the area should have these aggregated.
- How much new for-sale + rental construction is in the pipeline within 1–3 miles? Heavy new supply typically softens prices + rents 12–24 months out; constrained supply supports both.
Investment metrics
- 1% rule
- 1.12% ✓
- Cap rate
- 8.79%
- Cash-on-cash
- 8.92%
- DSCR
- 1.40
- GRM
- 7.4
CMA / ARV
No comps found within radius.
Projected returns pro-forma
-3.0% appreciation · 3.72% rent growth · sell at horizon
- IRR
- -2.0%
- Equity multiple
- 0.92×
- Total profit
- $-3,373
- Equity at exit
- $23,707
- IRR
- 8.5%
- Equity multiple
- 1.67×
- Total profit
- $29,678
- Equity at exit
- $13,747
Cash invested: $44,519 (down + closing). Projections, not guarantees.
Landlord ↔ Tenant lean methodology
- Overall (STATE)
- 87 Strongly Landlord-Friendly
- State Florida
- 87 Strongly Landlord-Friendly · R+3
- County
- — inherits STATE
- City
- — inherits STATE
ZIP-level market 32934
- Home prices YoY
- -20.0%
- Rents YoY
- 3.7%
- Active inventory
- 102
- Price-to-rent
- 7.4×
Monthly cashflow live
- Estimated rent
- $1,784 medium interval (Pro) →
- Mortgage (P&I)
- −$834
- Tax from tax record
- −$63 /mo · $757/yr
- Insurance
- −$66
- HOA
- −$115
- Vacancy / Maint / Mgmt
- −$375
- Net cashflow
- $331
Break-even live
UW: 25.0% down · 7.5% · 30yr · 1.5% tax · 5.0% vac · 8.0% maint · 8.0% mgmt
Financing live
Cash to close
- Down payment
- $39,749
- Closing costs
- $4,770
- Reserves months
- —
- Total cash needed
- —
Loan-product check · same deal, 3 products live
Conventional
25% down · 7.5% · 30yr
- Down + closing
- —
- Monthly P&I
- —
- Monthly cashflow
- —
- DSCR
- —
- Eligible?
- —
Personal DTI + credit; lowest rate.
DSCR
20% down · 8.5% · 30yr
- Down + closing
- —
- Monthly P&I
- —
- Monthly cashflow
- —
- DSCR
- —
- Eligible?
- —
No personal income docs; deal must DSCR.
Hard money
10% down · 12.0% · 12mo
- Down + closing
- —
- Monthly P&I
- —
- Monthly cashflow
- —
- DSCR
- —
- Eligible?
- —
Short-term bridge; refi at stabilization.
Rent comps 3 comps
| Address | Beds | Baths | Sqft | Rent | $/sqft | DOM | Units | Dist |
|---|---|---|---|---|---|---|---|---|
| 1703 Blanche Ave Melbourne, FL | 2.0 | 2.0 | 840 | $1,650 | $1.96 | 23d | 1 | 0.31mi |
| 3600 Aurora Rd Unit A Melbourne, FL | 2.0 | 1.0 | 755 | $1,850 | $2.45 | 23d | 1 | 0.90mi |
| 1758 Caleb Ln Melbourne, FL | 3.0 | 2.0 | 1400 | $2,350 | $1.68 | 14d | 1 | 1.16mi |
HOA detail
- Monthly dues
- $115 · $1,380/yr
- Likely covers
- waterpool
Listing history 2 events
-
2026-06-17remarks 699-char remark
-
2026-06-17$158,995 Active 1 DOM
ⓘ Source: listings_history table (triggers on properties + properties_extension) + one-shot
backfill from property_details.listing_events for pre-trigger history.
Tax reassessment forecast FL · Resets to sale price
- Current annual tax
- $757 · $63/mo
- Projected year-2 tax
- $1,320 · $110/mo
- Expected delta
- +$563/yr (+$47/mo · 74.4%)
ⓘ Screening estimate from a state-policy table — verify with the county assessor before closing.
Climate risk First Street
- Flood 4/10 Moderate FEMA zone X (unshaded) · 22% chance over 30 yrs
- Wildfire 4/10 Moderate
- Heat 10/10 Extreme 7 d/yr ≥106°F today · 23 d/yr by 30 yrs out
- Wind 10/10 Extreme 99% chance of damaging wind over 30 yrs
- Air quality 1/10 Low 0 unhealthy d/yr today · 0 by 30 yrs out
Nearby sold comps map
Loading sold comps map…
Walkable amenities ~0.75 mi
Loading nearby amenities…
Taxation est. · year 1
- Rental income
- $21,402
- − Mortgage interest
- −$8,906
- − Property taxes
- −$757
- − Insurance
- −$795
- − Repairs & maintenance
- −$1,712
- − Management
- −$1,712
- − HOA
- −$1,380
- − Depreciation
- −$4,625
- Taxable income
- $1,515
- Est. tax owed @ 24.0%
- −$364
- After-tax cash flow
- $3,607/yr
For passive investors: Depreciation is non-cash, so a rental often shows a tax loss while cash-flowing — sheltering income. Rental losses are passive: they offset passive income freely, and up to $25,000/yr can offset ordinary (W-2) income if you actively participate and your MAGI is under $100k (phasing out to $0 by $150k); unused losses carry forward. On sale, claimed depreciation is recaptured at up to 25%, and gains may owe capital-gains tax (a 1031 exchange can defer both). Figures are a year-1 estimate at your 24.0% rate — not tax advice; consult a CPA.
Schools (NCES district)
- District
- Brevard
- NCES district ID
- 1200150
- Math proficiency
- 53% ▼ -9.00%
- Reading proficiency
- 57% ▼ -4.00%
- Median HH income
- $49,426
- Composite
- 46.86/100
- National rank
- #2370
- State rank
- #19 of 73 in FL
Livability — Melbourne
No livability data for this city. (Only ~50 U.S. cities are tracked.)
Census & demographics
- County
- Brevard County · 602,871 people
- City population
- 178,420
- Metro
- Palm Bay-Melbourne-Titusville, FL
- Population (ZIP)
- 18,564
- Household income
- $104,369
- Rent vs Own
- Severe rent burden
- 233.0
Population outlook (Brevard County) Hauer SSP2
- Today (2025)
- 623,254 people
- By 2030
- 648,420 · +4.0%
- By 2040
- 690,009 · +10.7%
- By 2050
- 715,669 · +14.8%
- By 2075
- 775,744 · +24.5%
- By 2100
- 776,687 · +24.6%
Race, ethnicity, and origin ACS 2023
- Neighborhood character
- Predominantly White (82%)
- Race & ethnicity
- White 82% Hispanic / Latino 8% Two or more races 7% Black 2% Asian 2%
- Hispanic origin (detail)
- Puerto Rican 3% Cuban 1%
- Common ancestry
- Lithuanian 4% Italian 3% Romanian 3%
- Foreign-born
- 8% · Canada, China
- Languages at home
- 91% English-only · Spanish 6% Other Indo-European 1% German/W. Germanic 1%
Political lean MEDSL · Brevard
- 2024 margin
- Strong R (+20.8) · D 39.1% · R 59.9% · Other 1.0%
- 2008→2024 swing
- -10.4pp toward R · 2008: -10.4pp · 2024: -20.8pp
- All cycles
- 2024: R+20.8 2020: R+16.4 2016: R+19.8 2012: R+12.7 2008: R+10.4
Not yet ingested
- Civics
- —
Market trends
- HPI YoY
- ▼ -78.68%
- Current HPI
- 315.3069
- Rent YoY
- ▲ 3.72%
- Metro
- Palm Bay-Melbourne-Titusville, FL
- State GDP YoY
- ▲ 3.28%
- F500 in state
- 36
Industry mix (Fortune 500 HQ in FL)
| Industry | F500 HQs | Revenue |
|---|---|---|
| Industrial Technology | 2 | $29B |
|
||
| Insurance | 2 | $17B |
|
||
| Retail | 1 | $60B |
|
||
| Technology Distribution | 1 | $58B |
|
||
| Homebuilding | 1 | $35B |
|
||
| Technology Manufacturing | 1 | $35B |
|
||
Price history
+174.1% since first listed20 events — show timeline
- 2026-06-17 Listed $158,995 SCMLS
- 2016-08-16 Listing Removed — SCMLS
- 2016-08-16 Listing Removed — SCMLS
- 2016-08-16 Listing Removed — SCMLS
- 2016-08-16 Listing Removed — SCMLS
- 2016-08-16 Listing Removed — SCMLS
- 2016-08-16 Listing Removed — SCMLS
- 2012-08-24 Sold (Public Records) $66,900 Public Records
- 2012-08-08 Sold (MLS) $66,900 SCMLS
- 2011-11-02 Listed $66,900 SCMLS
- 2009-09-28 Listed $59,900 SCMLS
- 2009-02-27 Listed $74,900 SCMLS
- 2008-09-22 Listed $75,000 SCMLS
- 2008-07-23 Listed $79,900 SCMLS
- 2006-09-18 Listed $99,900 SCMLS
- 2005-05-03 Listed $119,900 SCMLS
- 2003-05-13 Sold (Public Records) $66,000 Public Records
- 2003-05-13 Sold (Public Records) $65,500 Public Records
- 1998-11-09 Sold (Public Records) $62,000 Public Records
- 1994-10-27 Sold (Public Records) $58,000 Public Records
Property tax history
+1.8%/yrLatest (2025): $757 · +6.6% YoY. Source: county tax records.
Cash-flow waterfall
monthlySold comps — $/sqft
last 12 mo · ≤1 miLoading sold comps…