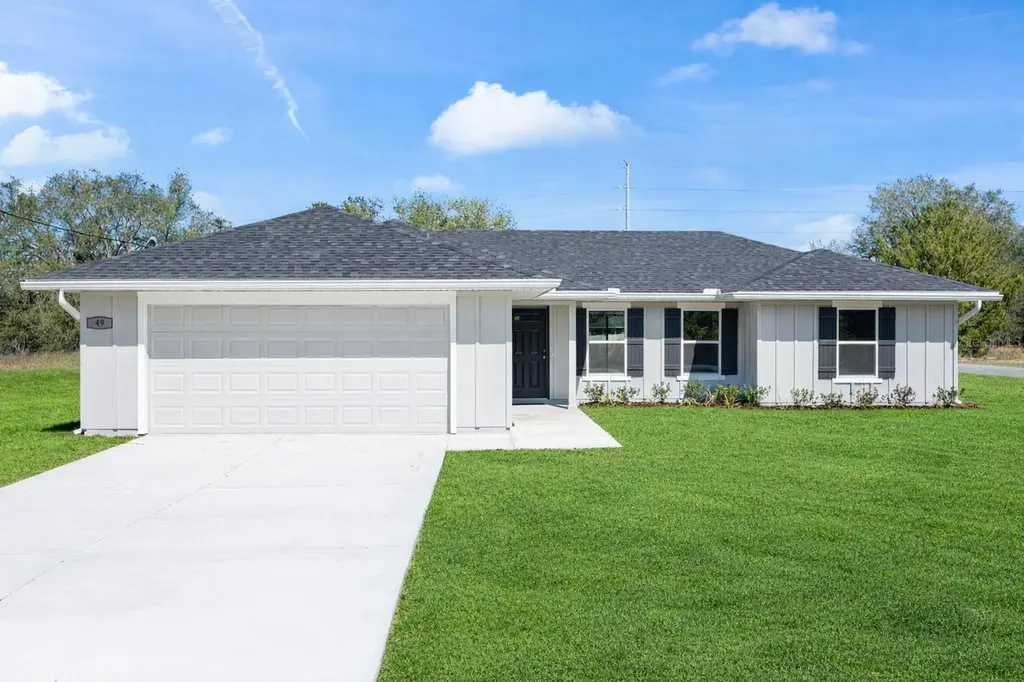
49 Locust Loop Cir · Silver Springs Shores, FL
Flood risk 1/10 · Minimal
- FEMA flood zone
- X (unshaded)
- Chance of flooding over 30 yrs
- 0.0%
- Est. flood insurance / yr
- $507 – $1,088
Fire risk 6/10 · Moderate
- Est. fire insurance / yr
- $947 – $1,759
Heat risk 8/10 · Major
- Hot days now (above 108°F)
- 7 days/yr
- Hot days in 30 yrs
- 22 days/yr
Wind risk 9/10 · Severe
- Chance of severe wind over 30 yrs
- 99.0%
Air-quality risk 3/10 · Minor
- Unhealthy air days now
- 3 days/yr
- Unhealthy air days in 30 yrs
- 4 days/yr
Risk factors via First Street. Map © Google.
Why this score? — see what drove the F grade
The composite is a weighted blend of 9 inputs, each scored 0–100. Each bar is that input's sub-score; the figure is the points it added to the 100-point composite (weight × sub-score).
- Appreciation +8.0/10.0
- Cash flow +6.2/30.0
- Schools +3.6/10.0
- Livability +3.4/5.0
- Rent growth +2.5/5.0
- Condition / age +2.5/5.0
- 1% rule +1.4/10.0
- ARV discount +1.2/15.0
- DSCR +0.5/10.0
$277,000
🖨 Deal sheet 📄 Offer letter ✓ Due diligence
Listing remarks MLS
This split plan is open, light & bright. As you walk through the front door of the home, you feel the openness with cathedral ceilings in the living room, dining room, and foyer. The kitchen features stylish cabinetry and quartz countertops and come complete with new range, microwave, and dishwasher. The charming nook is the perfect spot to enjoy your morning coffee. Tile floors throughout the house help with easy maintenance. There is fully tiled walk-in shower and dual sinks in the en-suite bath. Do laundry with ease in the air-conditioned laundry room. This home rests on just over a 1/4 acre lot ~ enough room for the family & pets to play, but not too much yard work. Silver Springs Shores offers easy access to restaurants, shops, healthcare facilities, art galleries and local events, plus outdoor recreation opportunities like parks, lakes, biking, swimming, hiking, kayaking and much more. The Builder is including a 1 year full warranty and a 2-10 home warranty! Any dimensions listed are approximate. Photos/Virtual Tour are to show interior and exterior colors and finishes and may or may not be of this actual listing. Garage orientation and floor plan may vary for actual home. BUILDER WILL PAY UP TO $5000.00 TOWARDS BUYERS CLOSING COSTS WITH FULL PRICE OFFER!
Key facts
- Stylish cabinetry
- Dual sinks
- Quartz countertops
Tags
Neighborhood map
What this means for you Summary
Snapshot
- This is a 3-bed/2.0-bath land listed at $277k.
Deal economics
- At list price, monthly cash flow is $-504 ($-6k/yr) — negative.
- To cash-flow at today's rent, offer at most $204k (26.3% below list).
- To meet the 1% rule (rent ≥ 1% of price), the offer needs to be $179k (35.6% below list).
- Recommended offer: $179k (35.6% below list) — sets the bar for 1% rule.
Location & tenants
- Location reads 68/100 on livability (#527 in FL) — a middle-class / working-renter tenant base. Strengths: cost of living A+, housing A+, health & safety A-; Watch: crime C-, employment D, schools F.
- Marion (rural): math 42% / reading 43% proficiency, ranked #61 of 73 in FL (top 84%) — families likely to look elsewhere, expect single-tenant / working-renter base with shorter leases; 61% free/reduced lunch — lower-income household profile, screen leases tightly.
- Market conditions: Rents flat; 674 active listings in the ZIP; 9 comparable units currently listed for rent nearby; rentals leasing fast (median 14d on market — plan ~1-2 weeks tenant-placement turnaround); 7,071 units permitted in Marion County in 2024 (534 in 5+ unit buildings).
- This rent runs 33% of the median local income ($64k/yr) — at the standard rent-burdened threshold; future hikes will face affordability resistance.
Forward outlook
- In year one you build about $18k of equity ($2k loan paydown + $16k appreciation (5.9% local appreciation)).
- Marion County population projected at +13% by 2050 — modest demand growth; plan on rents tracking national, not racing it.
- By year 3, paydown + projected appreciation supports a ~$45k cash-out refi (75% LTV) — recoverable capital for the next deal without selling this one.
Negotiation context
- It's been on market 108 days — a 9% lower offer ($252k) is reasonable based on typical stale-listing flexibility.
- Current owner paid $12k; list at $277k implies a 2309% gain — meaningful room to come down on a strong offer.
Risks & watch-outs
- Climate carrying-cost: severe wind risk, 99% chance of damaging wind over 30y; major wildfire risk; extreme-heat days projected 7→22/yr by 2055 (HVAC capex compounding) — expect insurance premiums to compound above CPI over the hold.
Questions for the listing agent
- What do current leases actually rent for vs. the listed asking? Can we see a recent rent roll and the last 12 months of T-12 income?
- It's been on market 108 days. Have you received any prior offers? Is the seller open to a 36% concession, seller financing, or rate buy-down credit?
- Why hasn't it sold? Are there any deal-killer items the seller is aware of (foundation, flood, title, zoning, code violations)?
- Is there a deadline driving the sale (1031 exchange, divorce, estate, relocation)? That informs how much negotiation room exists.
- Schools are F-rated, which usually means shorter tenancies and higher turnover. Who's the typical renter profile here, and what's been the actual vacancy rate?
- The area grade is low — what's the realistic commute time and amenity access for the typical tenant pool here? Any planned neighborhood developments (good or bad) we should know about?
- What's the average days-on-market for RENTAL listings here right now (not sales)? A rising rental-DOM trend means longer vacancies and softer asking-rent achievability than the comps imply.
- What's the recent tenant-quality profile in this submarket — average credit score on applications, eviction rate, late-payment / NSF rate, and stable-employment percentage? A property-management company in the area should have these aggregated.
- How much new for-sale + rental construction is in the pipeline within 1–3 miles? Heavy new supply typically softens prices + rents 12–24 months out; constrained supply supports both.
Investment metrics
- 1% rule
- 0.64% ✗
- Cap rate
- 4.11%
- Cash-on-cash
- -7.80%
- DSCR
- 0.65
- GRM
- 12.9
CMA / ARV
- ARV (median comp)
- $243,164
- List price
- $277,000
- Delta
- 13.91%
- Verdict
- OVERPRICED
- Comps
- 20 within 1.0 mi
Projected returns pro-forma
5.93% appreciation · 0.17% rent growth · sell at horizon
- IRR
- 8.0%
- Equity multiple
- 1.54×
- Total profit
- $41,855
- Equity at exit
- $172,954
- IRR
- 9.0%
- Equity multiple
- 2.80×
- Total profit
- $139,656
- Equity at exit
- $312,631
Cash invested: $77,560 (down + closing). Projections, not guarantees.
Landlord ↔ Tenant lean methodology
- Overall (STATE)
- 87 Strongly Landlord-Friendly
- State Florida
- 87 Strongly Landlord-Friendly · R+3
- County
- — inherits STATE
- City
- — inherits STATE
ZIP-level market 34472
- Home prices YoY
- 2.4%
- Rents YoY
- 0.2%
- Active inventory
- 674
- Price-to-rent
- 12.9×
Monthly cashflow live
- Estimated rent
- $1,785 high interval (Pro) →
- Mortgage (P&I)
- −$1,453
- Tax est. 1.5%
- −$346 /mo · $4,155/yr
- Insurance
- −$115
- HOA
- −$0
- Vacancy / Maint / Mgmt
- −$375
- Net cashflow
- $-504
Break-even live
UW: 25.0% down · 7.5% · 30yr · 1.5% tax · 5.0% vac · 8.0% maint · 8.0% mgmt
Financing live
Cash to close
- Down payment
- $69,250
- Closing costs
- $8,310
- Reserves months
- —
- Total cash needed
- —
Loan-product check · same deal, 3 products live
Conventional
25% down · 7.5% · 30yr
- Down + closing
- —
- Monthly P&I
- —
- Monthly cashflow
- —
- DSCR
- —
- Eligible?
- —
Personal DTI + credit; lowest rate.
DSCR
20% down · 8.5% · 30yr
- Down + closing
- —
- Monthly P&I
- —
- Monthly cashflow
- —
- DSCR
- —
- Eligible?
- —
No personal income docs; deal must DSCR.
Hard money
10% down · 12.0% · 12mo
- Down + closing
- —
- Monthly P&I
- —
- Monthly cashflow
- —
- DSCR
- —
- Eligible?
- —
Short-term bridge; refi at stabilization.
Rent comps 9 comps
| Address | Beds | Baths | Sqft | Rent | $/sqft | DOM | Units | Dist |
|---|---|---|---|---|---|---|---|---|
| 342 Locust Pass Ocala, FL | 3.0 | 2.0 | 1232 | $1,650 | $1.34 | 13d | 1 | 0.26mi |
| 219 Locust Ln Ocala, FL | 3.0 | 2.0 | 1232 | $1,650 | $1.34 | 13d | 1 | 0.60mi |
| 6 Locust Course Ln Ocala, FL | 3.0 | 2.0 | 1263 | $1,735 | $1.37 | 13d | 1 | 0.61mi |
| 80 Locust Pass Run Ocala, FL | 3.0 | 2.0 | 1003 | $1,595 | $1.59 | 13d | 1 | 0.70mi |
| 217 Locust Pass Crse Ocala, FL | 3.0 | 2.0 | 1232 | $1,650 | $1.34 | 13d | 1 | 0.95mi |
| 202 Oak Lane Cir Ocala, FL | 3.0 | 2.0 | 1232 | $1,650 | $1.34 | 13d | 1 | 0.96mi |
| 217 Locust Pass Ln Ocala, FL | 3.0 | 2.0 | 1011 | $1,697 | $1.68 | 13d | 1 | 0.97mi |
| 325 Oak Track Ct Ocala, FL | 3.0 | 2.0 | 1163 | $1,550 | $1.33 | 21d | 1 | 1.36mi |
| 310 Oak Lane Pass Ocala, FL | 2.0 | 2.0 | 988 | $1,325 | $1.34 | 21d | 1 | 1.46mi |
Listing history 17 events
-
2026-06-18days on market $277,000 Active 108 DOM
-
2026-06-17days on market $277,000 Active 107 DOM
-
2026-06-16days on market $277,000 Active 106 DOM
-
2026-06-15days on market $277,000 Active 105 DOM
-
2026-06-14days on market $277,000 Active 103 DOM
-
2026-06-13days on market $277,000 Active 102 DOM
-
2026-06-10days on market $277,000 Active 100 DOM
-
2026-06-09days on market $277,000 Active 99 DOM
-
2026-06-08days on market $277,000 Active 98 DOM
-
2026-06-07days on market $277,000 Active 97 DOM
-
2026-06-03days on market $277,000 Active 93 DOM
-
2026-06-02days on market $277,000 Active 92 DOM
-
2026-06-01days on market $277,000 Active 91 DOM
-
2026-05-31days on market $277,000 Active 90 DOM
-
2026-05-30days on market $277,000 Active 89 DOM
-
2026-03-02$277,000 Active 1295-char remark
Show marketing remark (1295 chars)
This split plan is open, light & bright. As you walk through the front door of the home, you feel the openness with cathedral ceilings in the living room, dining room, and foyer. The kitchen features stylish cabinetry and quartz countertops and come complete with new range, microwave, and dishwasher. The charming nook is the perfect spot to enjoy your morning coffee. Tile floors throughout the house help with easy maintenance. There is fully tiled walk-in shower and dual sinks in the en-suite bath. Do laundry with ease in the air-conditioned laundry room. This home rests on just over a 1/4 acre lot ~ enough room for the family & pets to play, but not too much yard work. Silver Springs Shores offers easy access to restaurants, shops, healthcare facilities, art galleries and local events, plus outdoor recreation opportunities like parks, lakes, biking, swimming, hiking, kayaking and much more. The Builder is including a 1 year full warranty and a 2-10 home warranty! Any dimensions listed are approximate. Photos/Virtual Tour are to show interior and exterior colors and finishes and may or may not be of this actual listing. Garage orientation and floor plan may vary for actual home. BUILDER WILL PAY UP TO $5000.00 TOWARDS BUYERS CLOSING COSTS WITH FULL PRICE OFFER!
-
2021-02-25soldstatus $11,500
ⓘ Source: listings_history table (triggers on properties + properties_extension) + one-shot
backfill from property_details.listing_events for pre-trigger history.
Climate risk First Street
- Flood 1/10 Low FEMA zone X (unshaded) · 0% chance over 30 yrs
- Wildfire 6/10 Major
- Heat 8/10 Severe 7 d/yr ≥108°F today · 22 d/yr by 30 yrs out
- Wind 9/10 Extreme 99% chance of damaging wind over 30 yrs
- Air quality 3/10 Moderate 3 unhealthy d/yr today · 4 by 30 yrs out
Nearby sold comps map
Loading sold comps map…
Walkable amenities ~0.75 mi
Loading nearby amenities…
Taxation est. · year 1
- Rental income
- $21,423
- − Mortgage interest
- −$15,516
- − Property taxes
- −$4,155
- − Insurance
- −$1,385
- − Repairs & maintenance
- −$1,714
- − Management
- −$1,714
- − Depreciation
- −$8,058
- Taxable loss
- −$11,119
- Est. tax savings @ 24.0%
- +$2,669
- After-tax cash flow
- $-3,379/yr
For passive investors: Depreciation is non-cash, so a rental often shows a tax loss while cash-flowing — sheltering income. Rental losses are passive: they offset passive income freely, and up to $25,000/yr can offset ordinary (W-2) income if you actively participate and your MAGI is under $100k (phasing out to $0 by $150k); unused losses carry forward. On sale, claimed depreciation is recaptured at up to 25%, and gains may owe capital-gains tax (a 1031 exchange can defer both). Figures are a year-1 estimate at your 24.0% rate — not tax advice; consult a CPA.
Schools (NCES district)
- District
- Marion
- NCES district ID
- 1201260
- Math proficiency
- 42% ▼ -7.00%
- Reading proficiency
- 43% ▼ -4.00%
- Median HH income
- $40,015
- Composite
- 35.61/100
- National rank
- #4890
- State rank
- #61 of 73 in FL
Livability — Silver Springs Shores
- Score
- 68/100
- State rank
- #527
- US rank
- #9854
Category grades
Schools grade is shown separately in the Schools card above.
Census & demographics
- Census place
- Silver Springs Shores, FL
- County
- Marion County · 315,796 people
- City population
- 34,665
- Metro
- Ocala, FL
- Population (ZIP)
- 35,851
- Household income
- $64,208
- Rent vs Own
- Severe rent burden
- 655.0
Population outlook (Marion County) Hauer SSP2
- Today (2025)
- 365,905 people
- By 2030
- 376,768 · +3.0%
- By 2040
- 396,555 · +8.4%
- By 2050
- 412,723 · +12.8%
- By 2075
- 446,090 · +21.9%
- By 2100
- 436,193 · +19.2%
Race, ethnicity, and origin ACS 2023
- Neighborhood character
- Diverse neighborhood (Simpson 0.65)
- Race & ethnicity
- White 50% Hispanic / Latino 25% Black 21% Two or more races 18% Asian 2%
- Hispanic origin (detail)
- Mexican 2% Puerto Rican 14% Cuban 3%
- Common ancestry
- Romanian 2% Iranian 1% Lithuanian 1%
- Foreign-born
- 11% · Canada, Jamaica, China
- Languages at home
- 78% English-only · Spanish 19% Other Indo-European 1%
Political lean MEDSL · Marion
- 2024 margin
- Solid R (+31.6) · D 33.8% · R 65.5%
- 2008→2024 swing
- -20.0pp toward R · 2008: -11.6pp · 2024: -31.6pp
- All cycles
- 2024: R+31.6 2020: R+25.9 2016: R+26.2 2012: R+16.2 2008: R+11.6
Not yet ingested
- Civics
- —
Market trends
- HPI YoY
- ▲ 5.93%
- Current HPI
- 255.0714
- Rent YoY
- ▲ 0.17%
- Metro
- Ocala, FL
- State GDP YoY
- ▲ 3.28%
- F500 in state
- 36
Industry mix (Fortune 500 HQ in FL)
| Industry | F500 HQs | Revenue |
|---|---|---|
| Industrial Technology | 2 | $29B |
|
||
| Insurance | 2 | $17B |
|
||
| Retail | 1 | $60B |
|
||
| Technology Distribution | 1 | $58B |
|
||
| Homebuilding | 1 | $35B |
|
||
| Technology Manufacturing | 1 | $35B |
|
||
Price history
+2308.7% since first listed2 events — show timeline
- 2026-03-02 Listed $277,000 Stellar MLS as Distributed by MLS Grid
- 2021-02-25 Sold (Public Records) $11,500 Public Records
Property tax history
+11.2%/yrLatest (2025): $361 · +11.8% YoY. Source: county tax records.
Cash-flow waterfall
monthlySold comps — $/sqft
last 12 mo · ≤1 miLoading sold comps…