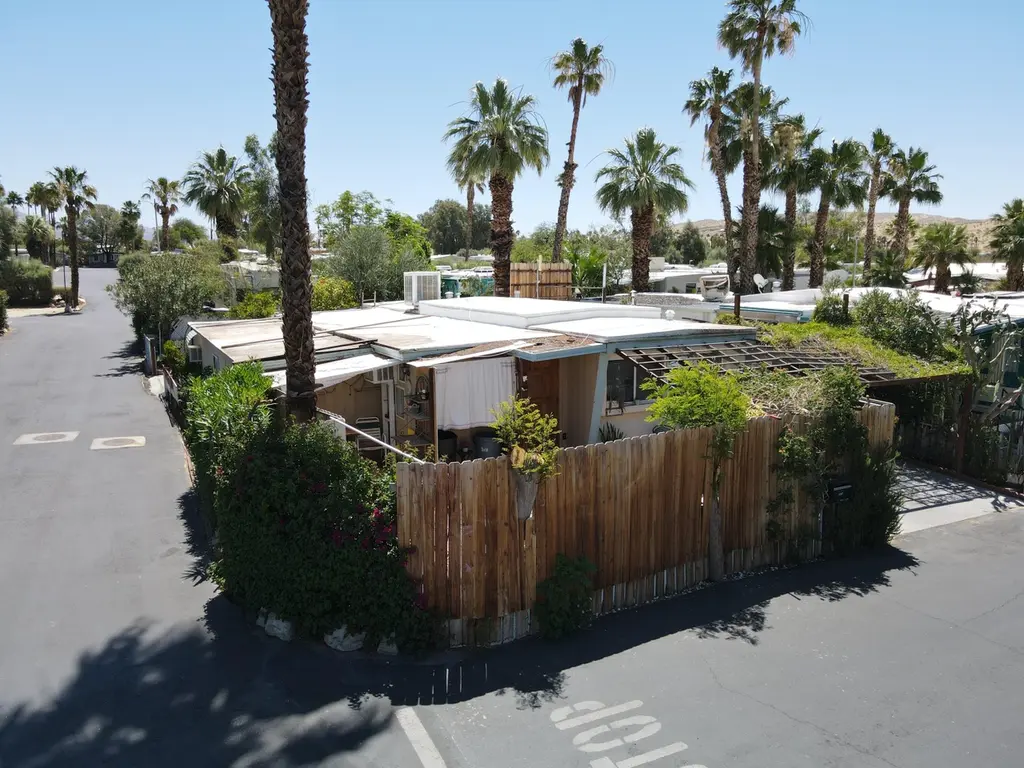
18131 Langlois Rd Unit F 18 · Desert Edge, CA
Flood risk 1/10 · Minimal
- FEMA flood zone
- X (unshaded)
- Chance of flooding over 30 yrs
- 0.0%
- Est. flood insurance / yr
- $507 – $1,088
Fire risk 5/10 · Moderate
- Est. fire insurance / yr
- $659 – $1,223
Heat risk 8/10 · Major
- Hot days now (above 109°F)
- 2 days/yr
- Hot days in 30 yrs
- 5 days/yr
Wind risk 1/10 · Minimal
- Chance of severe wind over 30 yrs
- —
Air-quality risk 5/10 · Moderate
- Unhealthy air days now
- 6 days/yr
- Unhealthy air days in 30 yrs
- 8 days/yr
Risk factors via First Street. Map © Google.
Why this score? — see what drove the B grade
The composite is a weighted blend of 9 inputs, each scored 0–100. Each bar is that input's sub-score; the figure is the points it added to the 100-point composite (weight × sub-score).
- Cash flow +27.0/30.0
- ARV discount +15.0/15.0
- 1% rule +10.0/10.0
- DSCR +9.3/10.0
- Livability +3.4/5.0
- Schools +2.7/10.0
- Rent growth +2.5/5.0
- Condition / age +2.2/5.0
- Appreciation +0.0/10.0
$79,000
🖨 Deal sheet 📄 Offer letter ✓ Due diligence
Listing remarks
Healing Waters MHP Desert Hot Springs sits above one of the most remarkable natural resources in Southern California -- a vast underground aquifer of geothermal mineral water that has drawn people seeking rest, renewal, and relief for generations. This is that lifestyle, priced within reach. Located in the 55+ community of Healing Waters Mobile Home & RV Park, this corner-lot 3-bedroom, 2-bath home arrives fully furnished and ready for your vision. The open living area flows naturally through generous bedroom sizes and a functional layout that lives larger than you'd expect. The space is here -- it just needs someone ready to bring it fully to life. The standout feature is the attache
Key facts
- Attached guest suite
- Wet and dry saunas
- Private entrance
Tags
Property features AI
Finance
- Other: Lease land (land lease); Included in sale: furniture; Sale type: Standard; Cash offers only; Possession: close plus 2 days; Senior community (not gated)
- HOA & community: Monthly association with clubhouse, tennis courts, barbecue, recreation room, and management; Total monthly association fee $695
Exterior
- Parking: Driveway; 3 total parking spaces; 3 carport spaces
- Security: No security features
- Utilities: Sewer connected and paid; PUD: Yes
- Home design: Detached property; Single-story (ground level); Triple-wide mobile home; Senior park setting
- Construction: Manufactured home (Flamingo make/model); Manufacture date 01-01-1961; 40 ft length, 12 ft width; Aluminum and vinyl skirting
- Exterior features: Corner lot; Street lights; Community in-ground pool; Community in-ground spa; Community recreation amenities
Interior
- Flooring: Other flooring
- Bathrooms: 2 full bathrooms
- Heating & cooling: Central heating; Central air conditioning
- Interior features: Ground-level entry with steps; Furnished; Dining room; Family room; No fireplace
Neighborhood map
What this means for you Summary
Snapshot
- This is a 3-bed/2.0-bath manufactured listed at $79k. Condition is rated fair.
Deal economics
- At list price, monthly cash flow is $221 ($3k/yr) — positive.
- The deal already cash-flows at list — no discount required.
- Meets the 1% rule at list price ($2k rent vs $79k).
- Recommended offer: $78k (1.5% below list) — sets the bar for market timing.
- Cap rate 9.6% vs local median 14.8% in Desert Edge — below-typical yield; the buyer is paying a premium for something (appreciation thesis, condition, location) that the cap rate doesn't capture.
Location & tenants
- Location reads 68/100 on livability (#297 in CA) — a middle-class / working-renter tenant base. Strengths: cost of living A+, housing A+; Watch: crime C-, schools F, commute D-.
- Palm Springs Unified (suburban): math 21% / reading 42% proficiency, ranked #328 of 517 in CA (top 63%) — families likely to look elsewhere, expect single-tenant / working-renter base with shorter leases; 73% free/reduced lunch — lower-income household profile, screen leases tightly.
- Market conditions: 216 active listings in the ZIP; 1 comparable units currently listed for rent nearby; 9,195 units permitted in Riverside County in 2024 (1,512 in 5+ unit buildings).
Forward outlook
- Local home prices are declining (-3.0%/yr); year-one equity from $546 of loan paydown is wiped out by about $2k of value loss. Plan a longer hold.
- Riverside County population projected at +22% by 2050 — long-run rental-demand tailwind backs the buy-and-hold thesis.
- At projected returns (-3.0% appreciation + 3.0% rent growth), your $22k cash investment doubles in ~9 years — after that, you're playing with house money.
Negotiation context
- It's been on market 21 days — a 2% lower offer ($78k) is reasonable based on typical stale-listing flexibility.
- 2 sale attempts with the ask held roughly flat each time — persistent listings suggest the price (not the market) is what's stuck; bring a comps-based counter.
Risks & watch-outs
- Watch-outs: HOA is 38% of rent.
- Climate carrying-cost: moderate wildfire risk; extreme-heat days projected 2→5/yr by 2055 (HVAC capex compounding) — expect insurance premiums to compound above CPI over the hold.
Questions for the listing agent
- Have any recent inspections been done? Can we get a copy of the seller's disclosures and any deferred-maintenance estimates?
- Built in 1961 — when were the roof, HVAC, electrical panel, plumbing, and water heater last replaced?
- What does the HOA fee cover, when was the last increase, and are there any pending special assessments or reserve-fund shortfalls?
- Is there a deadline driving the sale (1031 exchange, divorce, estate, relocation)? That informs how much negotiation room exists.
- Schools are F-rated, which usually means shorter tenancies and higher turnover. Who's the typical renter profile here, and what's been the actual vacancy rate?
- What's the average days-on-market for RENTAL listings here right now (not sales)? A rising rental-DOM trend means longer vacancies and softer asking-rent achievability than the comps imply.
- What's the recent tenant-quality profile in this submarket — average credit score on applications, eviction rate, late-payment / NSF rate, and stable-employment percentage? A property-management company in the area should have these aggregated.
- How much new for-sale + rental construction is in the pipeline within 1–3 miles? Heavy new supply typically softens prices + rents 12–24 months out; constrained supply supports both.
Investment metrics
- 1% rule
- 2.34% ✓
- Cap rate
- 9.64%
- Cash-on-cash
- 11.96%
- DSCR
- 1.53
- GRM
- 3.6
CMA / ARV
- ARV (on-the-fly)
- $113,900
- Comps found
- 10
Show comp detail 10 sales within ~0.75 mi
| Address | Dist | Beds/Ba | Sqft | Sold | Price | $/sf | Match |
|---|---|---|---|---|---|---|---|
| 18070 Langlois Rd #220 | 0.15mi | 2/2.0 (-1) | 1,620 (-3%) | 1mo | $162,500 | $100 | 82 |
| 70640 Longyear Rd | 0.43mi | 3/2.0 | 1,710 (+2%) | 3mo | $350,000 | $205 | 74 |
| 18555 Roberts Rd #103 | 0.24mi | 2/2.0 (-1) | 1,836 (+10%) | 1mo | $125,000 | $68 | 67 |
| 17555 Corkill Rd #5 | 0.62mi | 3/2.0 | 1,680 (+0%) | 8mo | $169,000 | $101 | 64 |
| 18555 Roberts Rd #95 | 0.25mi | 2/2.0 (-1) | 1,500 (-10%) | 8mo | $80,000 | $53 | 59 |
| 17800 Langlois Rd #218 | 0.31mi | 2/2.0 (-1) | 1,440 (-14%) | 2mo | $50,000 | $35 | 56 |
| 18555 Roberts Rd #102 | 0.25mi | 2/2.0 (-1) | 1,440 (-14%) | 19mo | $100,000 | $69 | 44 |
| 70875 Dillon Rd #31 | 0.75mi | 4/2.0 (+1) | 1,475 (-12%) | 1mo | $50,000 | $34 | 40 |
| 17625 Langlois Rd #112 | 0.42mi | 2/2.0 (-1) | 1,440 (-14%) | 17mo | $57,500 | $40 | 38 |
| 17640 Corkill Rd #78 | 0.52mi | 2/2.0 (-1) | 1,440 (-14%) | 22mo | $40,000 | $28 | 29 |
Match score weights: distance 35% · size 25% · config 20% · recency 20%. Top-matched comps best support the ARV.
Projected returns pro-forma
-3.0% appreciation · 3.0% rent growth · sell at horizon
- IRR
- 2.0%
- Equity multiple
- 1.08×
- Total profit
- $1,701
- Equity at exit
- $11,779
- IRR
- 12.0%
- Equity multiple
- 1.97×
- Total profit
- $21,417
- Equity at exit
- $6,830
Cash invested: $22,120 (down + closing). Projections, not guarantees.
Landlord ↔ Tenant lean methodology
- Overall (STATE)
- 18 Strongly Tenant-Friendly
- State California
- 18 Strongly Tenant-Friendly · D+13
- County
- — inherits STATE
- City
- — inherits STATE
ZIP-level market 92241
- Home prices YoY
- -22.8%
- Active inventory
- 216
- Price-to-rent
- 3.6×
Monthly cashflow live
- Estimated rent
- $1,850 medium interval (Pro) →
- Mortgage (P&I)
- −$414
- Tax est. 1.5%
- −$99 /mo · $1,185/yr
- Insurance
- −$33
- HOA
- −$695
- Vacancy / Maint / Mgmt
- −$388
- Net cashflow
- $221
Break-even live
UW: 25.0% down · 7.5% · 30yr · 1.5% tax · 5.0% vac · 8.0% maint · 8.0% mgmt
Financing live
Cash to close
- Down payment
- $19,750
- Closing costs
- $2,370
- Reserves months
- —
- Total cash needed
- —
Loan-product check · same deal, 3 products live
Conventional
25% down · 7.5% · 30yr
- Down + closing
- —
- Monthly P&I
- —
- Monthly cashflow
- —
- DSCR
- —
- Eligible?
- —
Personal DTI + credit; lowest rate.
DSCR
20% down · 8.5% · 30yr
- Down + closing
- —
- Monthly P&I
- —
- Monthly cashflow
- —
- DSCR
- —
- Eligible?
- —
No personal income docs; deal must DSCR.
Hard money
10% down · 12.0% · 12mo
- Down + closing
- —
- Monthly P&I
- —
- Monthly cashflow
- —
- DSCR
- —
- Eligible?
- —
Short-term bridge; refi at stabilization.
Rent comps 1 comps
| Address | Beds | Baths | Sqft | Rent | $/sqft | DOM | Units | Dist |
|---|---|---|---|---|---|---|---|---|
| 18070 Langlois Rd #257 Desert Hot Springs, CA | 2.0 | 2.0 | 1056 | $1,850 | $1.75 | 43d | 1 | 0.13mi |
HOA detail
- Monthly dues
- $695 · $8,340/yr
- Likely covers
- water
Listing history 19 events
-
2026-06-18days on market $79,000 Active 21 DOM
-
2026-06-17days on market $79,000 Active 20 DOM
-
2026-06-16days on market $79,000 Active 19 DOM
-
2026-06-15days on market $79,000 Active 18 DOM
-
2026-06-13days on market $79,000 Active 16 DOM
-
2026-06-13days on market $79,000 Active 15 DOM
-
2026-06-09days on market $79,000 Active 12 DOM
-
2026-06-08days on market $79,000 Active 11 DOM
-
2026-06-07days on market $79,000 Active 10 DOM
-
2026-06-04days on market $79,000 Active 7 DOM
-
2026-06-03days on market $79,000 Active 6 DOM
-
2026-06-02days on market $79,000 Active 5 DOM
-
2026-06-01days on market $79,000 Active 4 DOM
-
2026-05-31days on market $79,000 Active 3 DOM
-
2026-05-28$79,000 Active
-
2026-05-01historical
-
2026-04-03price $109,099
-
2026-03-19price $130,000
-
2025-12-03$148,000 Active
ⓘ Source: listings_history table (triggers on properties + properties_extension) + one-shot
backfill from property_details.listing_events for pre-trigger history.
Climate risk First Street
- Flood 1/10 Low FEMA zone X (unshaded) · 0% chance over 30 yrs
- Wildfire 5/10 Major
- Heat 8/10 Severe 2 d/yr ≥109°F today · 5 d/yr by 30 yrs out
- Wind 1/10 Low
- Air quality 5/10 Major 6 unhealthy d/yr today · 8 by 30 yrs out
Nearby sold comps map
Loading sold comps map…
Walkable amenities ~0.75 mi
Loading nearby amenities…
Taxation est. · year 1
- Rental income
- $22,200
- − Mortgage interest
- −$4,425
- − Property taxes
- −$1,185
- − Insurance
- −$395
- − Repairs & maintenance
- −$1,776
- − Management
- −$1,776
- − HOA
- −$8,340
- − Depreciation
- −$2,298
- Taxable income
- $2,005
- Est. tax owed @ 24.0%
- −$481
- After-tax cash flow
- $2,165/yr
For passive investors: Depreciation is non-cash, so a rental often shows a tax loss while cash-flowing — sheltering income. Rental losses are passive: they offset passive income freely, and up to $25,000/yr can offset ordinary (W-2) income if you actively participate and your MAGI is under $100k (phasing out to $0 by $150k); unused losses carry forward. On sale, claimed depreciation is recaptured at up to 25%, and gains may owe capital-gains tax (a 1031 exchange can defer both). Figures are a year-1 estimate at your 24.0% rate — not tax advice; consult a CPA.
Condition & rehab AI · 12 photos
This mobile home requires moderate repairs and updates to its kitchen and bathrooms, as well as fresh paint and flooring. It has a fair condition score and could benefit from a fresh coat of paint and updated cabinets to improve its resale and rental value.
Repairs flagged
- Moderate kitchen cabinets — yellow and white cabinets need updating
- Moderate bathroom cabinets — yellow cabinets need updating
- Unknown HVAC/mechanicals — no visible HVAC/mechanicals
Value-add opportunities
- Resale paint interior walls — Fresh paint can make a significant difference in the home's appearance
- Resale update kitchen cabinets — Modern cabinets can significantly improve the home's appeal
- Resale update bathroom cabinets — Modern cabinets can significantly improve the home's appeal
- Resale update flooring — Fresh flooring can make a significant difference in the home's appearance
- Both update HVAC/mechanicals — Modern HVAC can improve comfort and energy efficiency
Renovation cost estimate screening
| Repair item | Severity | Est. cost |
|---|---|---|
| kitchen cabinets · yellow and white cabinets need updating | Moderate | $3,000–15,000 |
| bathroom cabinets · yellow cabinets need updating | Moderate | $3,000–15,000 |
| HVAC/mechanicals · no visible HVAC/mechanicals | Unknown | $500–3,000 |
| Total estimated repair cost · 3 items | $6,500–33,000 |
Value-add ROI direction
- Resale paint interior walls — Fresh paint can make a significant difference in the home's appearance ↑
- Resale update kitchen cabinets — Modern cabinets can significantly improve the home's appeal ↑
- Resale update bathroom cabinets — Modern cabinets can significantly improve the home's appeal ↑
- Resale update flooring — Fresh flooring can make a significant difference in the home's appearance ↑
- Both update HVAC/mechanicals — Modern HVAC can improve comfort and energy efficiency ↑
ⓘ Cost ranges are severity-bucket heuristics (US national rule-of-thumb). Get contractor quotes + a written scope before underwriting a rehab budget.
Schools (NCES district)
- District
- Palm Springs Unified
- NCES district ID
- 0629550
- Math proficiency
- 21% ▼ -7.00%
- Reading proficiency
- 42% ▬ 0.00%
- Median HH income
- $43,638
- Composite
- 26.76/100
- National rank
- #7131
- State rank
- #328 of 517 in CA
Livability — Desert Edge
- Score
- 68/100
- State rank
- #297
- US rank
- #9953
Category grades
Schools grade is shown separately in the Schools card above.
Census & demographics
- Census place
- Desert Edge, CA
- Population (ZIP)
- 8,624
Population outlook (Riverside County) Hauer SSP2
- Today (2025)
- 2,664,475 people
- By 2030
- 2,802,692 · +5.2%
- By 2040
- 3,050,904 · +14.5%
- By 2050
- 3,256,783 · +22.2%
- By 2075
- 3,655,058 · +37.2%
- By 2100
- 3,766,594 · +41.4%
Race, ethnicity, and origin ACS 2023
- Race & ethnicity
- White 50% Hispanic / Latino 46% Two or more races 16% Asian 2% Native American 1%
- Hispanic origin (detail)
- Mexican 36%
- Common ancestry
- Lithuanian 3% Slovak 2% Portuguese 2%
- Foreign-born
- 28% · Canada, South Korea
- Languages at home
- 57% English-only · Spanish 38% Chinese 1% Russian/Polish/Slavic 1%
Political lean MEDSL · Riverside
- 2024 margin
- Toss-up / Even · D 48.0% · R 49.3% · Other 2.6%
- 2008→2024 swing
- -3.6pp toward R · 2008: 2.3pp · 2024: -1.3pp
- All cycles
- 2024: R+1.3 2020: D+8.0 2016: D+4.3 2012: R+0.4 2008: D+2.3
Not yet ingested
- Civics
- —
Market trends
- HPI YoY
- ▼ -118.23%
- Current HPI
- 400.5663
- Rent YoY
- —
- Metro
- —
- State GDP YoY
- ▲ 3.21%
- F500 in state
- 116
Industry mix (Fortune 500 HQ in CA)
| Industry | F500 HQs | Revenue |
|---|---|---|
| Technology | 27 | $1,492B |
|
||
| Financial Services | 3 | $174B |
|
||
| Retail | 3 | $44B |
|
||
| Insurance | 3 | $26B |
|
||
| Media / Entertainment | 2 | $115B |
|
||
| Pharmaceuticals / Biotech | 2 | $62B |
|
||
Price history
-46.6% since first listed5 events — show timeline
- 2026-05-28 Listed $79,000 GPSMLS
- 2026-05-01 Listing Removed — GPSMLS
- 2026-04-03 Price Changed $109,099 GPSMLS
- 2026-03-19 Price Changed $130,000 GPSMLS
- 2025-12-03 Listed $148,000 GPSMLS
Cash-flow waterfall
monthlySold comps — $/sqft
last 12 mo · ≤1 miLoading sold comps…