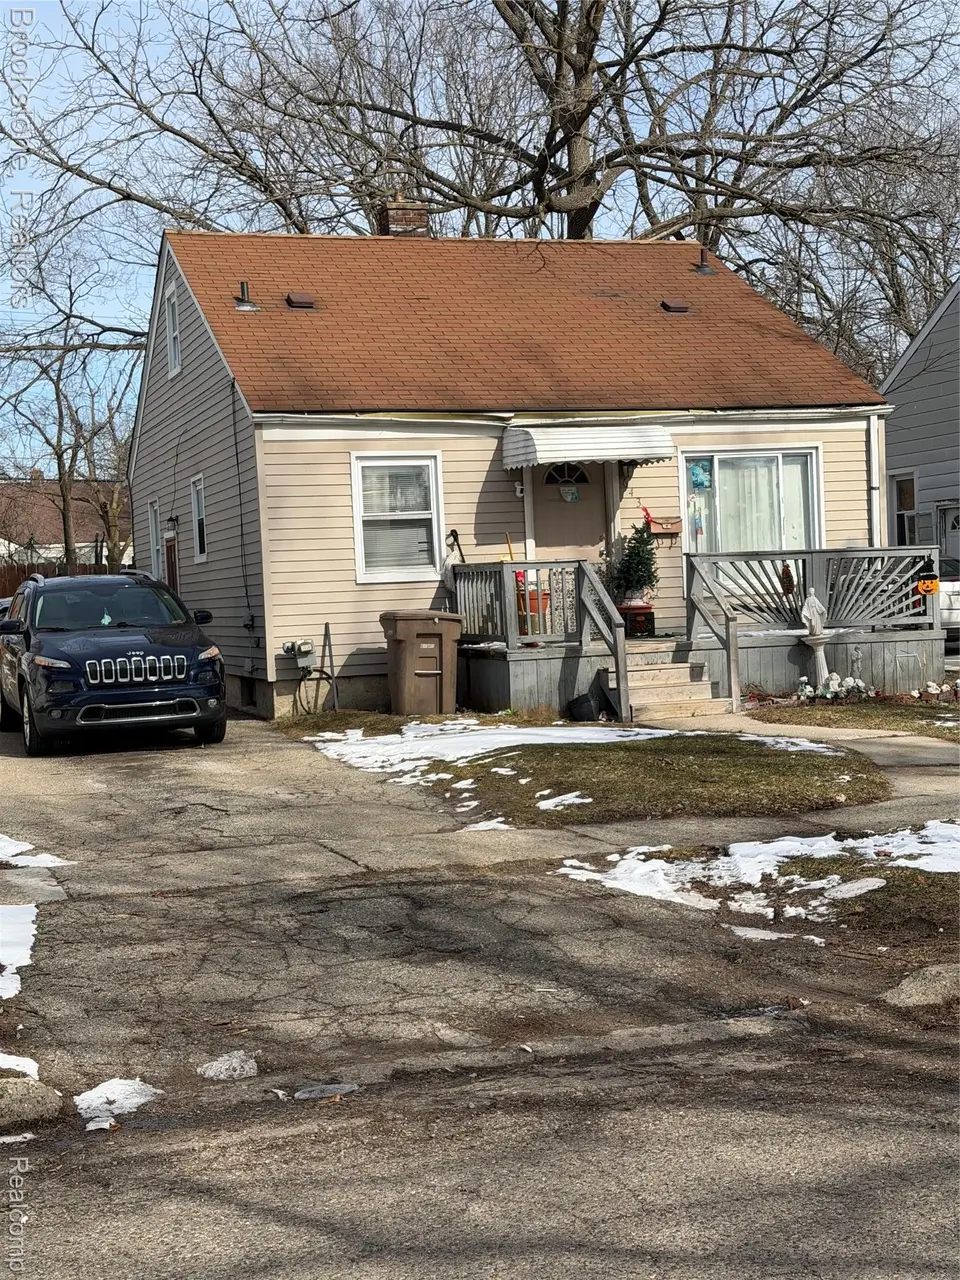
643 E Mansfield Ave · Pontiac, MI
Flood risk 7/10 · Major
- FEMA flood zone
- X (unshaded)
- Chance of flooding over 30 yrs
- 0.76%
- Est. flood insurance / yr
- $507 – $1,088
Fire risk 1/10 · Minimal
- Est. fire insurance / yr
- $784 – $1,456
Heat risk 2/10 · Minimal
- Hot days now (above 96°F)
- 7 days/yr
- Hot days in 30 yrs
- 15 days/yr
Wind risk 2/10 · Minimal
- Chance of severe wind over 30 yrs
- —
Air-quality risk 3/10 · Minor
- Unhealthy air days now
- 2 days/yr
- Unhealthy air days in 30 yrs
- 4 days/yr
Risk factors via First Street. Map © Google.
Why this score? — see what drove the B- grade
The composite is a weighted blend of 9 inputs, each scored 0–100. Each bar is that input's sub-score; the figure is the points it added to the 100-point composite (weight × sub-score).
- Cash flow +29.0/30.0
- ARV discount +11.2/15.0
- DSCR +10.0/10.0
- 1% rule +7.3/10.0
- Rent growth +3.7/5.0
- Livability +3.2/5.0
- Condition / age +2.5/5.0
- Schools +1.0/10.0
- Appreciation +0.0/10.0
$127,000
🖨 Deal sheet 📄 Offer letter ✓ Due diligence
Listing remarks MLS
six properties in Pontiac that are being sold as a package or can be bought individually. There is plenty of upside to increase rents. Right now they are all way below market value. These properties are currently tenant occupied. There will be no showing until there is an accepted offer. 1. 643 E. Mansfield Pontiac, Michigan. property is worth anywhere from $125,000-$140,000. Monthly rent is $750 and the yearly taxes are $900 2. ? 18 S. Eastway Pontiac, Michigan property is worth anywhere from $170,000 to $185,000 monthly rent is $750 and the year taxes are $810 3. ? 29 W. Rutgers Pontiac, Michigan property is worth anywhere from $150,000-$170,000 monthly rent is $900 and the yearly taxes are. $1230 4. ? 82 Earlmoor Blvd. , Pontiac, properties worth anywhere from $130,000-$150,000 monthly rent is $700 and the yearly taxes are $790 5. ?300 E Princeton Pontiac, property is worth anywhere from $140,000-$160,000 monthly rent is $945 and the yearly taxes are $1200 6. ? 647 E. Mansfield Pontiac, properties worth anywhere from $110,000-$130,000 monthly rent is $1000 and the yearly taxes are $730 possible airbnb investment property with tremendous upside also flip opportunity
Key facts
- 5,227 sq ft lot
- Built 1950
- Listed 111 days
Neighborhood map
What this means for you Summary
Snapshot
- This is a 3-bed/1.0-bath single-family listed at $127k.
Deal economics
- At list price, monthly cash flow is $370 ($4k/yr) — positive.
- The deal already cash-flows at list — no discount required.
- Meets the 1% rule at list price ($2k rent vs $127k).
- Recommended offer: $116k (9.0% below list) — sets the bar for market timing.
- Cap rate 10.4% vs local median 6.7% in Pontiac — top-decile yield for the area; either an underpriced asset or a hidden risk that comps aren't pricing in. Stress-test before assuming the spread holds.
Location & tenants
- Location reads 64/100 on livability (#499 in MI) — a middle-class / working-renter tenant base. Strengths: commute A+, cost of living A+, housing A+; Watch: health & safety D, schools F, crime F.
- Pontiac City School District (urban): math 8% / reading 17% proficiency, ranked #514 of 540 in MI (top 95%) — low school quality limits family demand, transient renter base, plan for 1-2y turnover; 81% free/reduced lunch — lower-income household profile, screen leases tightly.
- Market conditions: Rents rising fast (+4.7%/yr); 83 active listings in the ZIP; 9 comparable units currently listed for rent nearby; rentals at typical pace (median 24d on market — plan ~3-4 weeks tenant-placement turnaround); 44% of comp listings sitting > 30 days — soft ceiling on asking rent; 2,614 units permitted in Oakland County in 2024 (721 in 5+ unit buildings).
- This rent runs 39% of the median local income ($48k/yr) — at the standard rent-burdened threshold; future hikes will face affordability resistance.
Forward outlook
- Local home prices are declining (-3.0%/yr); year-one equity from $878 of loan paydown is wiped out by about $4k of value loss. Plan a longer hold.
- Oakland County population projected at +10% by 2050 — modest demand growth; plan on rents tracking national, not racing it.
- At projected returns (-3.0% appreciation + 4.7% rent growth), your $36k cash investment doubles in ~8 years — after that, you're playing with house money.
Negotiation context
- It's been on market 111 days — a 9% lower offer ($116k) is reasonable based on typical stale-listing flexibility.
- 6 sale attempts since 23y ago with the ask held roughly flat each time — persistent listings suggest the price (not the market) is what's stuck; bring a comps-based counter.
- Current owner paid $93k; 37% above their basis — modest negotiation headroom, anchor on the comps not their cost.
Risks & watch-outs
- Watch-outs: flood insurance adds $66/mo; built in 1950 — expect roof / HVAC / electrical / plumbing capex.
- Climate carrying-cost: major flood risk — expect insurance premiums to compound above CPI over the hold.
Questions for the listing agent
- It's been on market 111 days. Have you received any prior offers? Is the seller open to a 9% concession, seller financing, or rate buy-down credit?
- Built in 1950 — when were the roof, HVAC, electrical panel, plumbing, and water heater last replaced?
- What's the actual annual flood-insurance premium (NFIP or private), and is the property in a SFHA with mandatory coverage?
- Why hasn't it sold? Are there any deal-killer items the seller is aware of (foundation, flood, title, zoning, code violations)?
- Is there a deadline driving the sale (1031 exchange, divorce, estate, relocation)? That informs how much negotiation room exists.
- Schools are F-rated, which usually means shorter tenancies and higher turnover. Who's the typical renter profile here, and what's been the actual vacancy rate?
- Crime grade is F in this area — have there been break-ins, vandalism, or insurance claims at this property in the last 3 years? What carrier currently insures it and at what premium?
- What's the average days-on-market for RENTAL listings here right now (not sales)? A rising rental-DOM trend means longer vacancies and softer asking-rent achievability than the comps imply.
- What's the recent tenant-quality profile in this submarket — average credit score on applications, eviction rate, late-payment / NSF rate, and stable-employment percentage? A property-management company in the area should have these aggregated.
- How much new for-sale + rental construction is in the pipeline within 1–3 miles? Heavy new supply typically softens prices + rents 12–24 months out; constrained supply supports both.
Investment metrics
- 1% rule
- 1.23% ✓
- Cap rate
- 10.41%
- Cash-on-cash
- 14.72%
- DSCR
- 1.65
- GRM
- 6.8
CMA / ARV
- ARV (median comp)
- $138,231
- List price
- $127,000
- Delta
- -8.12%
- Verdict
- FAIR
- Comps
- 20 within 1.0 mi
Show comp detail 12 sales within ~0.75 mi
| Address | Dist | Beds/Ba | Sqft | Sold | Price | $/sf | Match |
|---|---|---|---|---|---|---|---|
| 594 E Mansfield Ave | 0.09mi | 3/1.0 | 1,774 (+5%) | 3mo | $195,000 | $110 | 85 |
| 595 E Tennyson Ave | 0.11mi | 3/1.0 | 1,552 (-8%) | 4mo | $180,000 | $116 | 78 |
| 635 E Tennyson Ave | 0.06mi | 3/1.0 | 1,460 (-14%) | 0mo | $135,000 | $92 | 74 |
| 576 Markle Ave | 0.33mi | 2/1.0 (-1) | 1,633 (-4%) | 1mo | $155,000 | $95 | 72 |
| 731 1st Ave | 0.26mi | 3/1.5 | 1,604 (-5%) | 7mo | $175,000 | $109 | 71 |
| 615 Lenox Ave | 0.23mi | 3/1.5 | 1,912 (+13%) | 1mo | $192,000 | $100 | 65 |
| 720 E Columbia Ave | 0.44mi | 3/2.0 | 1,565 (-8%) | 6mo | $111,500 | $71 | 57 |
| 852 Melrose St | 0.57mi | 3/2.0 | 1,569 (-7%) | 1mo | $214,000 | $136 | 56 |
| 730 Stirling St | 0.65mi | 4/2.0 (+1) | 1,712 (+1%) | 4mo | $180,000 | $105 | 55 |
| 335 1st Ave | 0.62mi | 2/2.0 (-1) | 1,713 (+1%) | 7mo | $185,000 | $108 | 55 |
| 755 Scottwood St | 0.52mi | 3/1.0 | 1,450 (-14%) | 6mo | $145,000 | $100 | 46 |
| 679 Linda Vista Dr | 0.74mi | 3/1.0 | 1,890 (+12%) | 4mo | $150,000 | $79 | 43 |
Match score weights: distance 35% · size 25% · config 20% · recency 20%. Top-matched comps best support the ARV.
Projected returns pro-forma
-3.0% appreciation · 4.73% rent growth · sell at horizon
- IRR
- 4.1%
- Equity multiple
- 1.16×
- Total profit
- $5,743
- Equity at exit
- $18,936
- IRR
- 15.1%
- Equity multiple
- 2.32×
- Total profit
- $47,110
- Equity at exit
- $10,981
Cash invested: $35,560 (down + closing). Projections, not guarantees.
Landlord ↔ Tenant lean methodology
- Overall (STATE)
- 62 Landlord-Friendly
- State Michigan
- 62 Landlord-Friendly · EVEN
- County
- — inherits STATE
- City
- — inherits STATE
ZIP-level market 48340
- Rents YoY
- 4.7%
- Active inventory
- 83
- Price-to-rent
- 6.8×
Monthly cashflow live
- Estimated rent
- $1,558 high interval (Pro) →
- Mortgage (P&I)
- −$666
- Tax from tax record
- −$76 /mo · $912/yr
- Insurance
- −$53
- Flood insurance flood zone
- −$66 /mo · $798/yr
- HOA
- −$0
- Vacancy / Maint / Mgmt
- −$327
- Net cashflow
- $370
Break-even live
UW: 25.0% down · 7.5% · 30yr · 1.5% tax · 5.0% vac · 8.0% maint · 8.0% mgmt
Financing live
Cash to close
- Down payment
- $31,750
- Closing costs
- $3,810
- Reserves months
- —
- Total cash needed
- —
Loan-product check · same deal, 3 products live
Conventional
25% down · 7.5% · 30yr
- Down + closing
- —
- Monthly P&I
- —
- Monthly cashflow
- —
- DSCR
- —
- Eligible?
- —
Personal DTI + credit; lowest rate.
DSCR
20% down · 8.5% · 30yr
- Down + closing
- —
- Monthly P&I
- —
- Monthly cashflow
- —
- DSCR
- —
- Eligible?
- —
No personal income docs; deal must DSCR.
Hard money
10% down · 12.0% · 12mo
- Down + closing
- —
- Monthly P&I
- —
- Monthly cashflow
- —
- DSCR
- —
- Eligible?
- —
Short-term bridge; refi at stabilization.
Rent comps 9 comps
| Address | Beds | Baths | Sqft | Rent | $/sqft | DOM | Units | Dist |
|---|---|---|---|---|---|---|---|---|
| 264 Nelson St Pontiac, MI | 3.0 | 1.0 | 1478 | $1,590 | $1.08 | 43d | 1 | 0.81mi |
| 188 Vernon Dr Pontiac, MI | 3.0 | 1.0 | 1100 | $1,500 | $1.36 | 24d | 1 | 0.86mi |
| 863 Amanda Ln Pontiac, MI | 3.0 | 2.0 | 1434 | $1,800 | $1.26 | 20d | 1 | 0.94mi |
| 90 Marquette St Pontiac, MI | 3.0 | 1.0 | 1886 | $1,800 | $0.95 | 43d | 1 | 0.96mi |
| 505 Old Oak Ct Pontiac, MI | 2.0 | 1.0 | 1100 | $1,299 | $1.18 | 43d | 1 | 1.18mi |
| 16 Victory Dr Unit 18 Pontiac, MI | 2.0 | 1.0 | 1118 | $1,150 | $1.03 | 43d | 1 | 1.19mi |
| 16 Victory Dr Unit 18 Pontiac, MI | 2.0 | 1.0 | 1114 | $1,150 | $1.03 | 24d | 1 | 1.19mi |
| 1221 Colony Ln Pontiac, MI | 1.0–2.0 | 1.0–1.5 | 950 | $1,250 | $1.32 | 1d | 3 | 1.40mi |
| 49 Oakhill St Pontiac, MI | 3.0 | 1.0 | 1200 | $1,575 | $1.31 | 24d | 1 | 1.41mi |
Listing history 29 events
-
2026-06-18days on market $127,000 Active 111 DOM
-
2026-06-17days on market $127,000 Active 110 DOM
-
2026-06-16days on market $127,000 Active 109 DOM
-
2026-06-15days on market $127,000 Active 108 DOM
-
2026-06-13days on market $127,000 Active 106 DOM
-
2026-06-13days on market $127,000 Active 105 DOM
-
2026-06-09days on market $127,000 Active 102 DOM
-
2026-06-08days on market $127,000 Active 101 DOM
-
2026-06-07days on market $127,000 Active 100 DOM
-
2026-06-04days on market $127,000 Active 97 DOM
-
2026-06-03days on market $127,000 Active 96 DOM
-
2026-06-02days on market $127,000 Active 95 DOM
-
2026-06-01days on market $127,000 Active 94 DOM
-
2026-05-31days on market $127,000 Active 93 DOM
-
2026-02-27$127,000 Active 1190-char remark
Show marketing remark (1186 chars)
six properties in Pontiac that are being sold as a package or can be bought individually. There is plenty of upside to increase rents. Right now they are all way below market value. These properties are currently tenant occupied. There will be no showing until there is an accepted offer. 1. 643 E. Mansfield Pontiac, Michigan. property is worth anywhere from $125,000-$140,000. Monthly rent is $750 and the yearly taxes are $900 2. ? 18 S. Eastway Pontiac, Michigan property is worth anywhere from $170,000 to $185,000 monthly rent is $750 and the year taxes are $810 3. ? 29 W. Rutgers Pontiac, Michigan property is worth anywhere from $150,000-$170,000 monthly rent is $900 and the yearly taxes are. $1230 4. ? 82 Earlmoor Blvd. , Pontiac, properties worth anywhere from $130,000-$150,000 monthly rent is $700 and the yearly taxes are $790 5. ?300 E Princeton Pontiac, property is worth anywhere from $140,000-$160,000 monthly rent is $945 and the yearly taxes are $1200 6. ? 647 E. Mansfield Pontiac, properties worth anywhere from $110,000-$130,000 monthly rent is $1000 and the yearly taxes are $730 possible airbnb investment property with tremendous upside also flip opportunity
-
2026-02-27$127,000 Active 1186-char remark
Show marketing remark (1186 chars)
six properties in Pontiac that are being sold as a package or can be bought individually. There is plenty of upside to increase rents. Right now they are all way below market value. These properties are currently tenant occupied. There will be no showing until there is an accepted offer. 1. 643 E. Mansfield Pontiac, Michigan. property is worth anywhere from $125,000-$140,000. Monthly rent is $750 and the yearly taxes are $900 2. ? 18 S. Eastway Pontiac, Michigan property is worth anywhere from $170,000 to $185,000 monthly rent is $750 and the year taxes are $810 3. ? 29 W. Rutgers Pontiac, Michigan property is worth anywhere from $150,000-$170,000 monthly rent is $900 and the yearly taxes are. $1230 4. ? 82 Earlmoor Blvd. , Pontiac, properties worth anywhere from $130,000-$150,000 monthly rent is $700 and the yearly taxes are $790 5. ?300 E Princeton Pontiac, property is worth anywhere from $140,000-$160,000 monthly rent is $945 and the yearly taxes are $1200 6. ? 647 E. Mansfield Pontiac, properties worth anywhere from $110,000-$130,000 monthly rent is $1000 and the yearly taxes are $730 possible airbnb investment property with tremendous upside also flip opportunity
-
2011-11-17historical
-
2011-11-16historical
-
2011-11-16historical
-
2010-03-04$19,900
-
2010-03-04$19,900
-
2010-03-04$19,900
-
2003-07-30soldstatus $93,000
-
2003-06-27soldstatus $93,000
-
2003-04-29$97,000
-
1997-11-25soldstatus $38,000
-
1997-11-25soldstatus $57,900
-
1995-06-15soldstatus $38,000
-
1989-11-28soldstatus $23,000
ⓘ Source: listings_history table (triggers on properties + properties_extension) + one-shot
backfill from property_details.listing_events for pre-trigger history.
Tax reassessment forecast MI · Partial reset (capped growth)
- Current annual tax
- $912 · $76/mo
- Projected year-2 tax
- $1,434 · $119/mo
- Expected delta
- +$522/yr (+$43/mo · 57.2%)
ⓘ Screening estimate from a state-policy table — verify with the county assessor before closing.
Climate risk First Street
- Flood 7/10 Severe FEMA zone X (unshaded) · 76% chance over 30 yrs
- Wildfire 1/10 Low
- Heat 2/10 Low 7 d/yr ≥96°F today · 15 d/yr by 30 yrs out
- Wind 2/10 Low
- Air quality 3/10 Moderate 2 unhealthy d/yr today · 4 by 30 yrs out
Nearby sold comps map
Loading sold comps map…
Walkable amenities ~0.75 mi
Loading nearby amenities…
Taxation est. · year 1
- Rental income
- $18,701
- − Mortgage interest
- −$7,114
- − Property taxes
- −$912
- − Insurance
- −$1,432
- − Repairs & maintenance
- −$1,496
- − Management
- −$1,496
- − Depreciation
- −$3,695
- Taxable income
- $2,556
- Est. tax owed @ 24.0%
- −$613
- After-tax cash flow
- $3,824/yr
For passive investors: Depreciation is non-cash, so a rental often shows a tax loss while cash-flowing — sheltering income. Rental losses are passive: they offset passive income freely, and up to $25,000/yr can offset ordinary (W-2) income if you actively participate and your MAGI is under $100k (phasing out to $0 by $150k); unused losses carry forward. On sale, claimed depreciation is recaptured at up to 25%, and gains may owe capital-gains tax (a 1031 exchange can defer both). Figures are a year-1 estimate at your 24.0% rate — not tax advice; consult a CPA.
Schools (NCES district)
- District
- Pontiac City School District
- NCES district ID
- 2628740
- Math proficiency
- 8% ▼ -5.00%
- Reading proficiency
- 17% ▼ -3.00%
- Median HH income
- $33,888
- Composite
- 10.12/100
- National rank
- #9802
- State rank
- #514 of 540 in MI
Livability — Pontiac
- Score
- 64/100
- State rank
- #499
- US rank
- #14703
Category grades
Schools grade is shown separately in the Schools card above.
Census & demographics
- Census place
- Pontiac, MI
- County
- Oakland County · 1,009,092 people
- City population
- 44,593
- Metro
- Detroit-Warren-Dearborn, MI
- Population (ZIP)
- 25,669
- Household income
- $47,891
- Rent vs Own
- Severe rent burden
- 1460.0
Population outlook (Oakland County) Hauer SSP2
- Today (2025)
- 1,335,747 people
- By 2030
- 1,375,100 · +2.9%
- By 2040
- 1,435,385 · +7.5%
- By 2050
- 1,469,250 · +10.0%
- By 2075
- 1,531,946 · +14.7%
- By 2100
- 1,450,485 · +8.6%
Race, ethnicity, and origin ACS 2023
- Neighborhood character
- Highly diverse neighborhood (Simpson 0.73)
- Race & ethnicity
- Black 31% Hispanic / Latino 31% White 29% Two or more races 22% Asian 4%
- Hispanic origin (detail)
- Mexican 18% Puerto Rican 7%
- Common ancestry
- Lithuanian 2% Romanian 2% Serbian 1%
- Foreign-born
- 11% · Canada, China
- Languages at home
- 74% English-only · Spanish 23% Other Asian/Pacific 2% Chinese 1%
Political lean MEDSL · Oakland
- 2024 margin
- D (+10.6) · D 54.4% · R 43.8% · Other 1.9%
- 2008→2024 swing
- -3.9pp toward R · 2008: 14.5pp · 2024: 10.6pp
- All cycles
- 2024: D+10.6 2020: D+14.1 2016: D+8.1 2012: D+8.1 2008: D+14.5
Not yet ingested
- Civics
- —
Market trends
- HPI YoY
- ▼ -295.80%
- Current HPI
- 177.961
- Rent YoY
- ▲ 4.73%
- Metro
- Detroit-Warren-Dearborn, MI
- State GDP YoY
- ▲ 1.37%
- F500 in state
- 28
Industry mix (Fortune 500 HQ in MI)
| Industry | F500 HQs | Revenue |
|---|---|---|
| Automotive Parts | 3 | $48B |
|
||
| Automotive | 2 | $372B |
|
||
| Chemicals | 1 | $45B |
|
||
| Automotive Retail | 1 | $29B |
|
||
| Healthcare / Medical Devices | 1 | $23B |
|
||
| Automotive Technology | 1 | $20B |
|
||
Price history
+452.2% since first listed15 events — show timeline
- 2026-02-27 Listed $127,000 MiRealSource-MiMLS
- 2026-02-27 Listed $127,000 REALCOMP
- 2011-11-17 Listing Removed — MiRealSource-MiMLS
- 2011-11-16 Listing Removed — REALCOMP
- 2011-11-16 Listing Removed — MiRealSource-MiMLS
- 2010-03-04 Listed $19,900 REALCOMP
- 2010-03-04 Listed $19,900 MiRealSource-MiMLS
- 2010-03-04 Listed $19,900 MiRealSource-MiMLS
- 2003-07-30 Sold (Public Records) $93,000 Public Records
- 2003-06-27 Sold (MLS) $93,000 REALCOMP
- 2003-04-29 Listed $97,000 REALCOMP
- 1997-11-25 Sold (Public Records) $57,900 Public Records
- 1997-11-25 Sold (Public Records) $38,000 Public Records
- 1995-06-15 Sold (Public Records) $38,000 Public Records
- 1989-11-28 Sold (Public Records) $23,000 Public Records
Property tax history
-0.3%/yrLatest (2025): $912 · -43.9% YoY. Source: county tax records.
Cash-flow waterfall
monthlySold comps — $/sqft
last 12 mo · ≤1 miLoading sold comps…