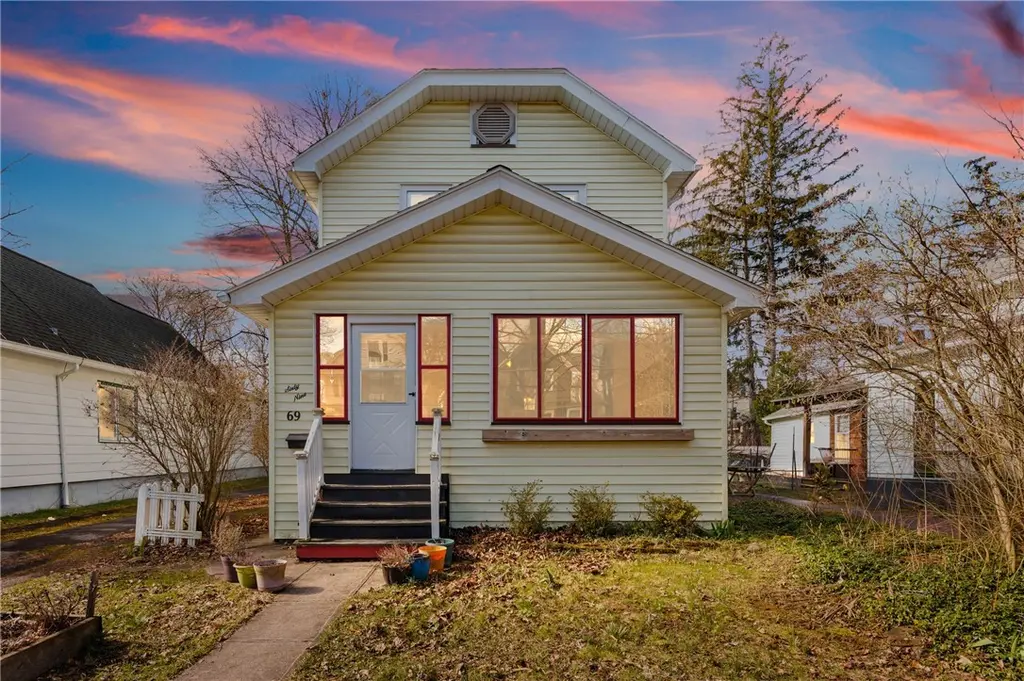
69 Benton St · Rochester, NY
Flood risk 1/10 · Minimal
- FEMA flood zone
- X (unshaded)
- Chance of flooding over 30 yrs
- 0.0%
- Est. flood insurance / yr
- $473 – $860
Fire risk 1/10 · Minimal
- Est. fire insurance / yr
- $691 – $1,283
Heat risk 2/10 · Minimal
- Hot days now (above 96°F)
- 7 days/yr
- Hot days in 30 yrs
- 15 days/yr
Wind risk 1/10 · Minimal
- Chance of severe wind over 30 yrs
- —
Air-quality risk 2/10 · Minimal
- Unhealthy air days now
- 1 days/yr
- Unhealthy air days in 30 yrs
- 1 days/yr
Risk factors via First Street. Map © Google.
Why this score? — see what drove the B- grade
The composite is a weighted blend of 9 inputs, each scored 0–100. Each bar is that input's sub-score; the figure is the points it added to the 100-point composite (weight × sub-score).
- Cash flow +25.9/30.0
- ARV discount +15.0/15.0
- DSCR +8.7/10.0
- 1% rule +6.3/10.0
- Livability +3.8/5.0
- Rent growth +2.8/5.0
- Condition / age +2.5/5.0
- Schools +1.9/10.0
- Appreciation +0.0/10.0
$149,000
🖨 Deal sheet (PDF) 📄 Offer letter ✓ Due diligence
Listing remarks MLS
SOUTH WEDGE 2 Story Colonial !! Enclosed front porch, Hardwood floors, Natural wood trim and doors. Formal dining. Double lot with lush gardens. Absolute charmer! 2 Bedroom, easily converted back to 3. This home will not last!!! Be sure to come to the Open House Sunday 3/11/18 from 1pm-3pm. NO SHOWINGS until Open House, offers to be accepted after 3pm 3/11/18
Key facts
- Enclosed front porch
- Chicken coop
- 6,386 sq ft lot
Tags
Neighborhood map
What this means for you Summary
Snapshot
- This is a 2-bed/1.0-bath single-family listed at $149k.
Deal economics
- At list price, monthly cash flow is $366 ($4k/yr) — positive.
- The deal already cash-flows at list — no discount required.
- Meets the 1% rule at list price ($2k rent vs $149k).
Location & tenants
- Location reads 76/100 on livability (#222 in NY, #3,482 nationally) — a middle-class / working-renter tenant base. Strengths: commute A+, cost of living A+, housing A+; Watch: crime F, employment F.
- Rochester City School District (urban): math 21% / reading 26% proficiency, ranked #589 of 590 in NY (top 100%) — low school quality limits family demand, transient renter base, plan for 1-2y turnover; 82% free/reduced lunch — lower-income household profile, screen leases tightly.
- Zoned schools: Anna Murray-Douglass Academy (math 8% / reading 12%, grade F, #2,075 of 2,108 statewide, top 99%, 757 students, 86% FRL); East Lower School (math 2% / reading 22%, grade F, #715 of 729 statewide, top 98%, 304 students, 86% FRL); Edison Career And Technology High School (math 44% / reading 50%, grade D-, #1,007 of 1,100 statewide, top 93%, 1,233 students, 91% FRL).
- Market conditions: Rents rising (+1.2%/yr); 76 active listings in the ZIP; 40 comparable units currently listed for rent nearby; rentals at typical pace (median 23d on market — plan ~3-4 weeks tenant-placement turnaround); 1,169 units permitted in Monroe County in 2024 (591 in 5+ unit buildings).
- This rent runs 33% of the median local income ($62k/yr) — at the standard rent-burdened threshold; future hikes will face affordability resistance.
Forward outlook
- Local home prices are declining (-3.0%/yr); year-one equity from $1k of loan paydown is wiped out by about $4k of value loss. Plan a longer hold.
- Monroe County population projected to shrink 6% by 2050 — rents likely to lag national; underwrite the cash flow, not the appreciation.
Negotiation context
- Only 7 days on market — expect competitive offers; lowballing is unlikely to land.
- 3 sale attempts since 11y ago with the ask held roughly flat each time — persistent listings suggest the price (not the market) is what's stuck; bring a comps-based counter.
- Current owner paid $114k; 31% above their basis — modest negotiation headroom, anchor on the comps not their cost.
Risks & watch-outs
- Watch-outs: built in 1927 — expect roof / HVAC / electrical / plumbing capex.
Questions for the listing agent
- Built in 1927 — when were the roof, HVAC, electrical panel, plumbing, and water heater last replaced?
- Is there a deadline driving the sale (1031 exchange, divorce, estate, relocation)? That informs how much negotiation room exists.
- Schools are D-rated, which usually means shorter tenancies and higher turnover. Who's the typical renter profile here, and what's been the actual vacancy rate?
- Crime grade is F in this area — have there been break-ins, vandalism, or insurance claims at this property in the last 3 years? What carrier currently insures it and at what premium?
- What's the average days-on-market for RENTAL listings here right now (not sales)? A rising rental-DOM trend means longer vacancies and softer asking-rent achievability than the comps imply.
- What's the recent tenant-quality profile in this submarket — average credit score on applications, eviction rate, late-payment / NSF rate, and stable-employment percentage? A property-management company in the area should have these aggregated.
- How much new for-sale + rental construction is in the pipeline within 1–3 miles? Heavy new supply typically softens prices + rents 12–24 months out; constrained supply supports both.
Investment metrics
- 1% rule
- 1.13% ✓
- Cap rate
- 9.24%
- Cash-on-cash
- 10.52%
- DSCR
- 1.47
- GRM
- 7.4
CMA / ARV
- ARV (on-the-fly)
- $222,264
- Comps found
- 12
Show comp detail 12 sales within ~0.75 mi
| Address | Dist | Beds/Ba | Sqft | Sold | Price | $/sf | Match |
|---|---|---|---|---|---|---|---|
| 69 Benton St | 0.00mi | 2/1.0 | 1,176 (0%) | 1mo | $227,222 | $193 | 99 |
| 755 Goodman St S | 0.24mi | 3/1.0 (+1) | 1,220 (+4%) | 1mo | $153,500 | $126 | 76 |
| 78 Sanford St | 0.54mi | 2/2.0 | 1,176 (0%) | 2mo | $300,000 | $255 | 69 |
| 185 Caroline St | 0.08mi | 3/1.0 (+1) | 1,334 (+13%) | 1mo | $242,005 | $181 | 68 |
| 140 Oakland St | 0.20mi | 2/1.5 | 1,298 (+10%) | 6mo | $185,000 | $143 | 67 |
| 24 Bloomfield Pl | 0.38mi | 3/2.0 (+1) | 1,241 (+6%) | 1mo | $215,000 | $173 | 63 |
| 56 Alpine St | 0.43mi | 3/1.5 (+1) | 1,232 (+5%) | 6mo | $375,000 | $304 | 60 |
| 383 Benton St | 0.40mi | 3/1.5 (+1) | 1,257 (+7%) | 6mo | $255,000 | $203 | 58 |
| 61 Allmeroth St | 0.48mi | 3/1.0 (+1) | 1,289 (+10%) | 3mo | $244,000 | $189 | 54 |
| 84 Gregory St | 0.53mi | 3/2.0 (+1) | 1,099 (-6%) | 6mo | $242,500 | $221 | 50 |
| 106 Field St | 0.72mi | 1/1.0 (-1) | 1,247 (+6%) | 6mo | $175,000 | $140 | 47 |
| 38 Hamilton St | 0.63mi | 3/1.0 (+1) | 1,290 (+10%) | 6mo | $210,000 | $163 | 45 |
Match score weights: distance 35% · size 25% · config 20% · recency 20%. Top-matched comps best support the ARV.
Projected returns pro-forma
-3.0% appreciation · 1.2% rent growth · sell at horizon
- IRR
- -2.5%
- Equity multiple
- 0.91×
- Total profit
- $-3,850
- Equity at exit
- $22,216
- IRR
- 5.2%
- Equity multiple
- 1.35×
- Total profit
- $14,748
- Equity at exit
- $12,883
Cash invested: $41,720 (down + closing). Projections, not guarantees.
Landlord ↔ Tenant lean methodology
- Overall (STATE)
- 15 Strongly Tenant-Friendly
- State New York
- 15 Strongly Tenant-Friendly · D+10
- County
- — inherits STATE
- City
- — inherits STATE
ZIP-level market 14620
- Home prices YoY
- -20.1%
- Rents YoY
- 1.2%
- Active inventory
- 76
- Price-to-rent
- 7.4×
Monthly cashflow live
- Estimated rent
- $1,681 high interval (Pro) →
- Mortgage (P&I)
- −$781
- Tax from tax record
- −$119 /mo · $1,426/yr
- Insurance
- −$62
- HOA
- −$0
- Vacancy / Maint / Mgmt
- −$353
- Net cashflow
- $366
Break-even live
Sensitivity live
| Price | -10% $450 | -5% $408 | +0% $366 | +5% $324 | +10% $282 |
|---|---|---|---|---|---|
| Rent | -10% $233 | -5% $299 | +0% $366 | +5% $432 | +10% $499 |
| Rate | -1.0pp $441 | -0.5pp $404 | base $366 | +0.5pp $327 | +1.0pp $288 |
UW: 25.0% down · 7.5% · 30yr · 1.5% tax · 5.0% vac · 8.0% maint · 8.0% mgmt
Financing live
Cash to close
- Down payment
- $37,250
- Closing costs
- $4,470
- Reserves months
- —
- Total cash needed
- —
Loan-product check · same deal, 3 products live
Conventional
25% down · 7.5% · 30yr
- Down + closing
- —
- Monthly P&I
- —
- Monthly cashflow
- —
- DSCR
- —
- Eligible?
- —
Personal DTI + credit; lowest rate.
DSCR
20% down · 8.5% · 30yr
- Down + closing
- —
- Monthly P&I
- —
- Monthly cashflow
- —
- DSCR
- —
- Eligible?
- —
No personal income docs; deal must DSCR.
Hard money
10% down · 12.0% · 12mo
- Down + closing
- —
- Monthly P&I
- —
- Monthly cashflow
- —
- DSCR
- —
- Eligible?
- —
Short-term bridge; refi at stabilization.
Rent comps 40 comps
| Address | Beds | Baths | Sqft | Rent | $/sqft | DOM | Units | Dist |
|---|---|---|---|---|---|---|---|---|
| 355 Caroline St Rochester, NY | 3.0 | 1.0 | 1143 | $1,650 | $1.44 | 23d | 1 | 0.17mi |
| 625 S Goodman St Rochester, NY | 1.0–2.0 | 1.0–2.0 | 868 | $2,506 | $2.89 | 4d | 8 | 0.35mi |
| 256 Gregory St Rochester, NY | 3.0 | 1.0 | 1150 | $1,700 | $1.48 | 45d | 1 | 0.36mi |
| 416 Gregory St Unit Down Rochester, NY | 3.0 | 1.0 | 1374 | $1,995 | $1.45 | 25d | 1 | 0.38mi |
| 209 Gregory St Rochester, NY | 1.0 | 1.0 | 1000 | $1,250 | $1.25 | 45d | 1 | 0.39mi |
| 90 Manor Pkwy Rochester, NY | 2.0 | 1.0 | 600 | $1,485 | $2.48 | 12d | 3 | 0.41mi |
| 694 Broadway Rochester, NY | 2.0 | 1.5 | 1090 | $2,200 | $2.02 | 25d | 1 | 0.45mi |
| 271 Pearl St Unit 273 Rochester, NY | 3.0 | 1.0 | 1200 | $1,795 | $1.50 | 5d | 1 | 0.50mi |
| 451 Averill Ave Rochester, NY | 2.0 | 1.0 | 1352 | $1,695 | $1.25 | 23d | 1 | 0.53mi |
| 451 Averill Ave Rochester, NY | 2.0 | 1.0 | 1352 | $1,695 | $1.25 | 5d | 1 | 0.53mi |
| 463 Averill Ave Unit 451 Averill Rochester, NY | 2.0 | 1.0 | 1352 | $1,695 | $1.25 | 23d | 1 | 0.55mi |
| 108 Boardman St Rochester, NY | 2.0 | 1.0 | 1000 | $1,300 | $1.30 | 45d | 1 | 0.55mi |
| 71 Sanford St Unit 1546304P Rochester, NY | 2.0 | 1.0 | 839 | $4,032 | $4.81 | 16d | 1 | 0.55mi |
| 94 Averill Ave Unit 2 Rochester, NY | 2.0 | 1.0 | 1200 | $1,500 | $1.25 | 5d | 1 | 0.57mi |
| 24 Menlo Pl Rochester, NY | 1.0 | 1.0 | 750 | $1,495 | $1.99 | 5d | 1 | 0.58mi |
| 261 Henrietta St Rochester, NY | 3.0 | 1.0 | 1200 | $1,600 | $1.33 | 12d | 1 | 0.65mi |
| 495 S Clinton Ave Rochester, NY | 2.0 | 1.0 | 1000 | $1,400 | $1.40 | 16d | 1 | 0.65mi |
| 30 Boardman St #1 Rochester, NY | 2.0 | 1.0 | 1050 | $1,600 | $1.52 | 45d | 1 | 0.66mi |
| 3 Sumner Park #3 Rochester, NY | 1.0 | 1.0 | 800 | $1,000 | $1.25 | 46d | 1 | 0.68mi |
| 12 Boardman St Rochester, NY | 2.0 | 1.0 | 1008 | $1,600 | $1.59 | 45d | 1 | 0.69mi |
| 32 Lilac Dr Brighton, NY | 2.0 | 1.0–1.5 | 800 | $1,625 | $2.03 | 23d | 4 | 0.72mi |
| 19-21 Cornell St Rochester, NY | 2.0 | 1.0 | 900 | $1,250 | $1.39 | 25d | 1 | 0.73mi |
| 100 Highland Ave Rochester, NY | 1.0 | 1.0 | 905 | $2,200 | $2.43 | 16d | 1 | 0.74mi |
| 164 Laburnam Cres Rochester, NY | 2.0 | 2.0 | 1328 | $1,900 | $1.43 | 45d | 1 | 0.75mi |
| 123 Griffith St Unit 6 Rochester, NY | 2.0 | 1.0 | 1000 | $950 | $0.95 | 23d | 1 | 0.81mi |
| 56 Clintwood Ct Brighton, NY | 2.0 | 1.0 | 685 | $1,565 | $2.28 | 5d | 1 | 0.82mi |
| 500 Oxford St #1 Rochester, NY | 2.0 | 2.0 | 1400 | $1,800 | $1.29 | 45d | 1 | 0.82mi |
| 450 Oxford St Unit 4 Rochester, NY | 1.0 | 1.0 | 800 | $775 | $0.97 | 45d | 1 | 0.88mi |
| 1600 Elmwood Ave Rochester, NY | 3.0 | 1.0–2.0 | 824 | $1,894 | $2.30 | 20d | 1 | 0.89mi |
| 249 S Goodman St Unit Down Rochester, NY | 1.0 | 1.0 | 910 | $1,695 | $1.86 | 45d | 1 | 0.89mi |
| 965 Monroe Ave Rochester, NY | 2.0 | 1.0 | 1335 | $1,800 | $1.35 | 4d | 1 | 0.90mi |
| 948 Monroe Ave Rochester, NY | 3.0 | 1.0 | 1200 | $1,850 | $1.54 | 4d | 1 | 0.91mi |
| 948 Monroe Ave Rochester, NY | 3.0 | 1.0 | 1200 | $1,850 | $1.54 | 12d | 1 | 0.91mi |
| 209 S Goodman St Rochester, NY | 2.0 | 2.0 | 1500 | $1,700 | $1.13 | 45d | 1 | 0.94mi |
| 9 Rowley St Unit 3 Rochester, NY | 2.0 | 1.0 | 966 | $1,550 | $1.60 | 25d | 1 | 0.95mi |
| 290 Exchange Blvd Rochester, NY | 2.0 | 1.0–2.0 | 892 | $2,102 | $2.36 | 4d | 15 | 0.95mi |
| 36 Tracy St Unit DOWN Rochester, NY | 1.0 | 1.0 | 814 | $1,750 | $2.15 | 45d | 1 | 0.97mi |
| 1577 Elmwood Ave Brighton, NY | 2.0 | 1.0–1.5 | 650 | $1,650 | $2.54 | 20d | 1 | 0.98mi |
| 95 Elmwood Ter Rochester, NY | 1.0–3.0 | 1.0–1.5 | 1107 | $1,915 | $1.73 | 4d | 19 | 0.99mi |
| 56 Cambridge St Unit 4 Rochester, NY | 1.0 | 1.0 | 800 | $920 | $1.15 | 45d | 1 | 1.00mi |
Listing history 10 events
-
2026-04-22status Pending
-
2026-04-15$149,000 Active
-
2018-05-17soldstatus $113,500 Closed Sale or Rented 362-char remark
Show marketing remark (362 chars)
SOUTH WEDGE 2 Story Colonial !! Enclosed front porch, Hardwood floors, Natural wood trim and doors. Formal dining. Double lot with lush gardens. Absolute charmer! 2 Bedroom, easily converted back to 3. This home will not last!!! Be sure to come to the Open House Sunday 3/11/18 from 1pm-3pm. NO SHOWINGS until Open House, offers to be accepted after 3pm 3/11/18
-
2018-05-17soldstatus $113,500
Show marketing remark (362 chars)
SOUTH WEDGE 2 Story Colonial !! Enclosed front porch, Hardwood floors, Natural wood trim and doors. Formal dining. Double lot with lush gardens. Absolute charmer! 2 Bedroom, easily converted back to 3. This home will not last!!! Be sure to come to the Open House Sunday 3/11/18 from 1pm-3pm. NO SHOWINGS until Open House, offers to be accepted after 3pm 3/11/18
-
2018-03-18status Pending Sale 362-char remark
Show marketing remark (362 chars)
SOUTH WEDGE 2 Story Colonial !! Enclosed front porch, Hardwood floors, Natural wood trim and doors. Formal dining. Double lot with lush gardens. Absolute charmer! 2 Bedroom, easily converted back to 3. This home will not last!!! Be sure to come to the Open House Sunday 3/11/18 from 1pm-3pm. NO SHOWINGS until Open House, offers to be accepted after 3pm 3/11/18
-
2018-03-09$104,900 Active 362-char remark
Show marketing remark (362 chars)
SOUTH WEDGE 2 Story Colonial !! Enclosed front porch, Hardwood floors, Natural wood trim and doors. Formal dining. Double lot with lush gardens. Absolute charmer! 2 Bedroom, easily converted back to 3. This home will not last!!! Be sure to come to the Open House Sunday 3/11/18 from 1pm-3pm. NO SHOWINGS until Open House, offers to be accepted after 3pm 3/11/18
-
2015-03-31soldstatus $85,000 218-char remark
Show marketing remark (218 chars)
Highly sought after Swillberg neighborhood. Enclosed front porch, Hardwood floors. Double lot with lush gardens. Newer roof and furnace! Natural wood trim and doors. Formal diningMove in Ready. Close to all. No garage.
-
2015-03-31soldstatus $85,000
Show marketing remark (218 chars)
Highly sought after Swillberg neighborhood. Enclosed front porch, Hardwood floors. Double lot with lush gardens. Newer roof and furnace! Natural wood trim and doors. Formal diningMove in Ready. Close to all. No garage.
-
2015-02-01$85,000 218-char remark
Show marketing remark (218 chars)
Highly sought after Swillberg neighborhood. Enclosed front porch, Hardwood floors. Double lot with lush gardens. Newer roof and furnace! Natural wood trim and doors. Formal diningMove in Ready. Close to all. No garage.
-
2004-12-15soldstatus $67,900
ⓘ Source: listings_history table (triggers on properties + properties_extension) + one-shot
backfill from property_details.listing_events for pre-trigger history.
Tax reassessment forecast NY · Partial reset (capped growth)
- Current annual tax
- $1,426 · $119/mo
- Projected year-2 tax
- $1,972 · $164/mo
- Expected delta
- +$546/yr (+$45/mo · 38.3%)
ⓘ Screening estimate from a state-policy table — verify with the county assessor before closing.
Climate risk First Street
- Flood 1/10 Low FEMA zone X (unshaded) · 0% chance over 30 yrs
- Wildfire 1/10 Low
- Heat 2/10 Low 7 d/yr ≥96°F today · 15 d/yr by 30 yrs out
- Wind 1/10 Low
- Air quality 2/10 Low 1 unhealthy d/yr today · 1 by 30 yrs out
Nearby sold comps map
Loading sold comps map…
Walkable amenities ~0.75 mi
Loading nearby amenities…
Taxation est. · year 1
- Rental income
- $20,175
- − Mortgage interest
- −$8,346
- − Property taxes
- −$1,426
- − Insurance
- −$745
- − Repairs & maintenance
- −$1,614
- − Management
- −$1,614
- − Depreciation
- −$4,335
- Taxable income
- $2,095
- Est. tax owed @ 24.0%
- −$503
- After-tax cash flow
- $3,888/yr
For passive investors: Depreciation is non-cash, so a rental often shows a tax loss while cash-flowing — sheltering income. Rental losses are passive: they offset passive income freely, and up to $25,000/yr can offset ordinary (W-2) income if you actively participate and your MAGI is under $100k (phasing out to $0 by $150k); unused losses carry forward. On sale, claimed depreciation is recaptured at up to 25%, and gains may owe capital-gains tax (a 1031 exchange can defer both). Figures are a year-1 estimate at your 24.0% rate — not tax advice; consult a CPA.
Schools (NCES district)
- District
- Rochester City School District
- NCES district ID
- 3624750
- Math proficiency
- 21% ▬ 0.00%
- Reading proficiency
- 26% ▲ 4.00%
- Median HH income
- $30,923
- Composite
- 18.98/100
- National rank
- #8850
- State rank
- #589 of 590 in NY
Livability — Rochester
- Score
- 76/100
- State rank
- #222
- US rank
- #3482
Category grades
Schools grade is shown separately in the Schools card above.
Census & demographics
- Census place
- Rochester, NY
- County
- Monroe County · 674,131 people
- City population
- 432,803
- Metro
- Rochester, NY
- Population (ZIP)
- 23,769
- Household income
- $61,783
- Rent vs Own
- Severe rent burden
- 2013.0
Population outlook (Monroe County) Hauer SSP2
- Today (2025)
- 759,460 people
- By 2030
- 757,154 · -0.3%
- By 2040
- 740,644 · -2.5%
- By 2050
- 714,443 · -5.9%
- By 2075
- 645,883 · -15.0%
- By 2100
- 547,084 · -28.0%
Race, ethnicity, and origin ACS 2023
- Neighborhood character
- Predominantly White (68%)
- Race & ethnicity
- White 68% Black 12% Asian 9% Hispanic / Latino 6% Two or more races 6%
- Hispanic origin (detail)
- Puerto Rican 3%
- Common ancestry
- Romanian 5% Iranian 3% Lithuanian 2%
- Foreign-born
- 13% · China, Canada, South Korea
- Languages at home
- 85% English-only · Chinese 4% Spanish 4% Other Indo-European 3%
Political lean MEDSL · Monroe
- 2024 margin
- D (+19.1) · D 59.5% · R 40.5%
- 2008→2024 swing
- +1.4pp toward D · 2008: 17.7pp · 2024: 19.1pp
- All cycles
- 2024: D+19.1 2020: D+21.0 2016: D+14.1 2012: D+17.4 2008: D+17.7
Not yet ingested
- Civics
- —
Market trends
- HPI YoY
- ▼ -84.77%
- Current HPI
- 337.6917
- Rent YoY
- ▲ 1.20%
- Metro
- Rochester, NY
- State GDP YoY
- ▲ 2.60%
- F500 in state
- 92
Industry mix (Fortune 500 HQ in NY)
| Industry | F500 HQs | Revenue |
|---|---|---|
| Financial Services | 10 | $950B |
|
||
| Consumer Goods | 9 | $162B |
|
||
| Insurance | 4 | $225B |
|
||
| Telecommunications | 2 | $144B |
|
||
| Pharmaceuticals | 2 | $112B |
|
||
| Media / Entertainment | 2 | $69B |
|
||
Price history
+119.4% since first listed10 events — show timeline
- 2026-04-22 Pending — UNYREIS
- 2026-04-15 Listed $149,000 UNYREIS
- 2018-05-17 Sold (Public Records) $113,500 Public Records
- 2018-05-17 Sold (MLS) $113,500 UNYREIS
- 2018-03-18 Pending — UNYREIS
- 2018-03-09 Listed $104,900 UNYREIS
- 2015-03-31 Sold (Public Records) $85,000 Public Records
- 2015-03-31 Sold (MLS) $85,000 UNYREIS
- 2015-02-01 Listed $85,000 UNYREIS
- 2004-12-15 Sold (Public Records) $67,900 Public Records
Property tax history
+2.1%/yrLatest (2025): $1,426 · +0.0% YoY. Source: county tax records.
Cash-flow waterfall
monthlySold comps — $/sqft
last 12 mo · ≤1 miLoading sold comps…